Distribution
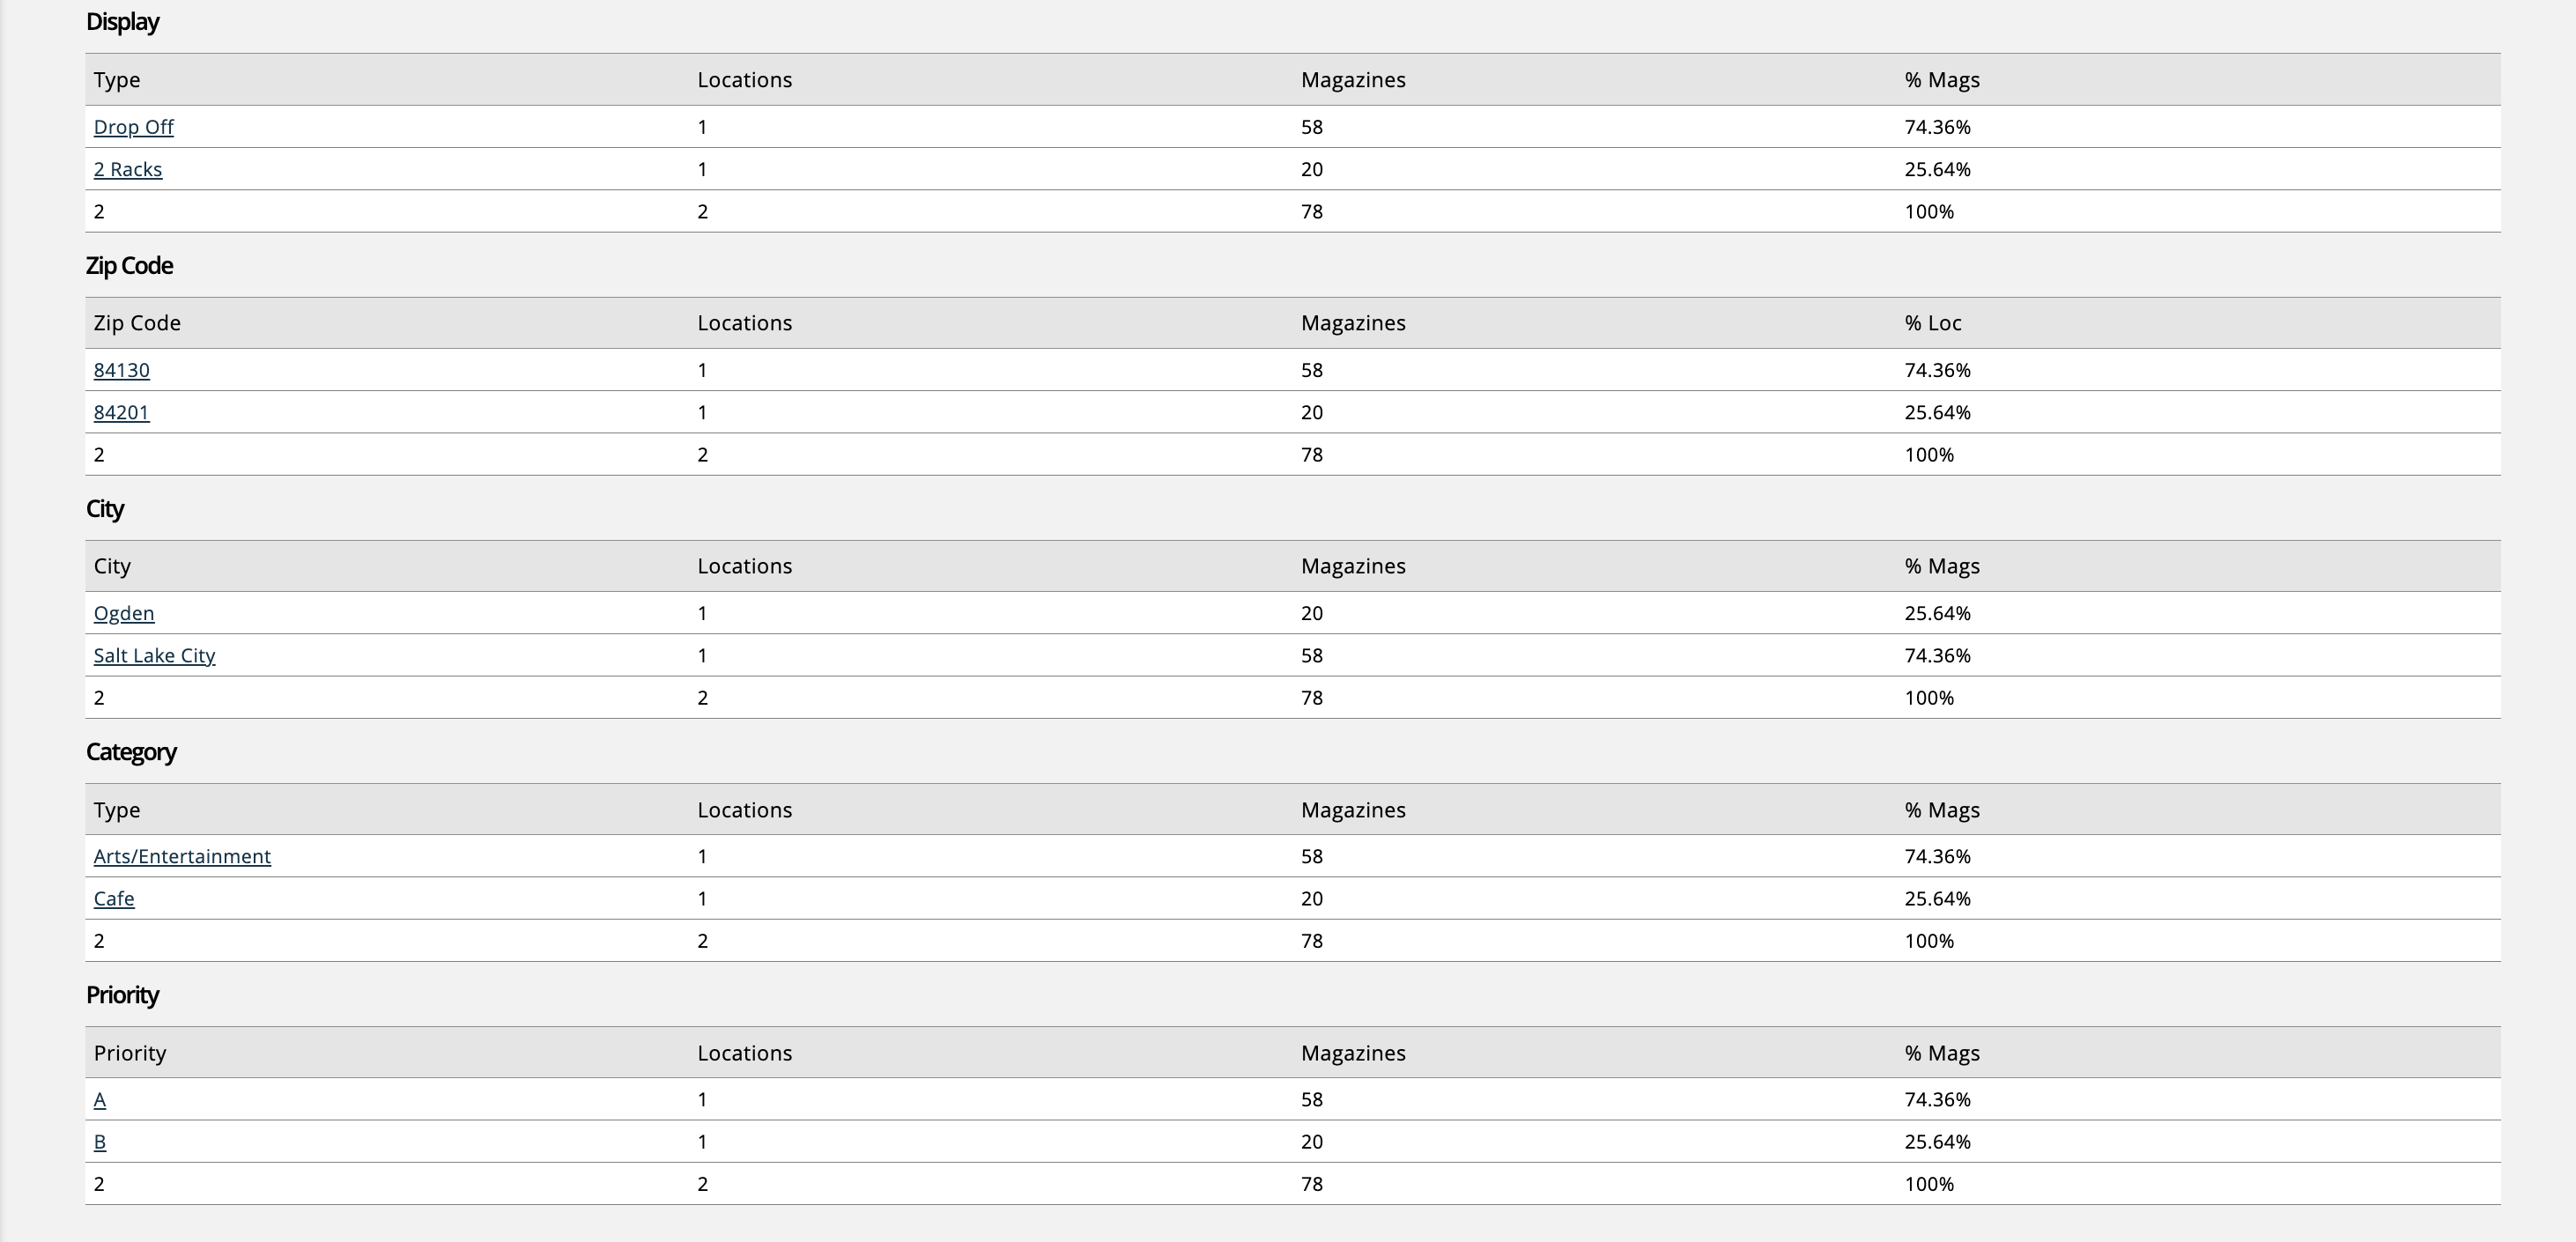
The Distribution Report displays drop-off and location information in both graph and table formats. The graph displays draw and return data, whereas the tables break down distribution information based on display, zip code, city, category, and priority.
Before using this report, we recommend you have the following set up:
To access the report, you must have the User Permission ‘Distribution Report’
Report Search and Results
There are a few search fields you can use to help you find the results you need. You can filter the report by distribution name, publication, location priority, and route, as well as entering a date range. If you need, you can also choose to include both inactive and disabled locations in your results.
The report will show a graph of the draw and returns, based on the number of copies and drop-off dates. By hovering over one of the data points, you can see the exact date and number of copies. Underneath the graph there is a summary table, displaying the total magazines and total magazines to distribute, as well as the number of drop-offs and locations that fit the search criteria.
The report also displays tables that break down the data by Display, Zip Code, City, Category, and Priority, with data showing for the total locations and magazines for each. The % Mag and % Loc fields are calculated by how many magazines fall under each item. For example, if you are distributing 100 magazines for two categories, and the first category is receiving 25 of those magazines, then the % Mag would be 25% for the first category, and 75% for the second.
Each table also contains quick links that will bring you to the Distribution Locations search page with certain fields automatically filled in.