Annual Sales by Month
The report shows the sales by month for reps. You can use this report to see how much your reps have sold for upcoming months for a publication(s) and compare it to the previous year to track your trends. You can also drill down to a snapshot report or the issue comparisons report.
To access this report, you need the User Permission 'Annual Sales by Month Report'. To view data for all users, you also need the sub-permission 'View All Users'.
You can change the results that are returned by using the search fields, including start month and start year, probability, publisher, and product type. The results can be grouped either by Rep or Product. You also have the option of including or excluding tax amounts, using gross sales rather than net, using the fiscal calendar, and including data about the previous year.
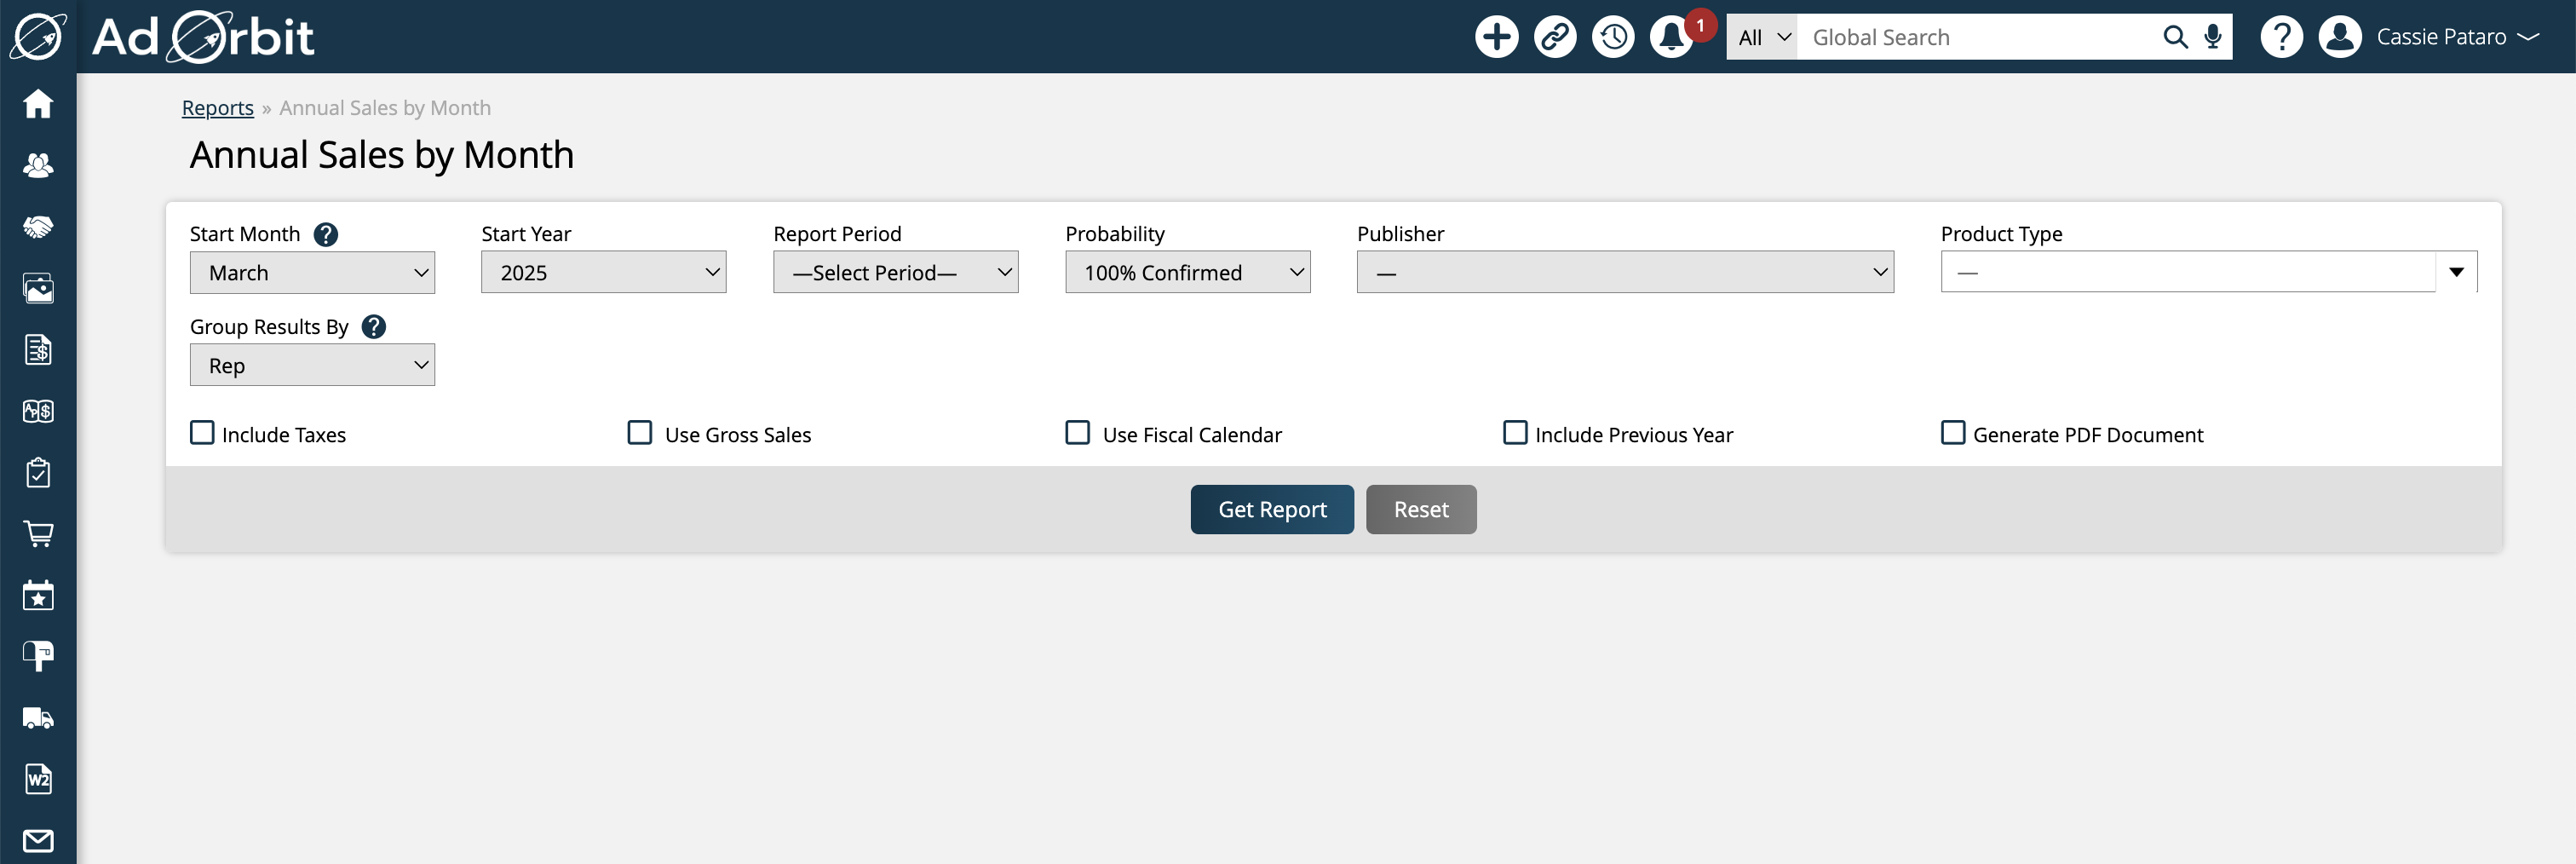
Group Results By: Choose to either group the results by Rep or by Product using this search filter.
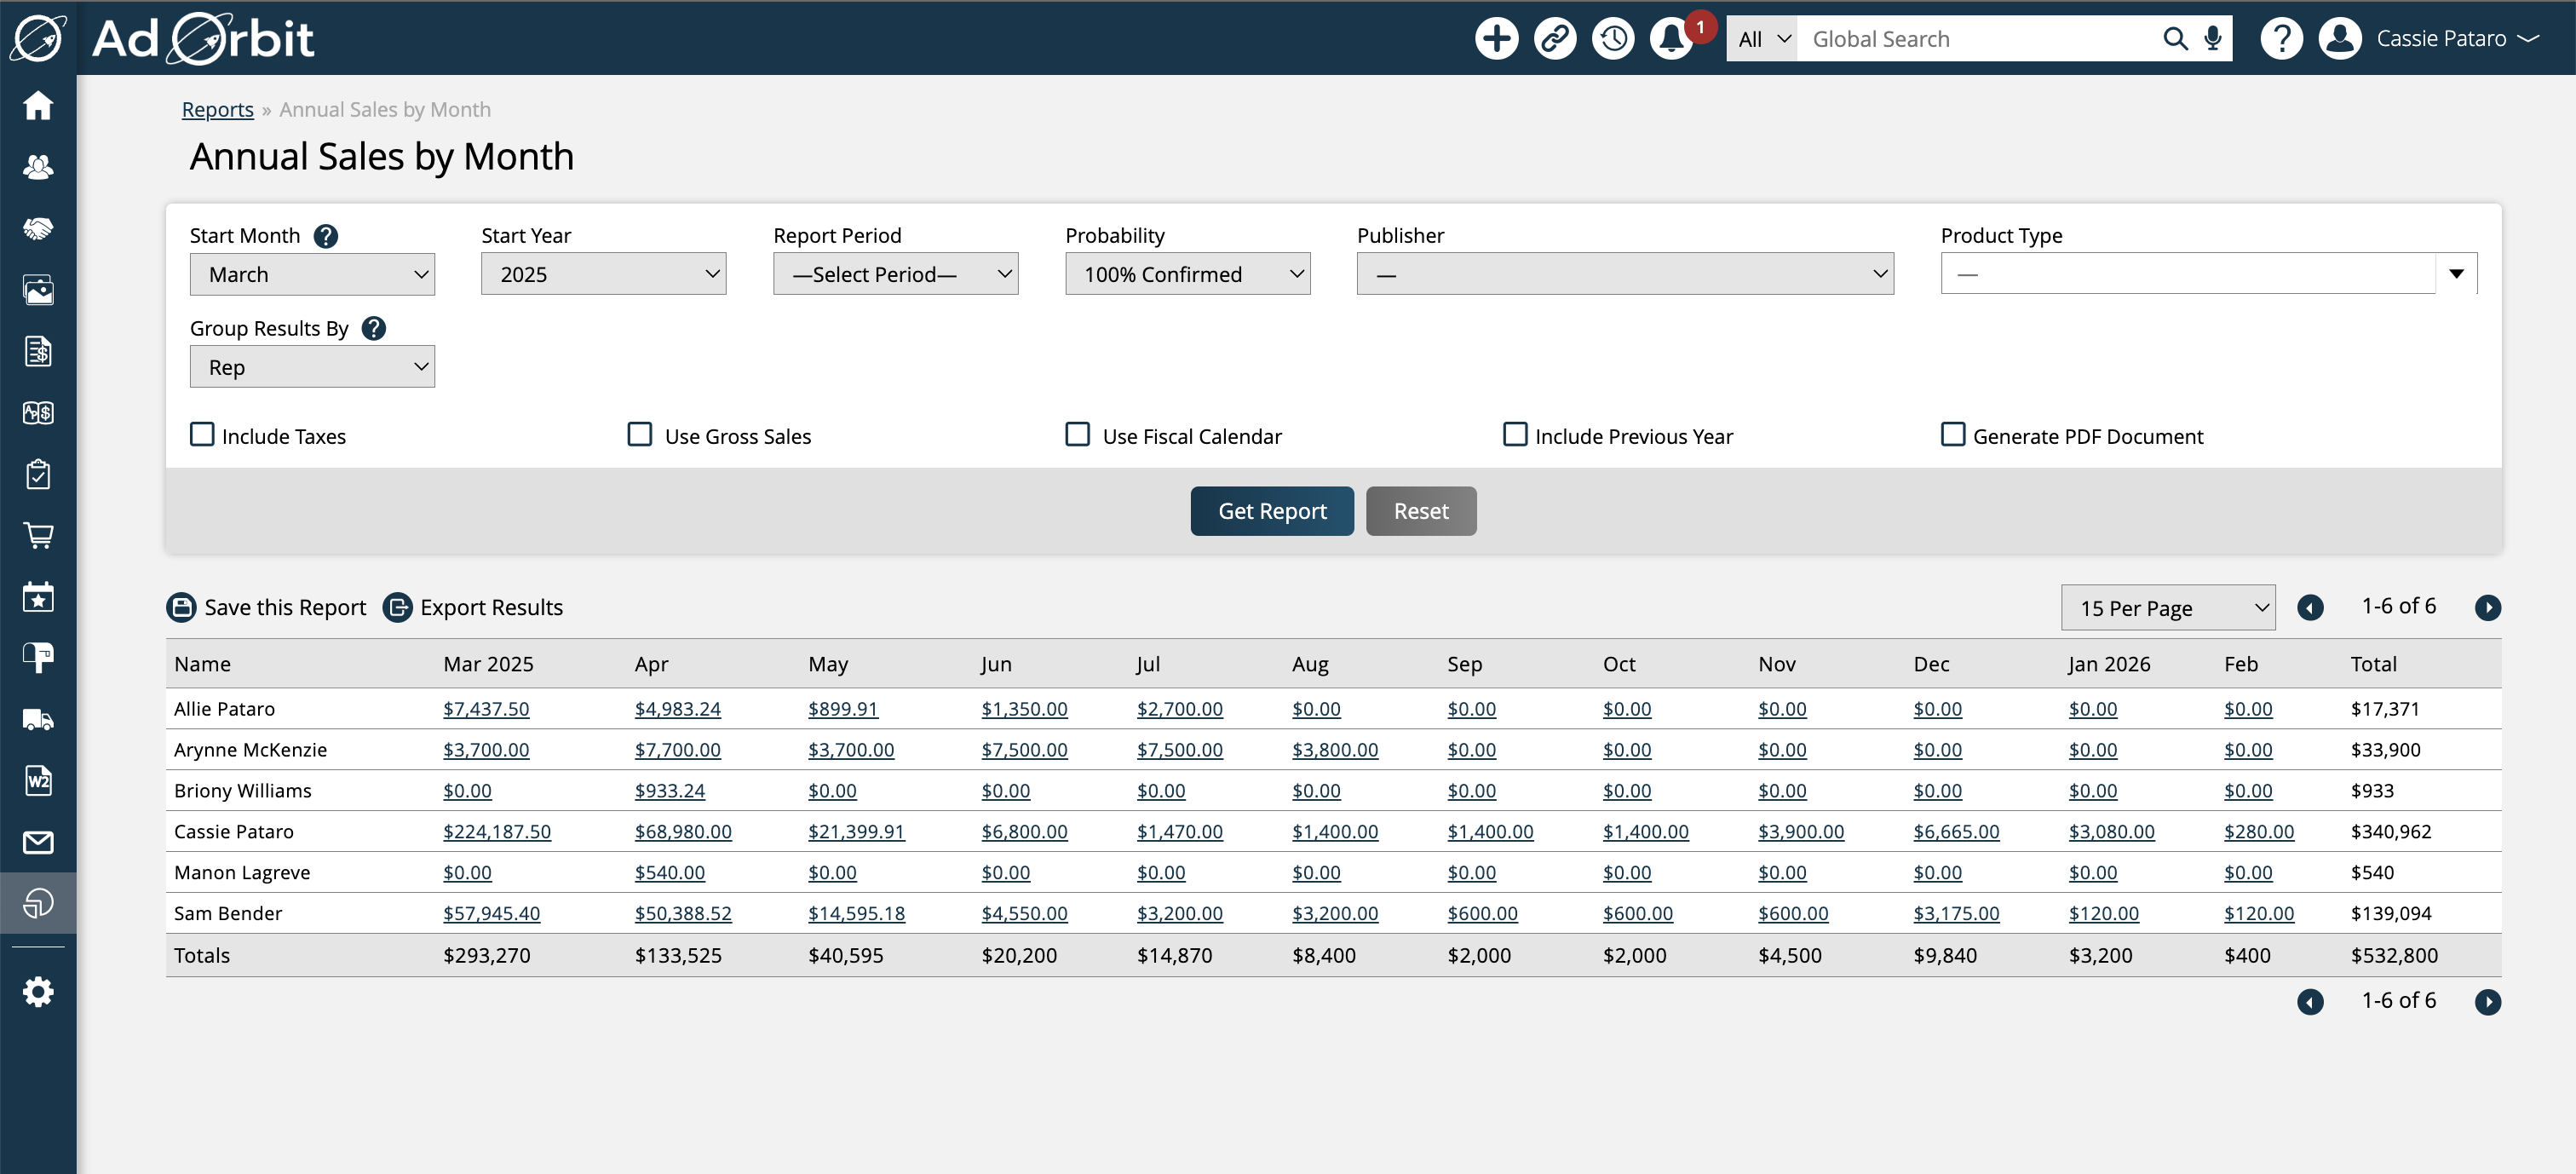
When grouping the report by Rep, there will be a row for each rep that has sales within the date range. Each column will display the sales made within that month for that rep.
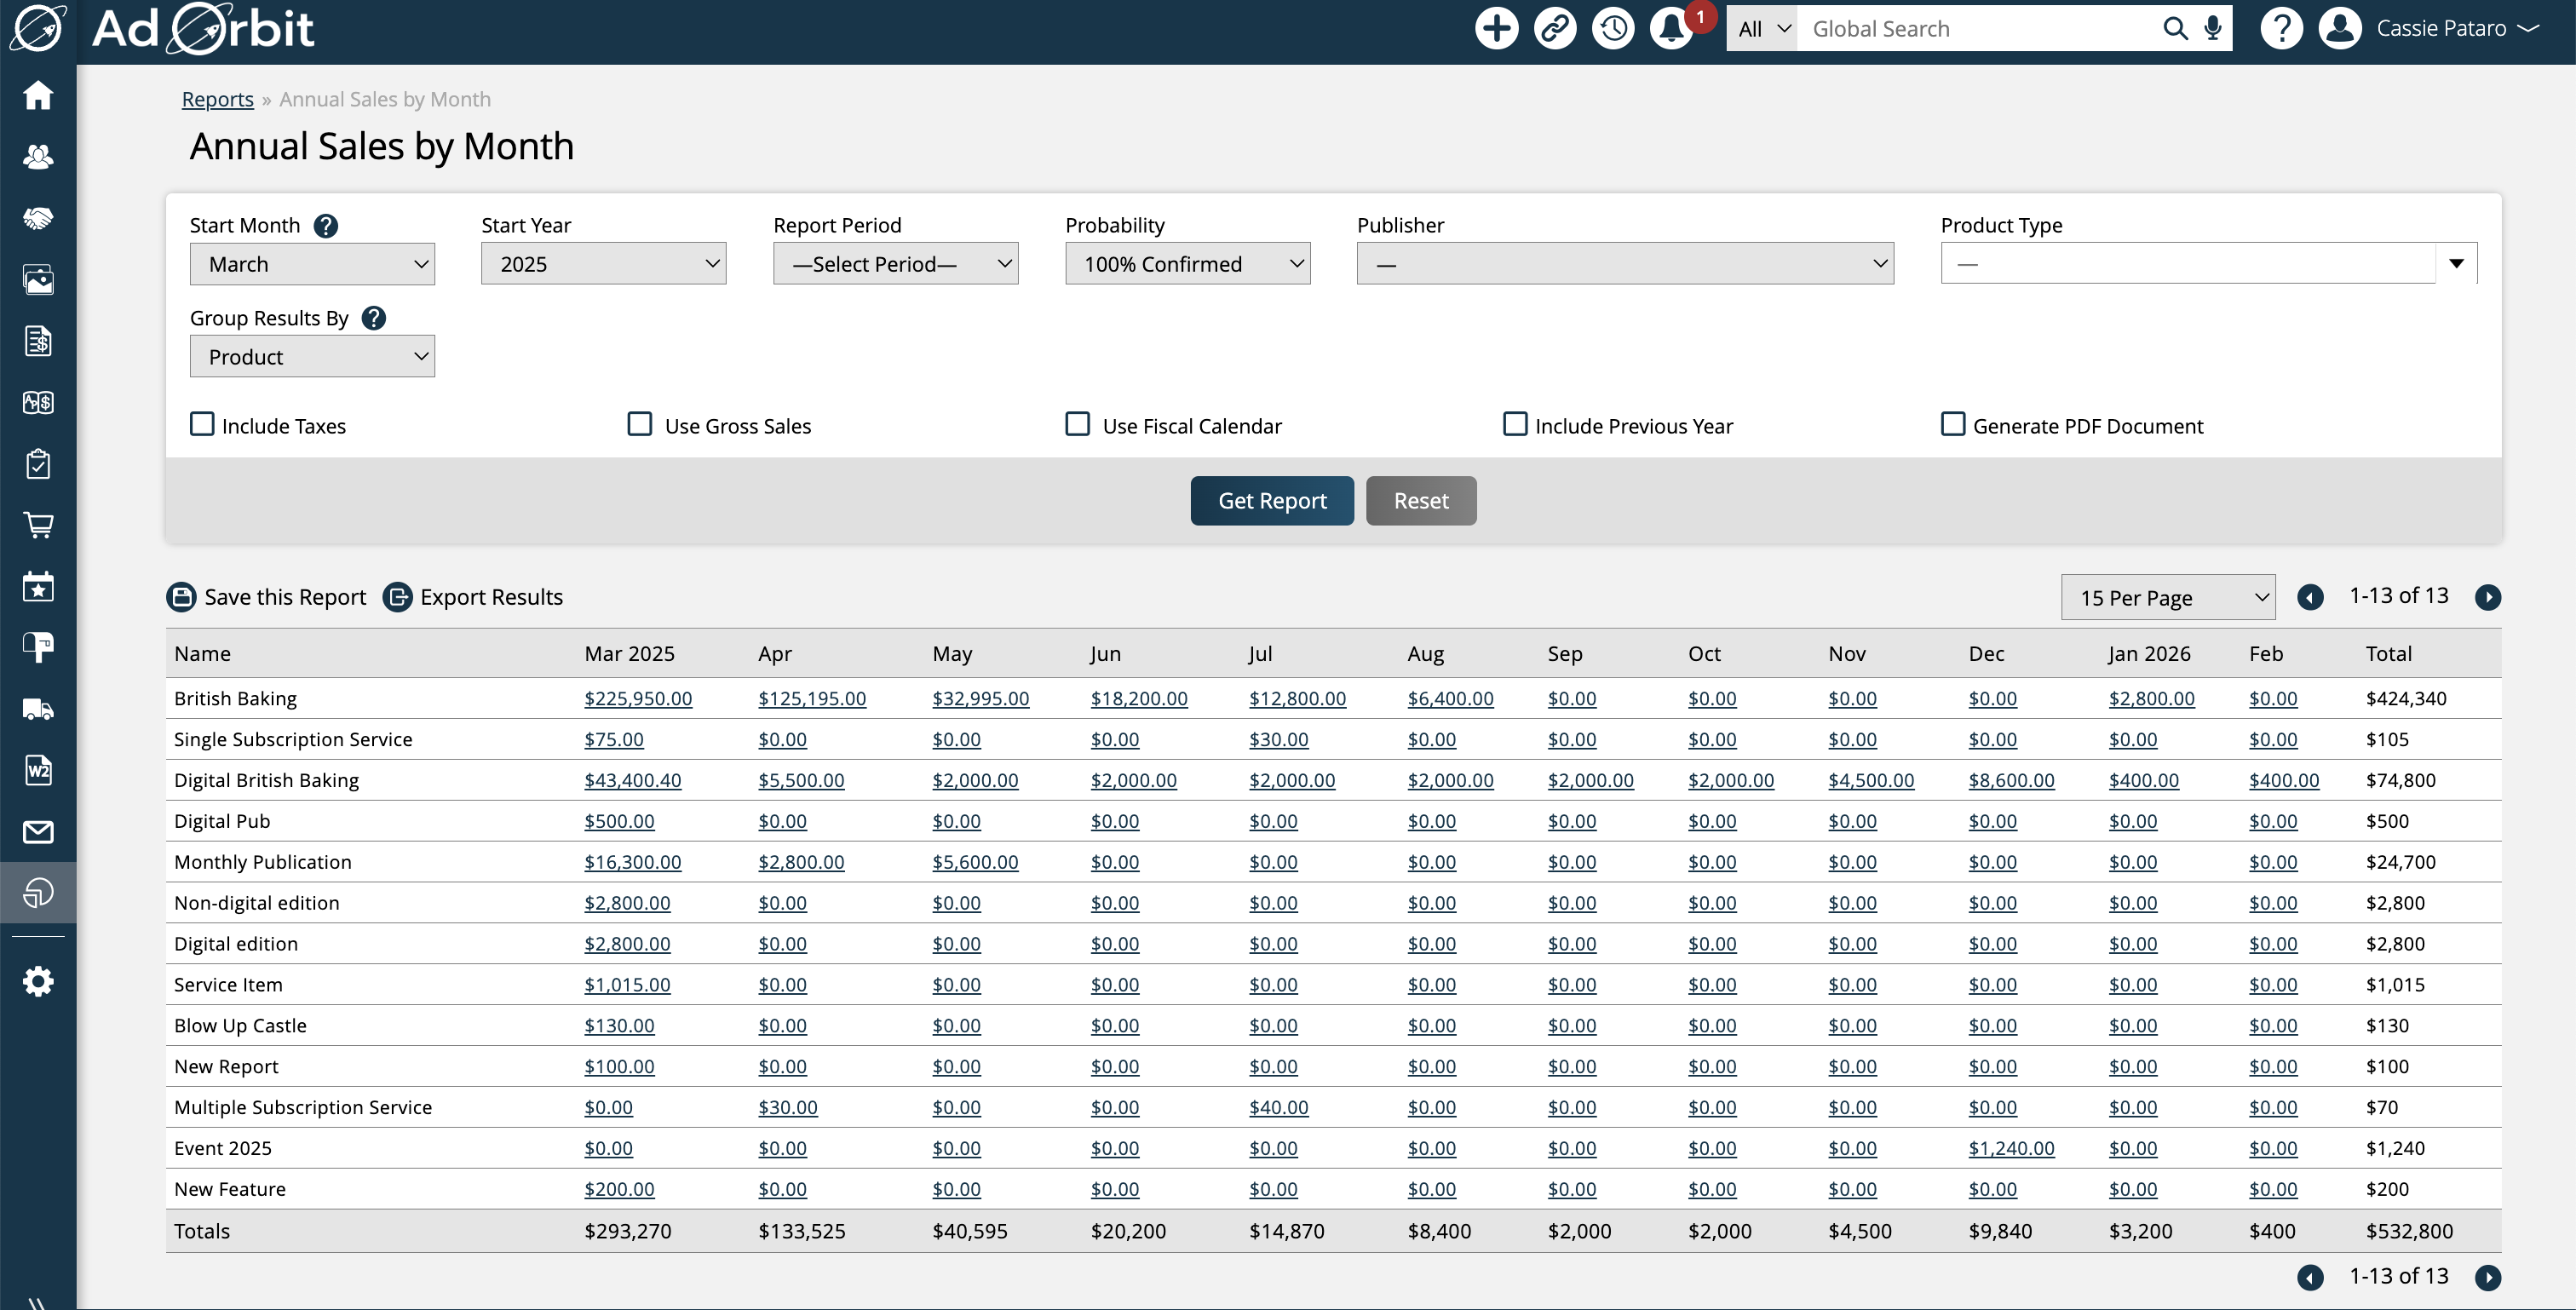
When grouping by Product, there will be a row for each publication and service or event product that has sales within the date range. Each column will display the sales made within that month for that product/publication.
Use fiscal calendar: If your fiscal year is not that same as the calendar year, when this option is checked, the report will group your sales and goals number based on your fiscal periods. For example, if your first fiscal period is from 11/01 - 1/31, the fiscal quarter will include all issues with reporting dates between 11/01 - 1/31 and not from 1/01 - 3/31.
Include Previous Year: When this option is used, the report will display data about the corresponding month from the previous year; i.e. October 2020 will be compared to October 2019.
The results will display in a table format, where you can change how many search results display and can sort by any of the table headers.
Note
The information shows up in each month based on the Material Due Dates of the items, not the Sold Date of the order. For print and digital ads, this is typically the Reporting Date of the issue, and for items like digital media it is the line item’s run dates. For example, if a sale is made in June for a July issue, the numbers will show up under the month of July.
When grouping the report by Rep, there will be a row for each rep that has sales within the date range. Each column will display the sales made within that month for that rep.
When grouping by Product, there will be a row for each publication and service or event product that has sales within the date range. Each column will display the sales made within that month for that product/publication.
If you have the report’s sub-permission to ‘View All Users’, then you will automatically see results for every rep. If you do not have the permission, you will only see results for your own data or for reps who report to you.
When the report is run, the numbers in the table are quick links, which will bring you to the Consolidated Sales Report, with some of the search criteria automatically filled in.
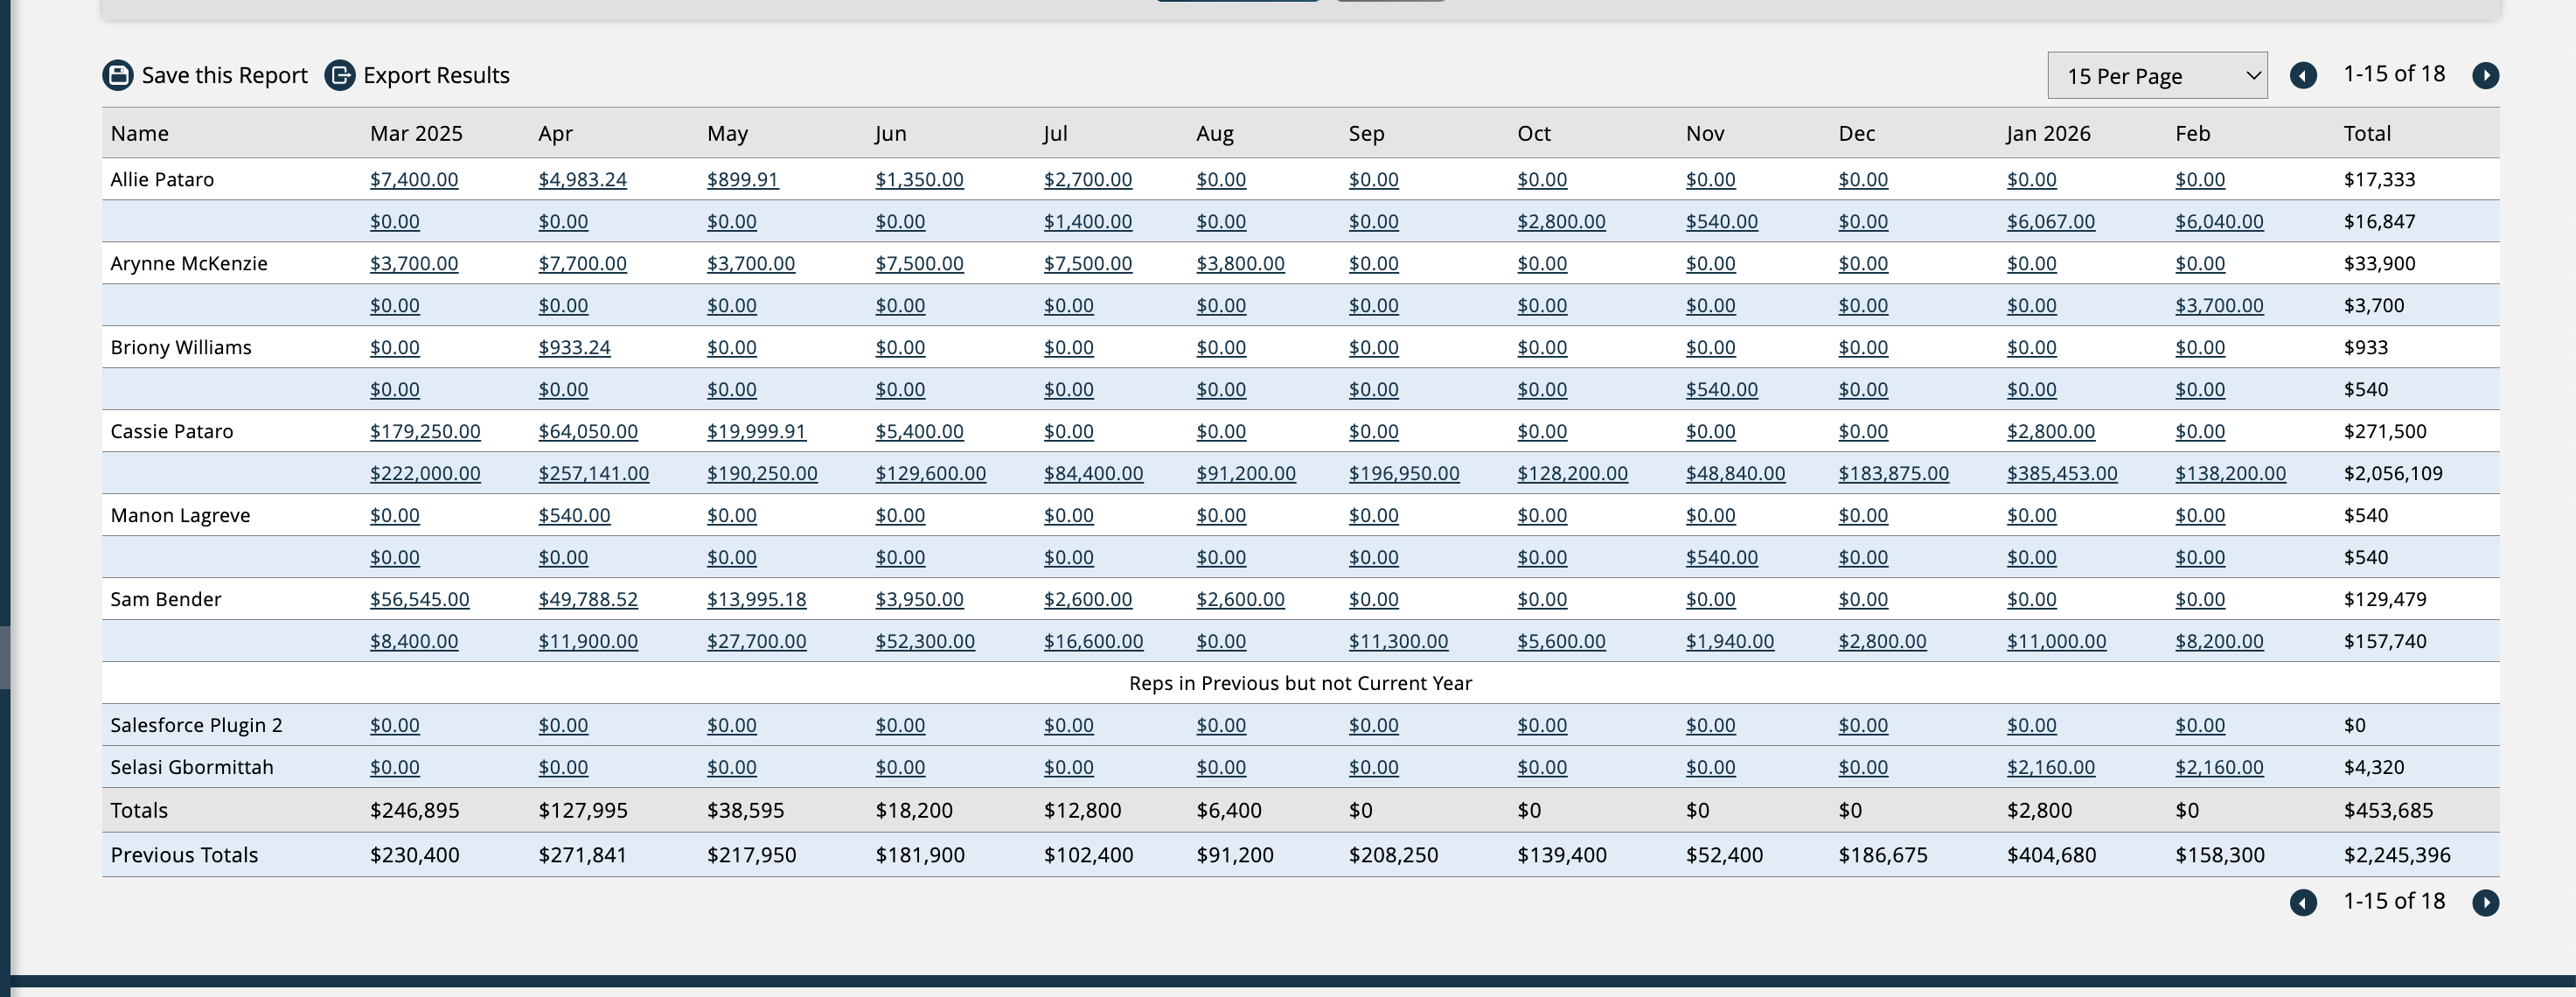
If including the previous year, the previous year's data will be shown underneath each row of data for the current year. If there are reps that had sales in the previous year but not the current year, they'll be shown at the bottom of the report for easy comparison.
Updated 3/20/2025