Delivery Solutions Summary Report
The Delivery Solutions Summary Report is specifically for service products that are set up as Delivery Solutions. The report summarizes data for a given time period for all of the delivery solution items running within that period, broken out by month.
To access the report, you need the User Permission 'Delivery Solutions Summary Report'.
To view data for all users, not just your own and any users who report to you, you also need the 'View All Users' sub-permission.
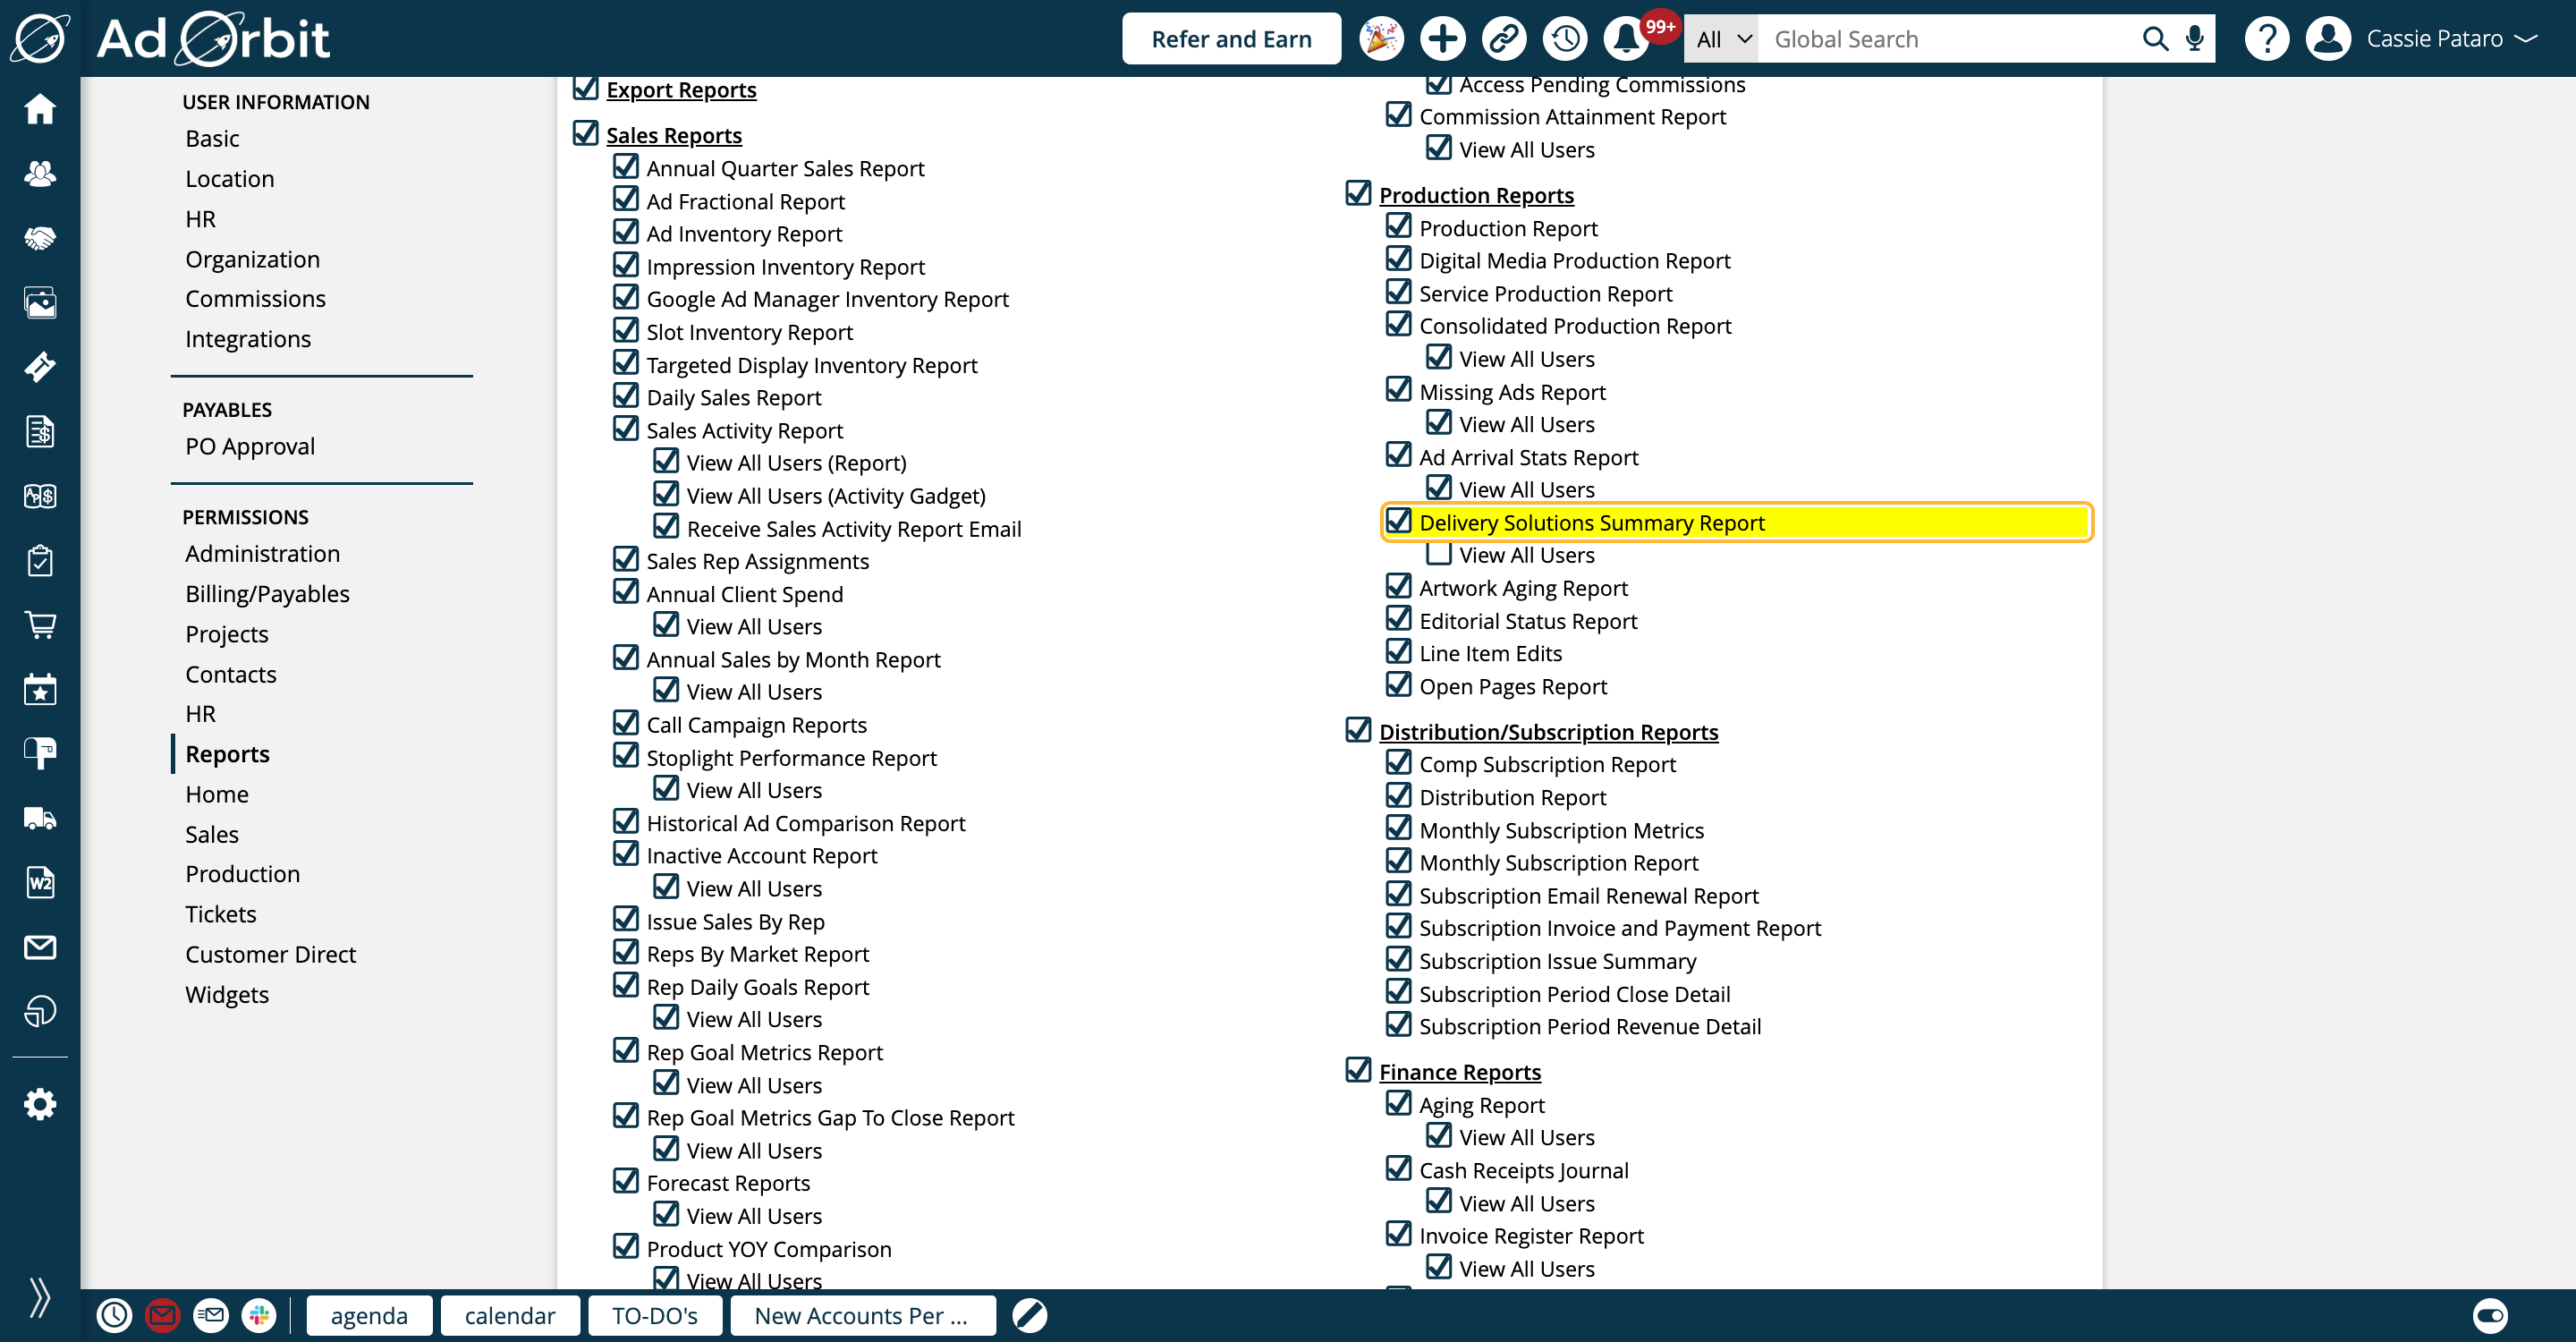
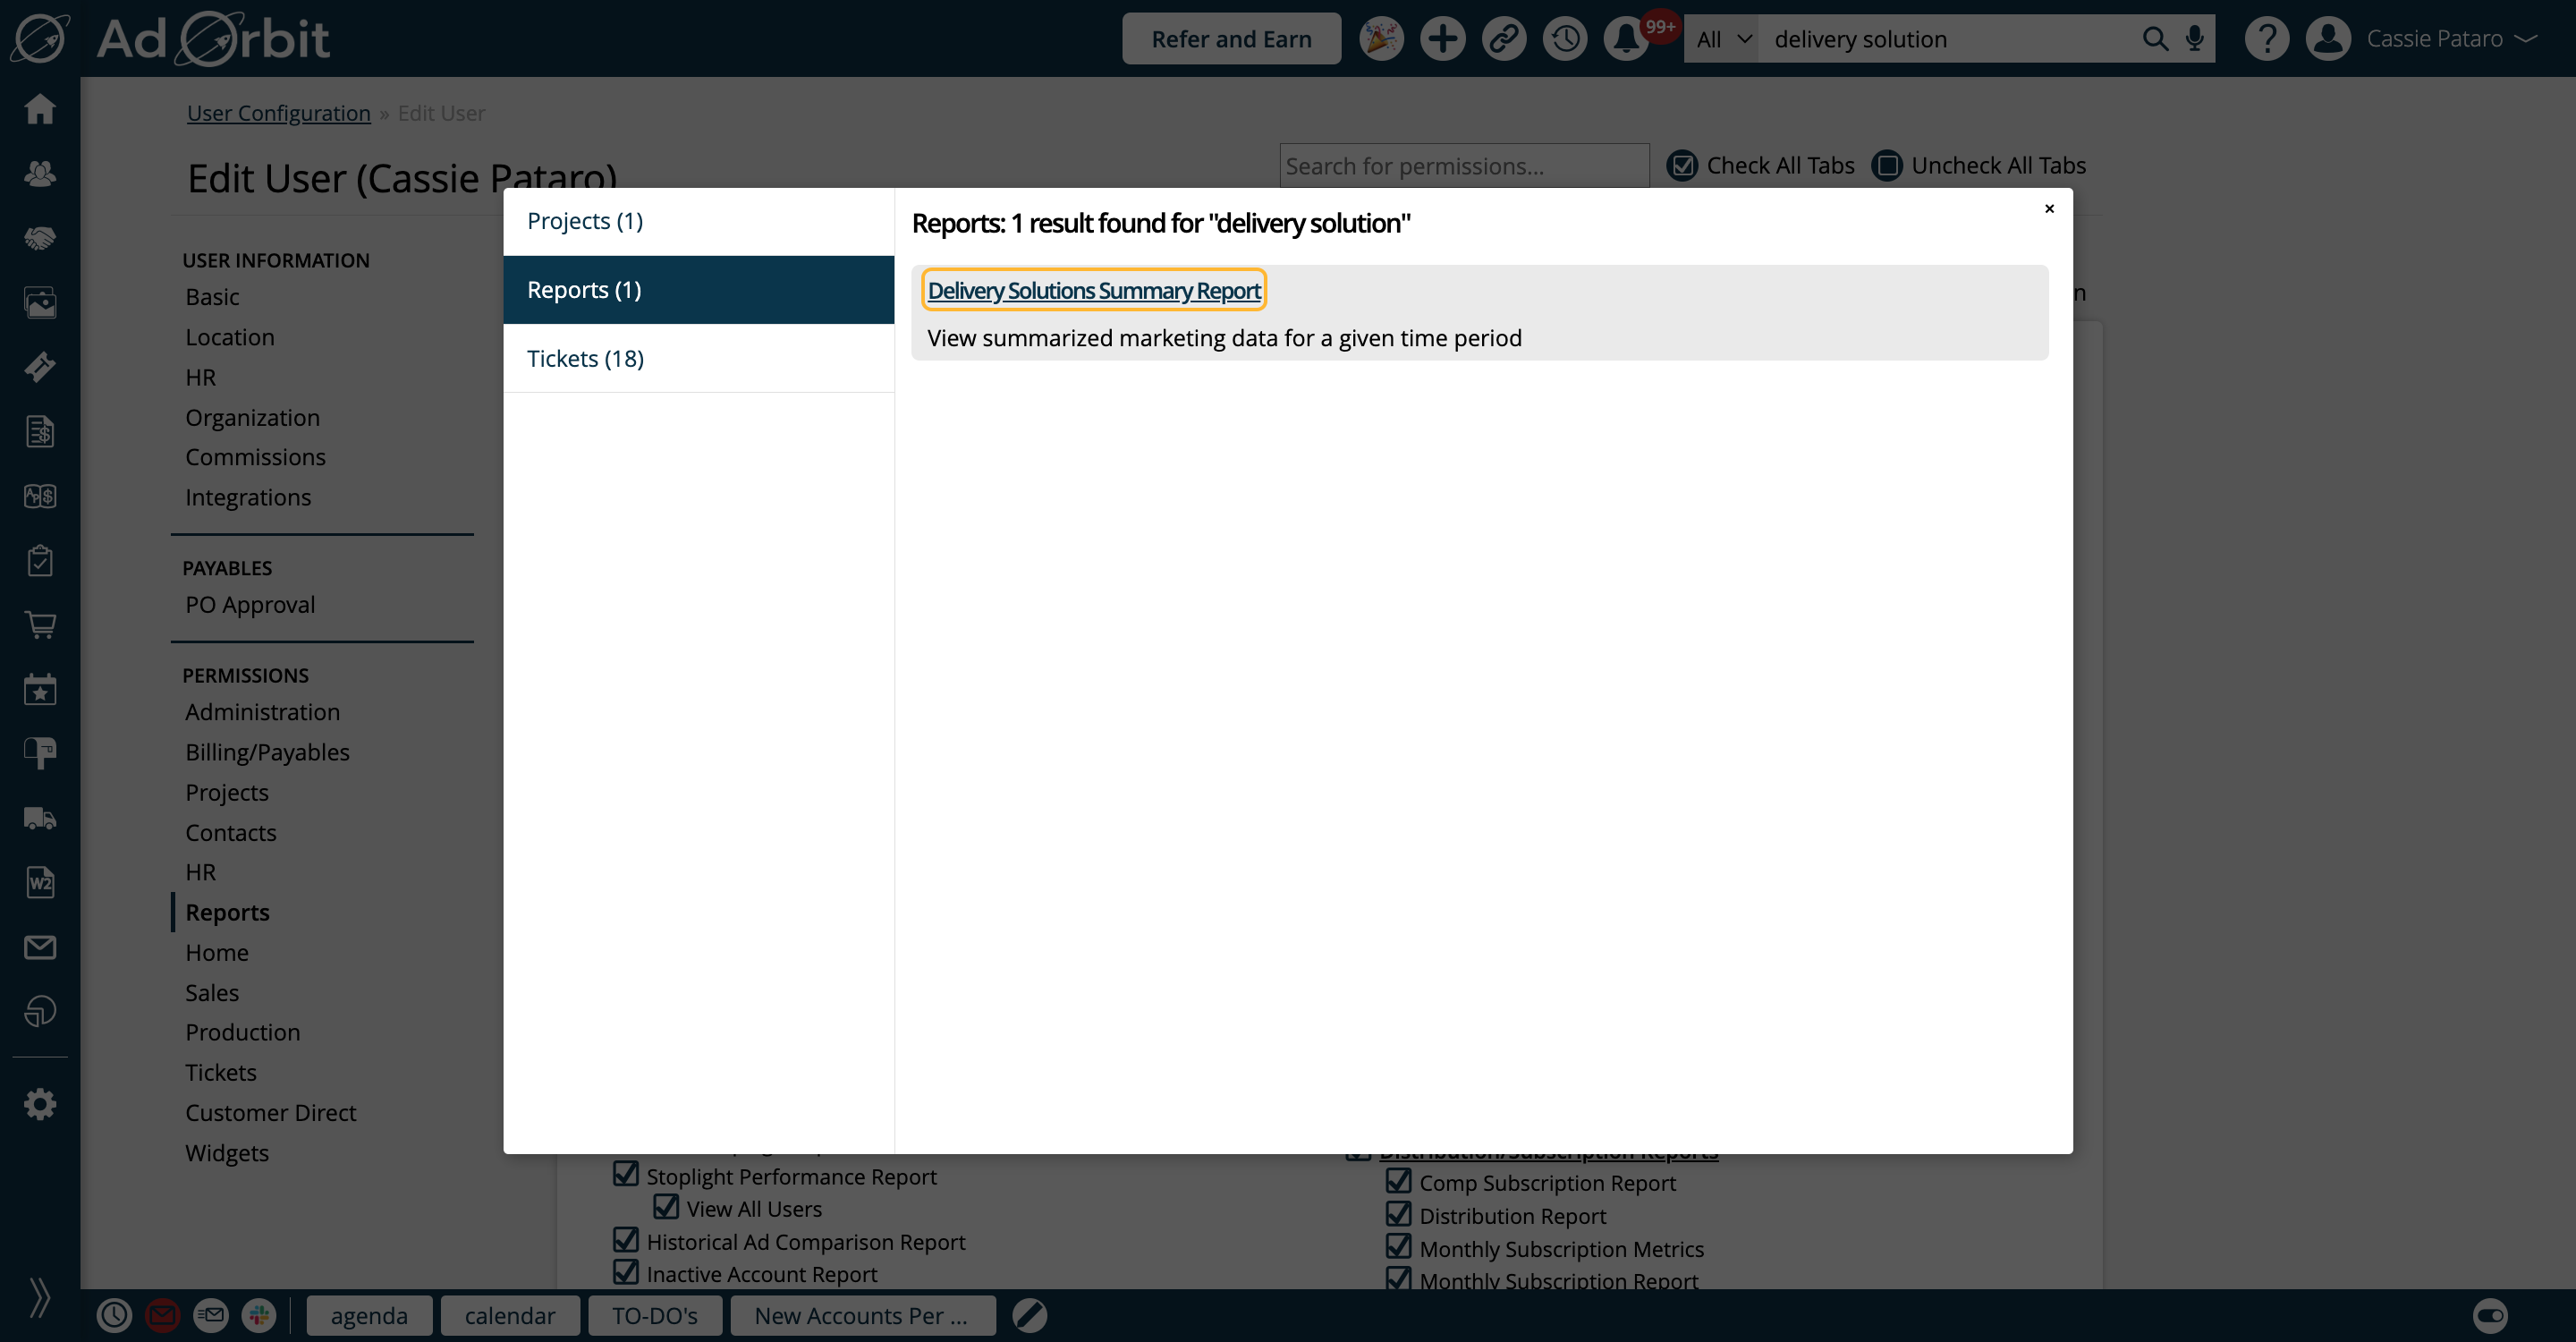
You can find the Delivery Solutions Summary Report by going to Reports > All Reports and clicking on the report name, or by using the global search bar.
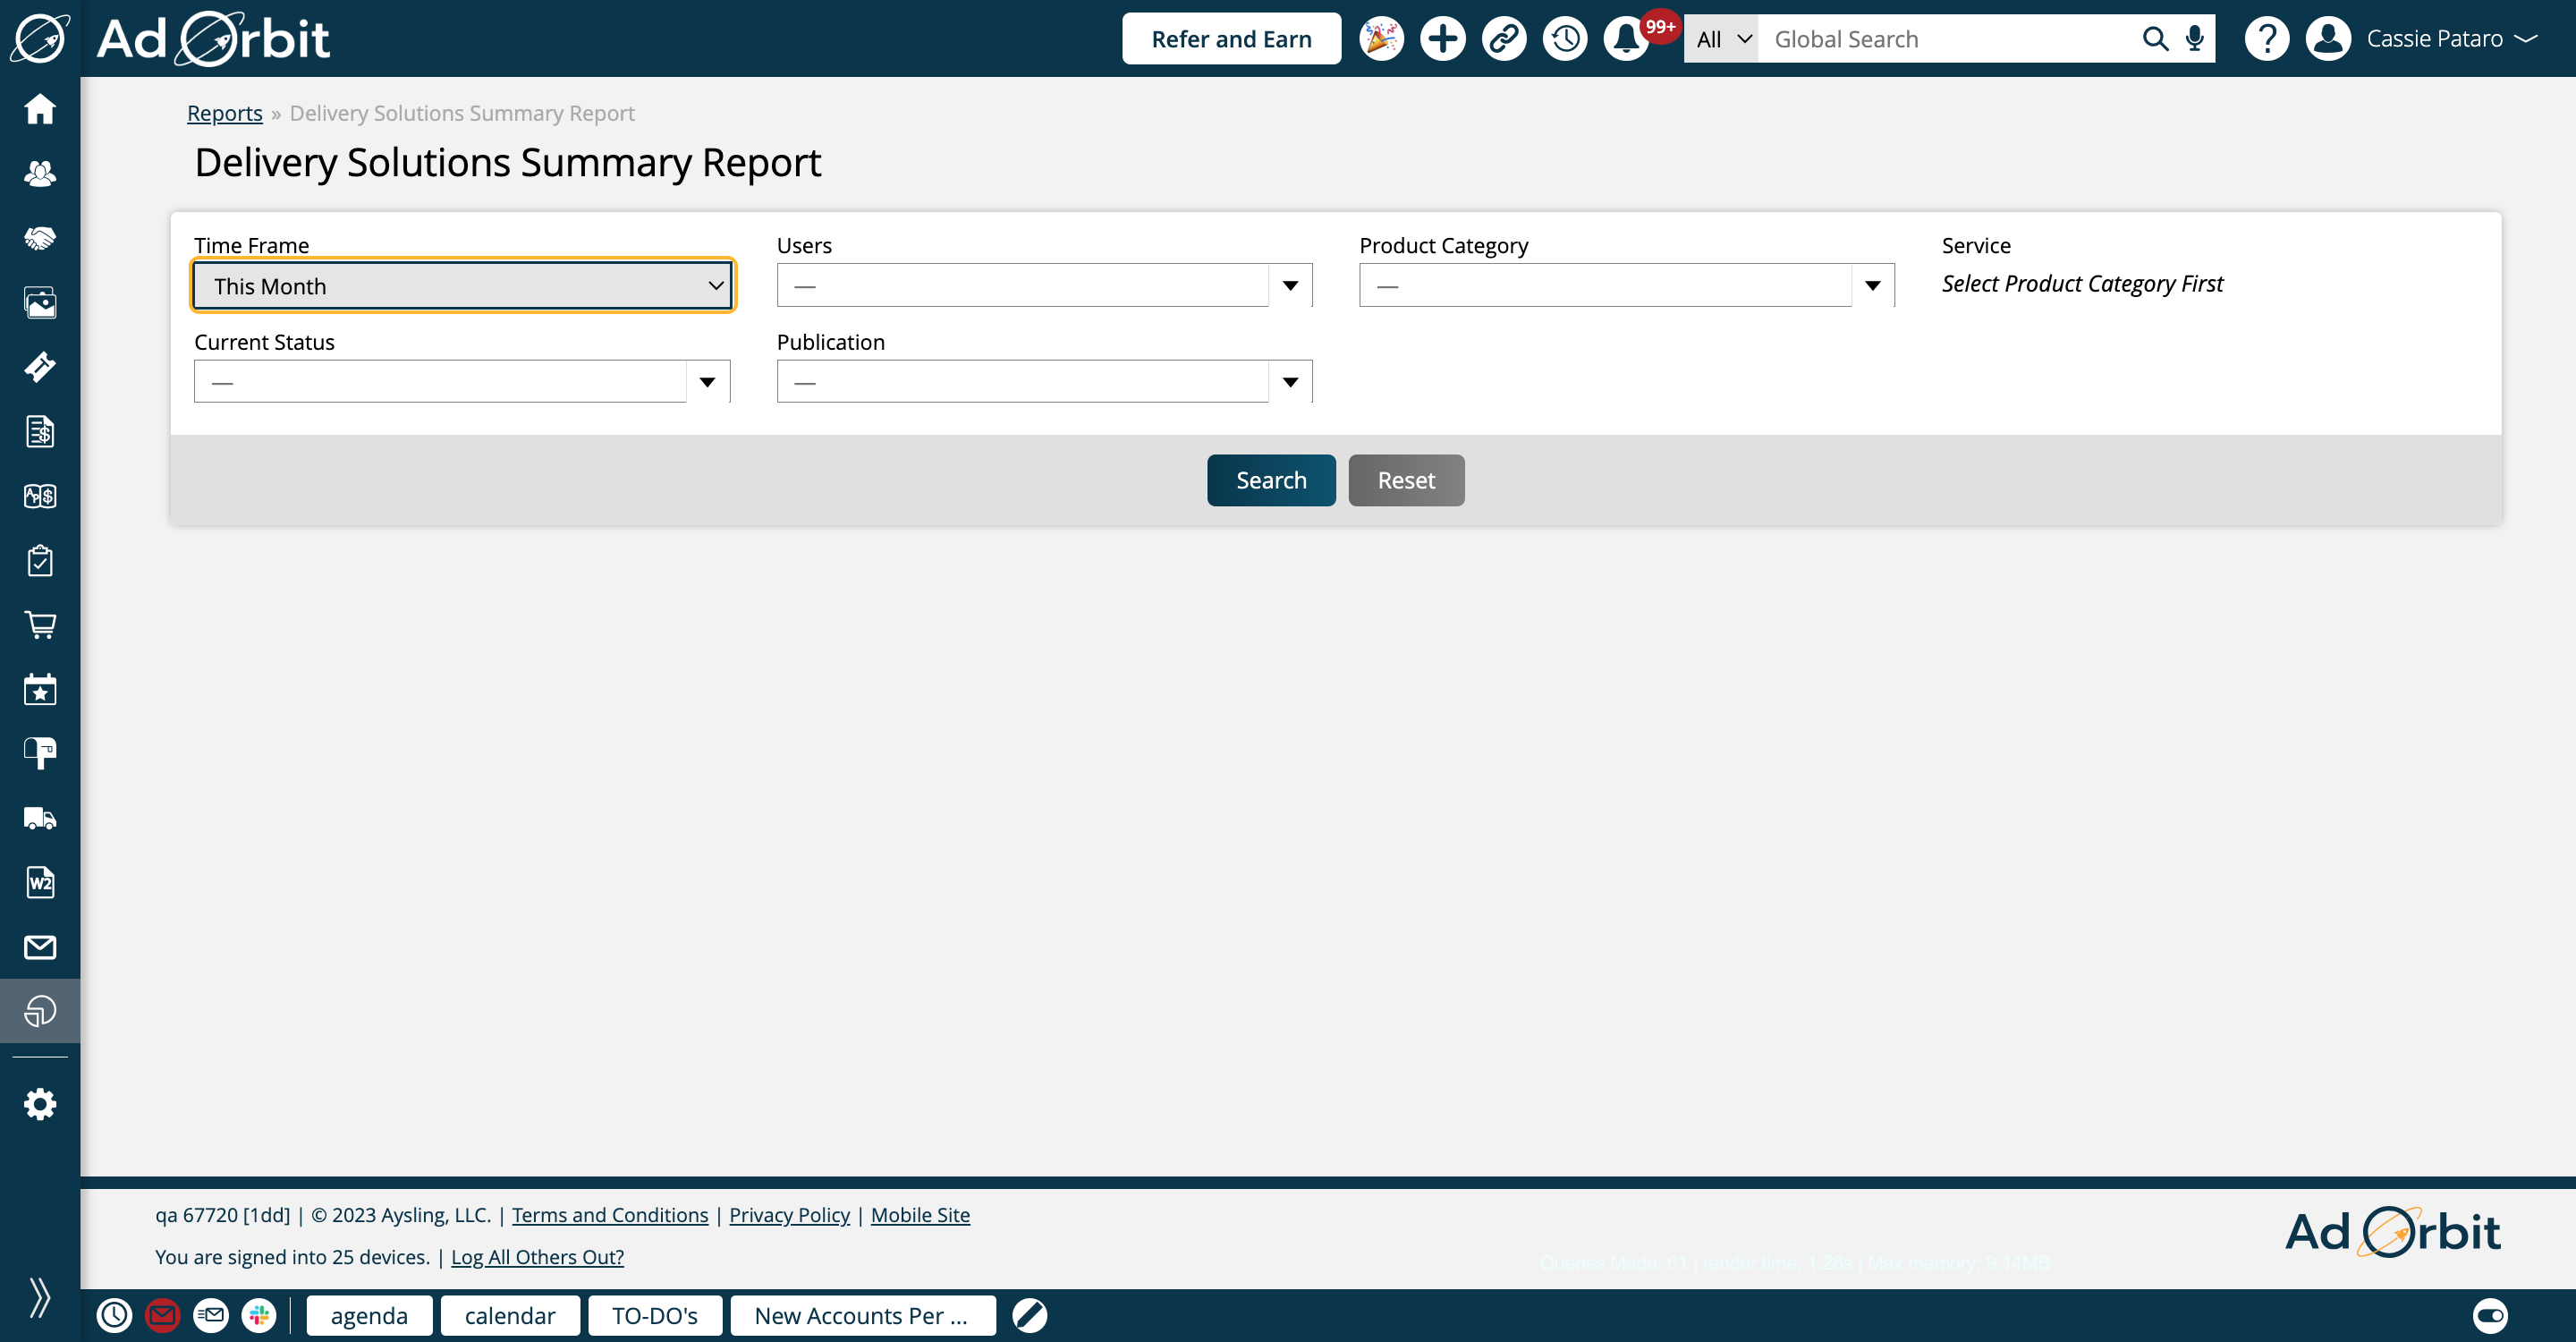
In order to run the report, you must select a Time Frame. You can either choose from our pre-defined time frames, or enter a custom date range.
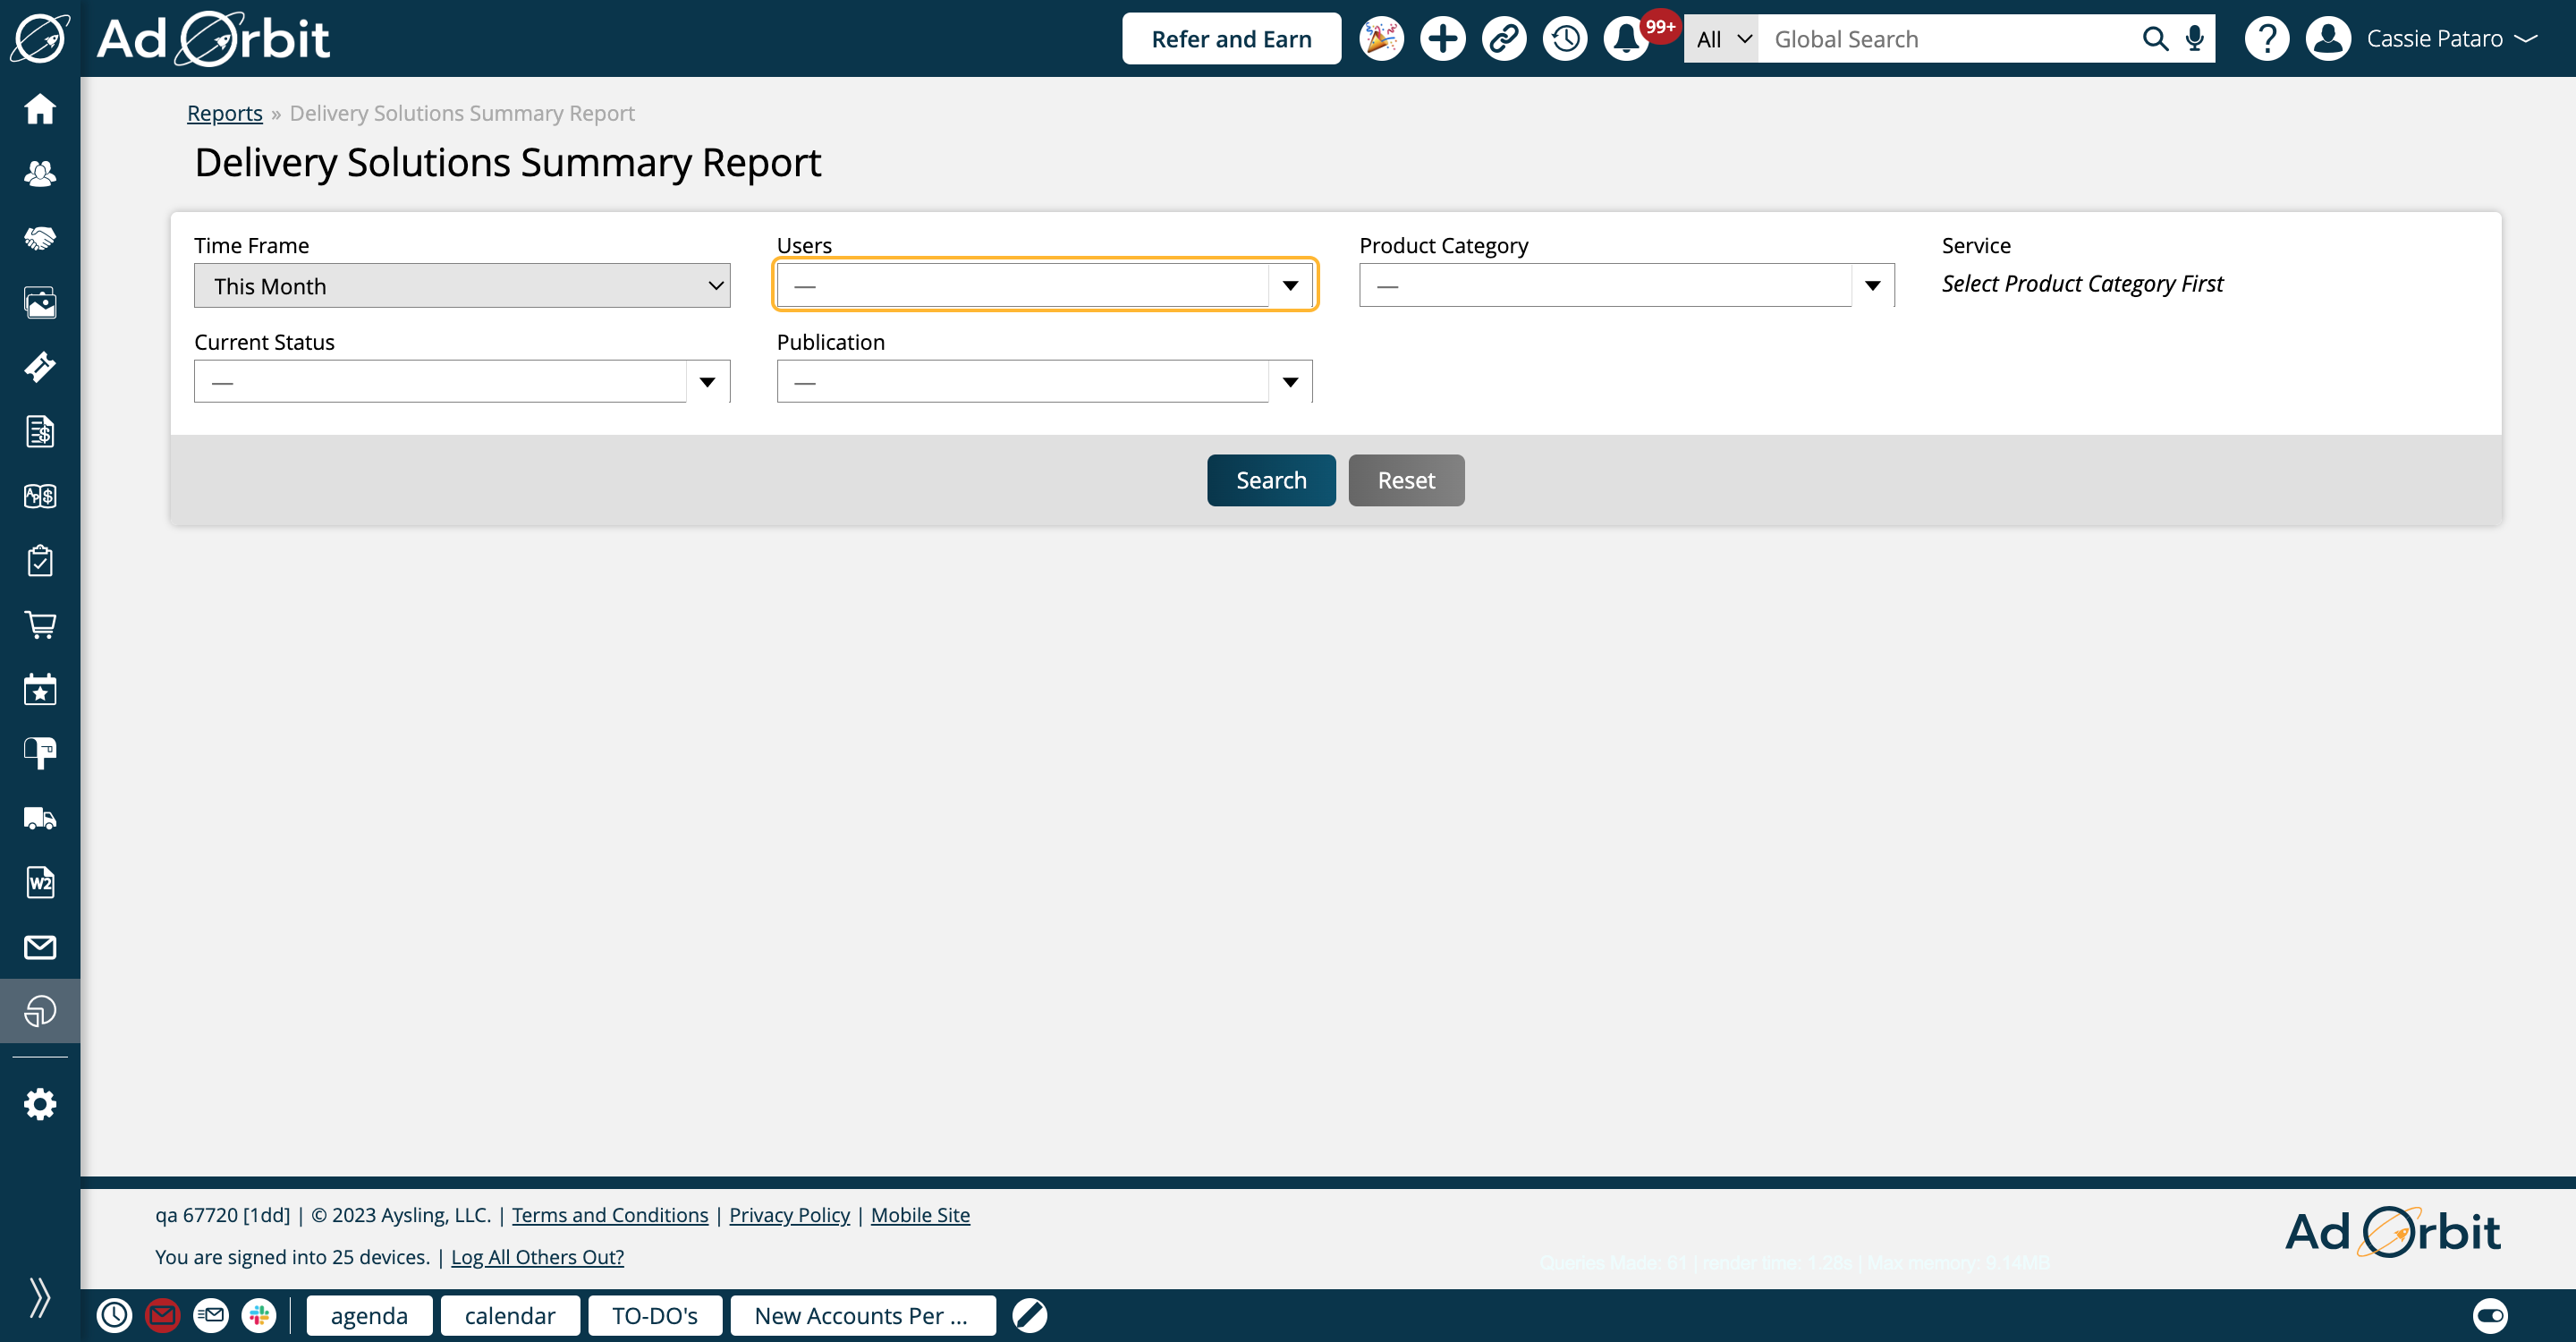
The Users filter allows you to find items based on who the delivery solution ticket is assigned to.
The Product Category dropdown will display any of your Product Categories that are associated with products set up as delivery solutions, and will populate your Service dropdown with all products associated with the chosen categories.
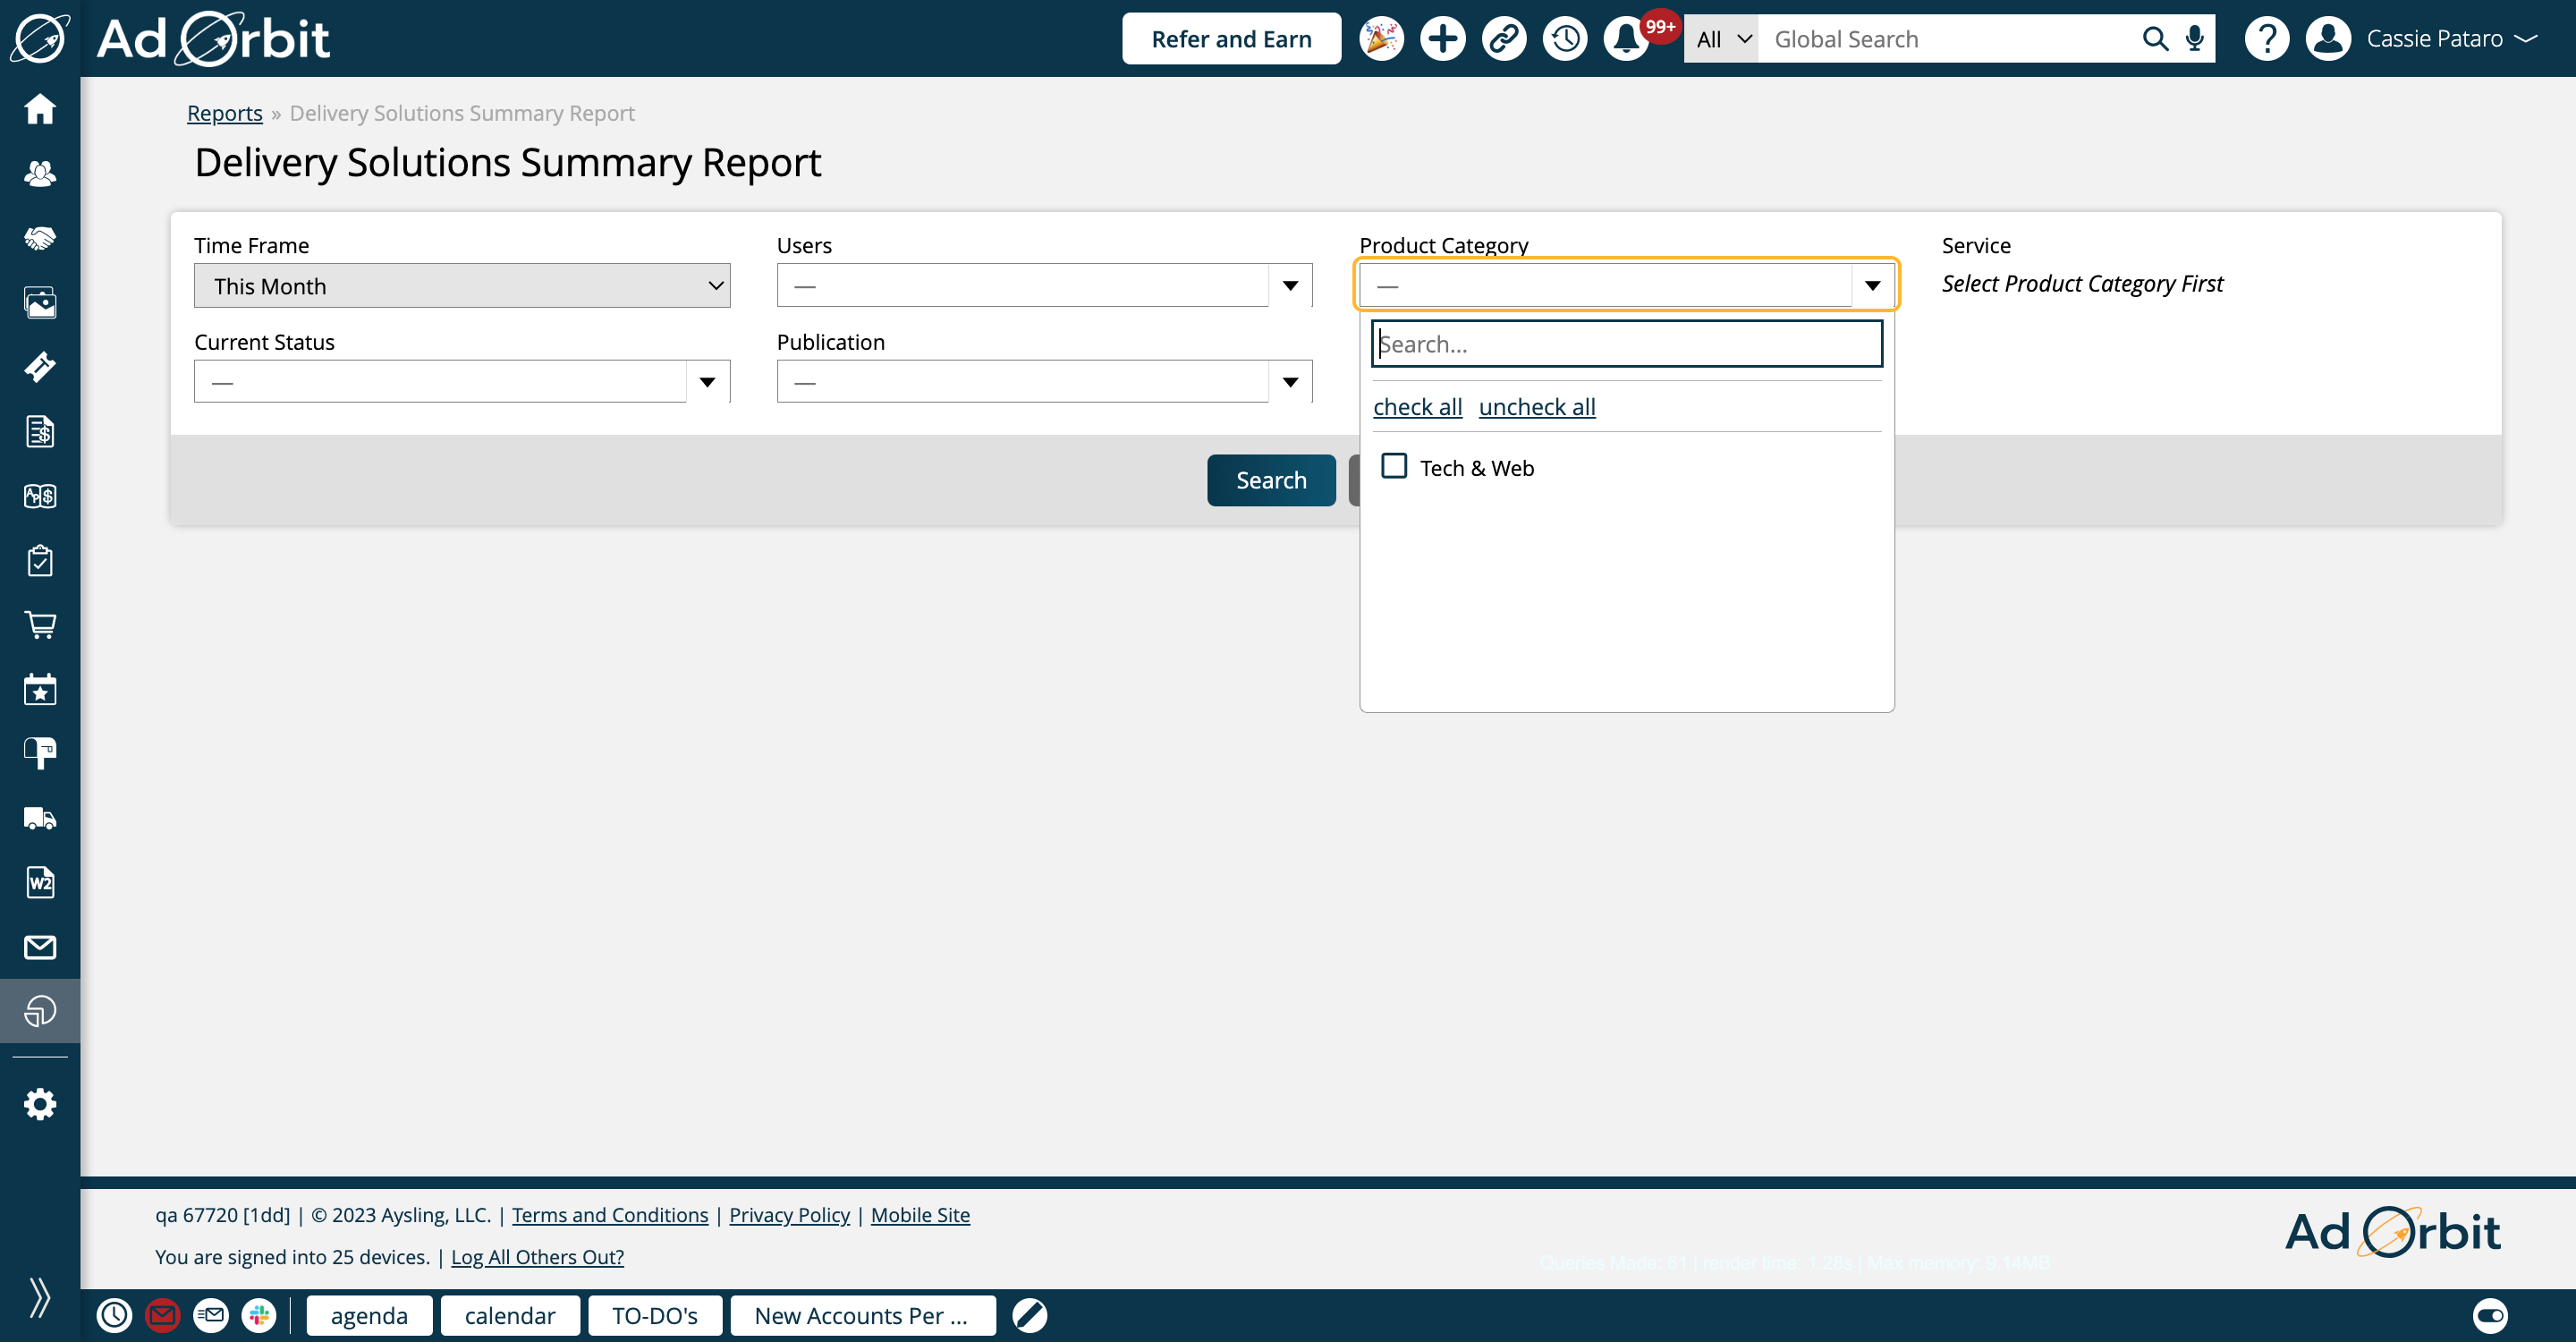
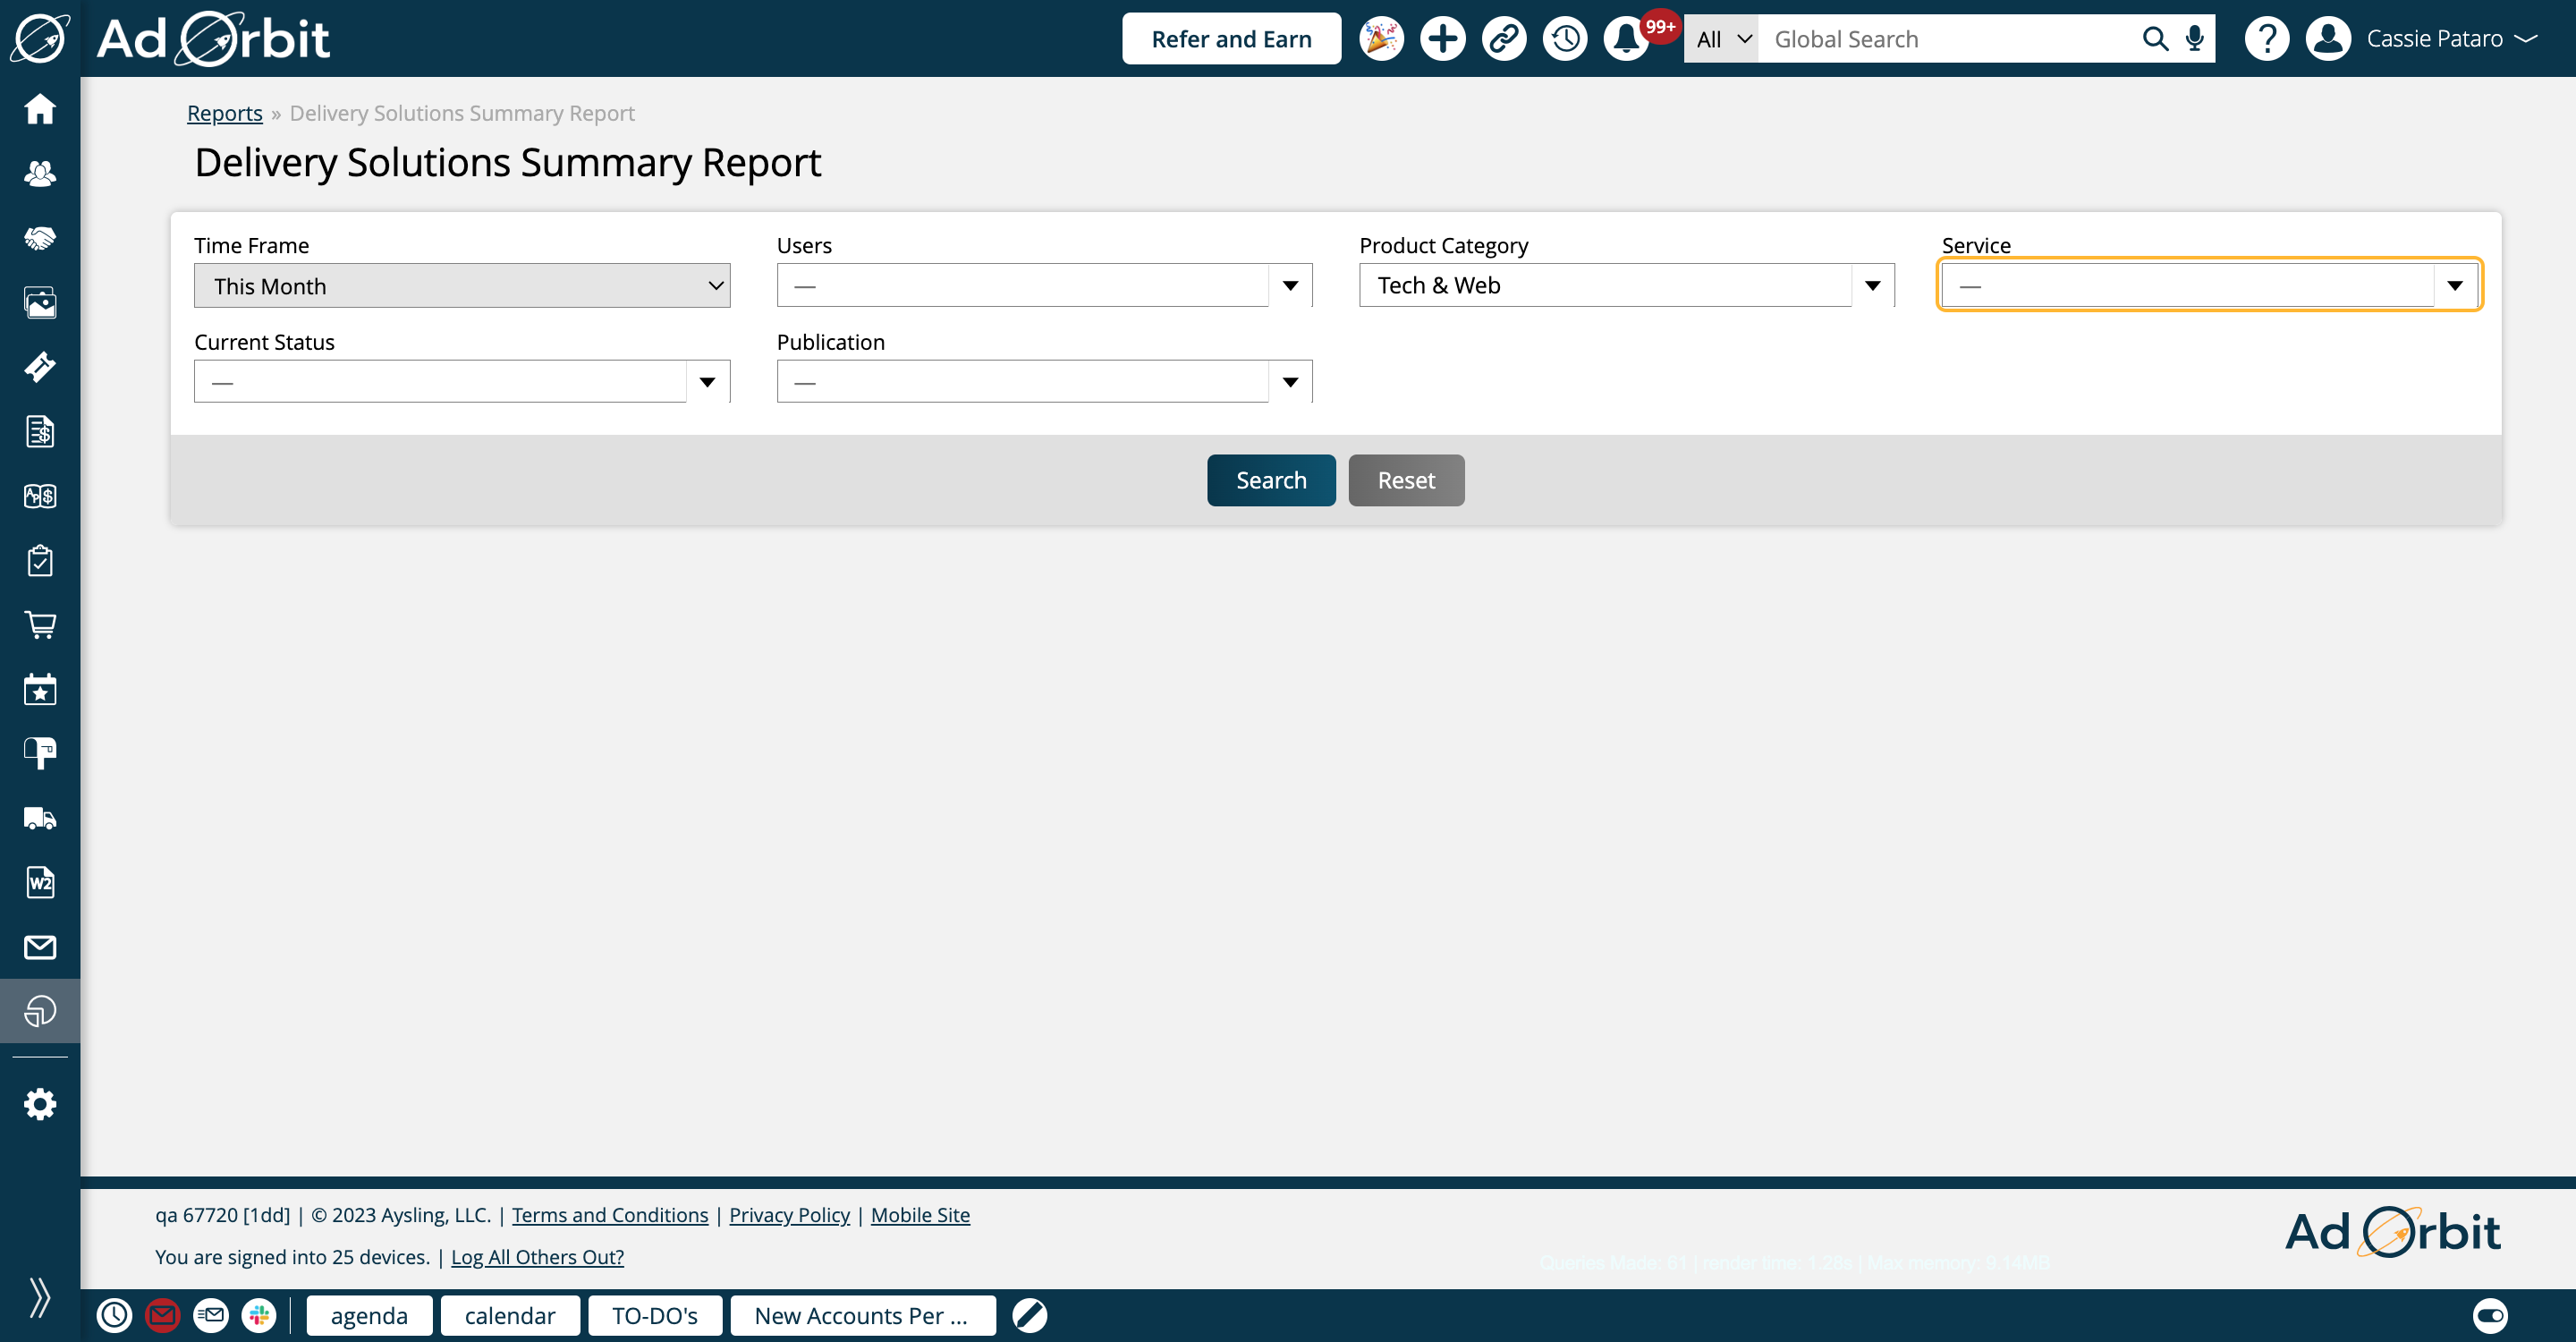
The Service dropdown is only applicable if you chose at least one Product Category. The list will show all service products associated with the selected categories.
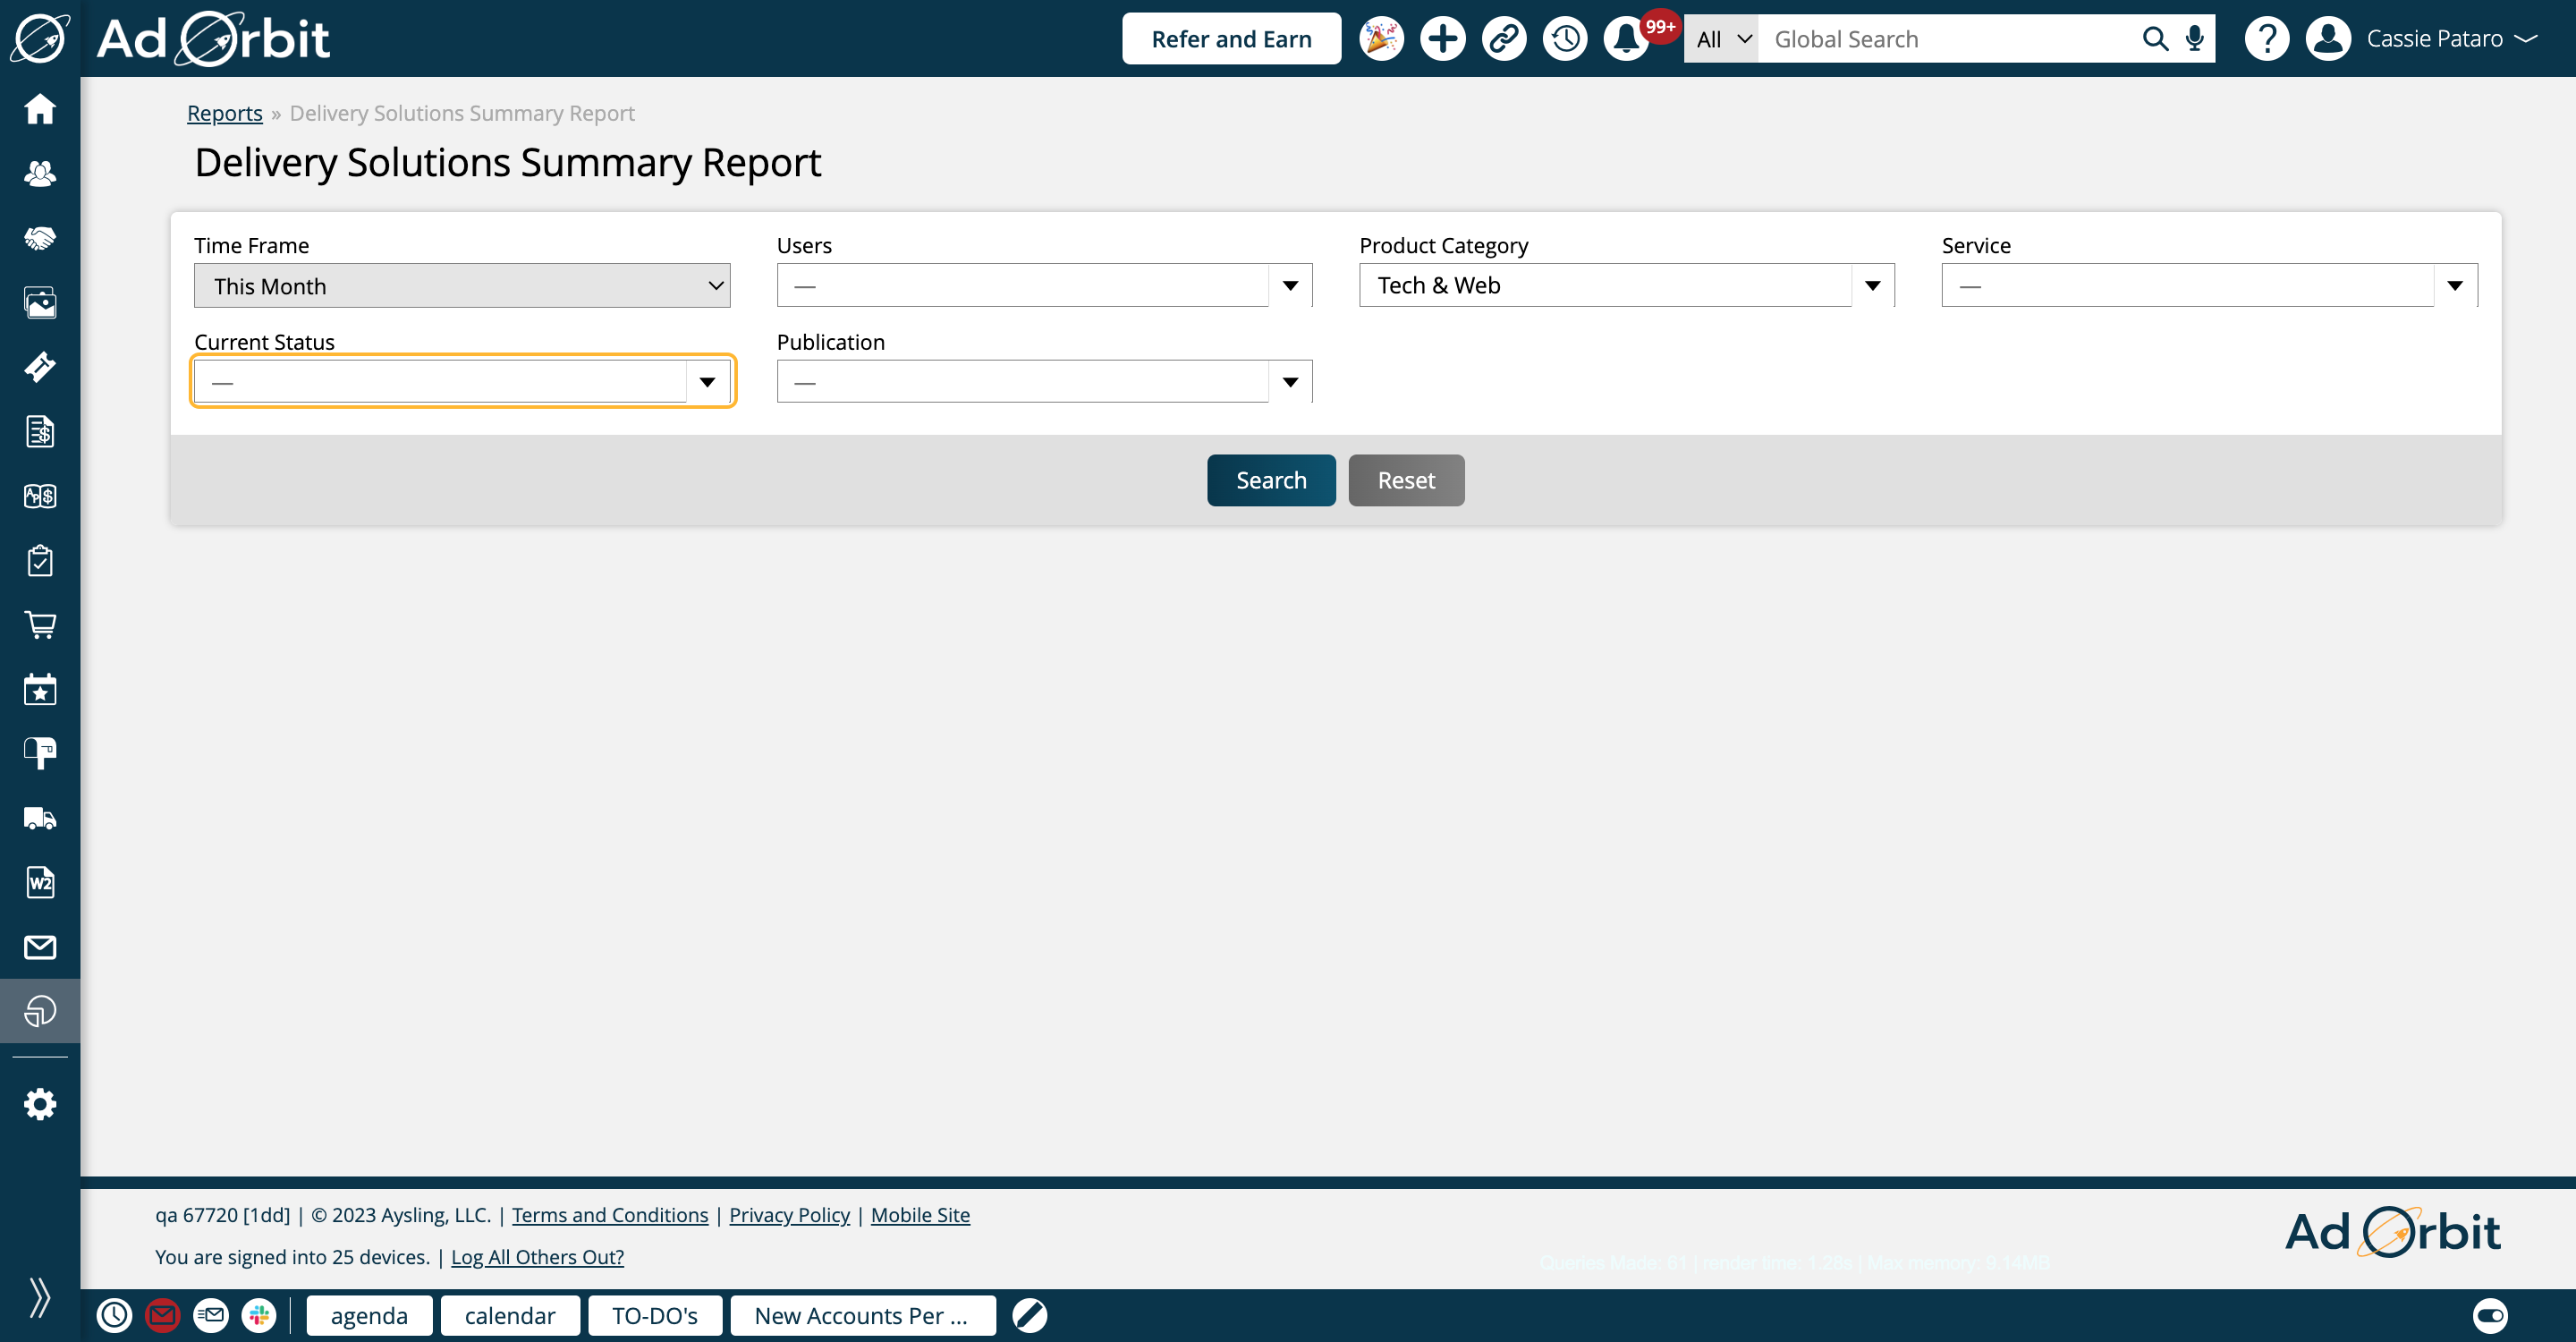
Current Status lets you search based on the current status of the delivery solution tickets. By default, all statuses are included.
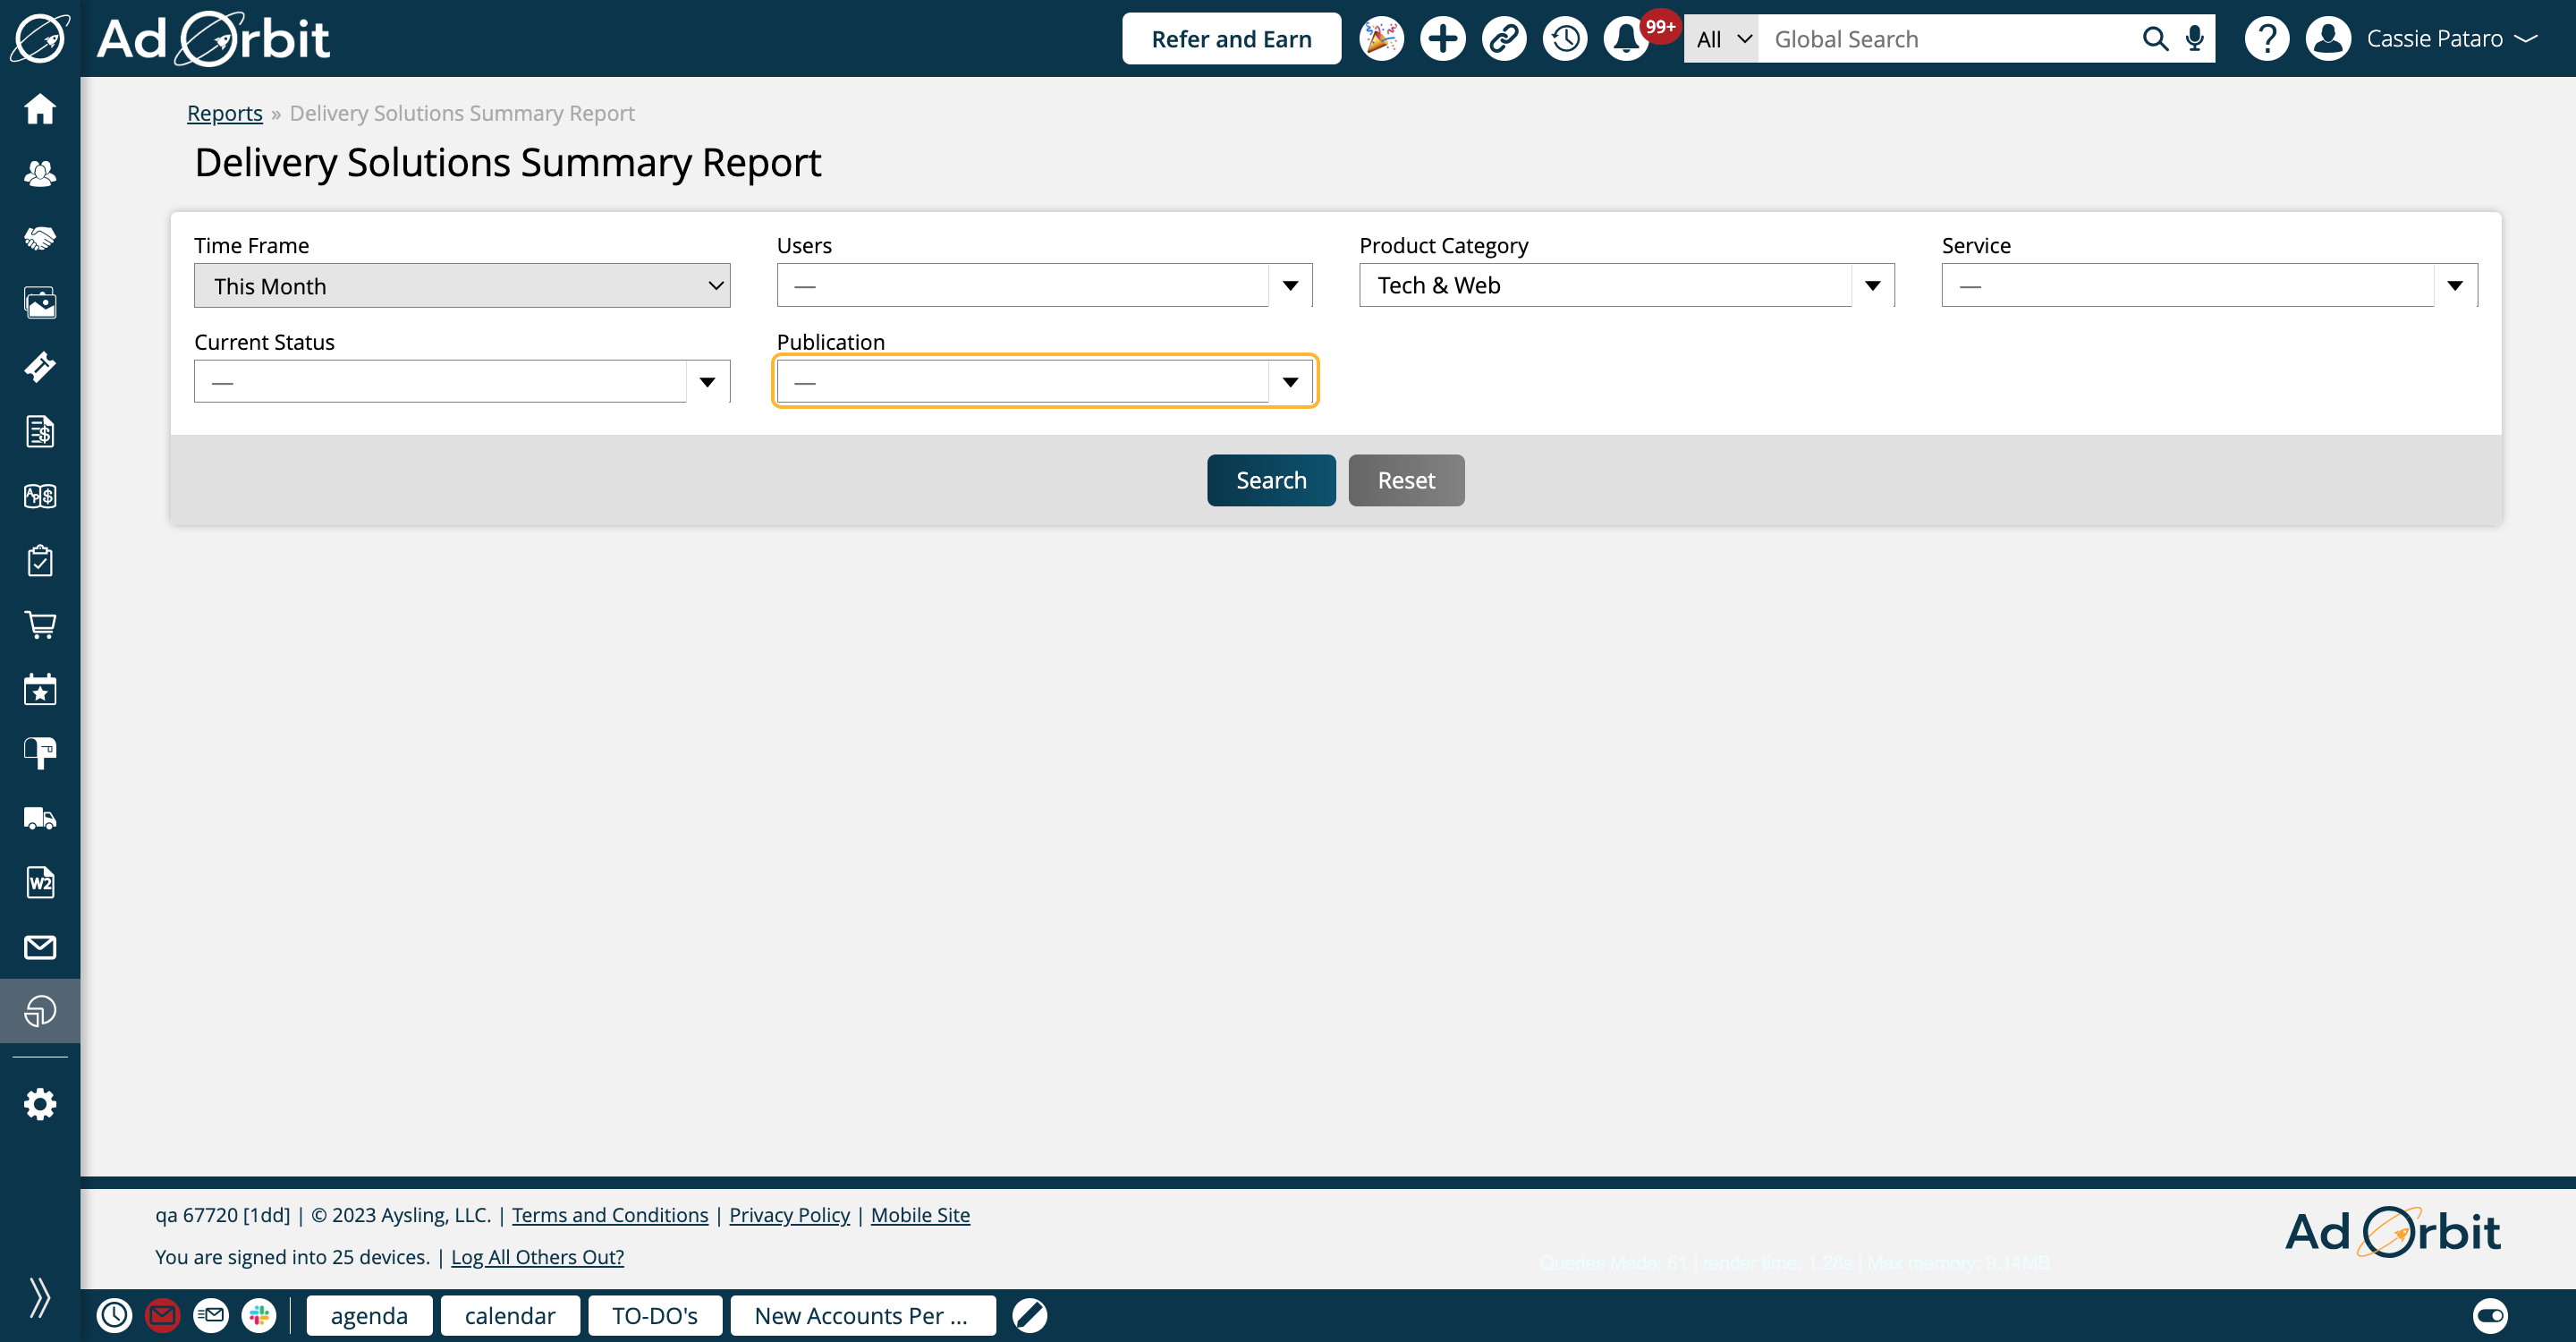
All delivery solution products are required to be tied to a publication. You can use the Publication filter to narrow down the results and only find items associated with particular publications.
Click on Search when you are ready to view your results.

The results will be shown in a table format, broken out by month. The Actual Close column is the month in which the ticket was marked as 'done'.
Any rows where the Actual Close value is blank means those are all open tickets for that month. They have not been marked as done yet.
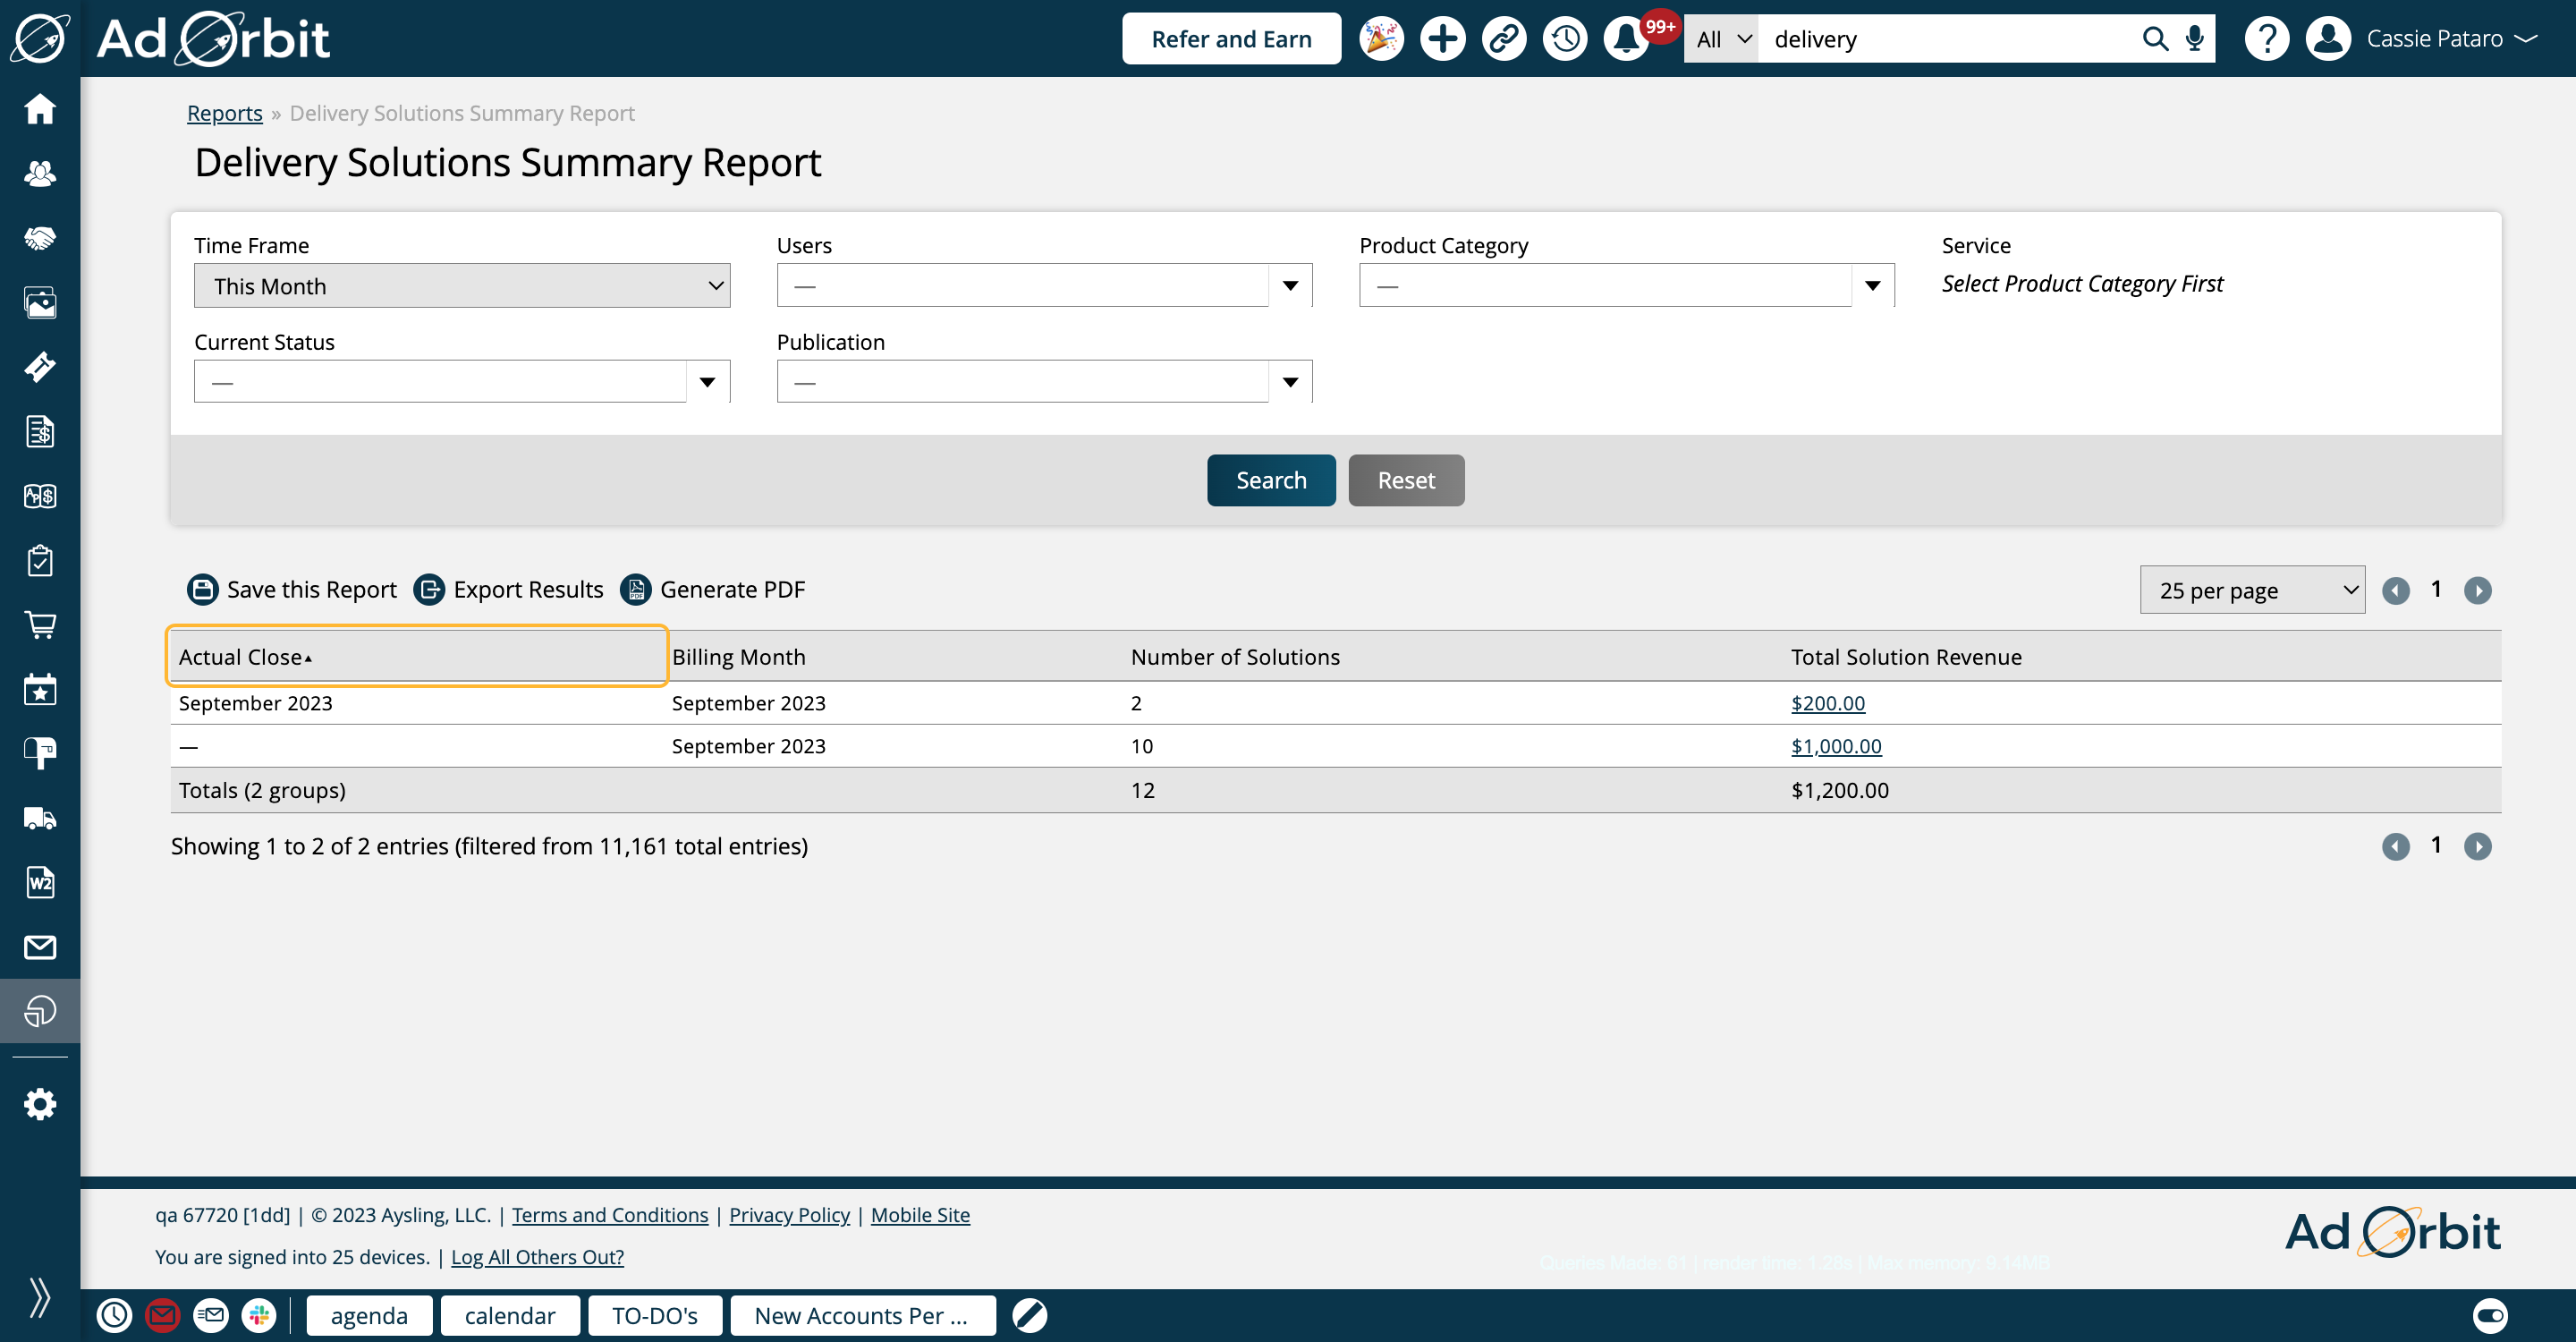
The Billing Month reflects the Billing Date set on the line items.
Your Actual Close and Billing Months may or may not be the same. Here are three sample scenarios:
You have a line item with a Billing Date of 9/15, and the ticket was marked as done on 10/13. In this case, it would have an Actual Close of October, with a Billing Month of September.
A line item has a Billing Date of 8/1, but the ticket was marked as done on 7/25. In this scenario, it would have an Actual Close of July with a Billing Month of August.
And finally, you have a line item with a Billing Date of 11/1, and the ticket was marked as done on 11/17. This item would have an Actual Close and Billing Month both showing November.

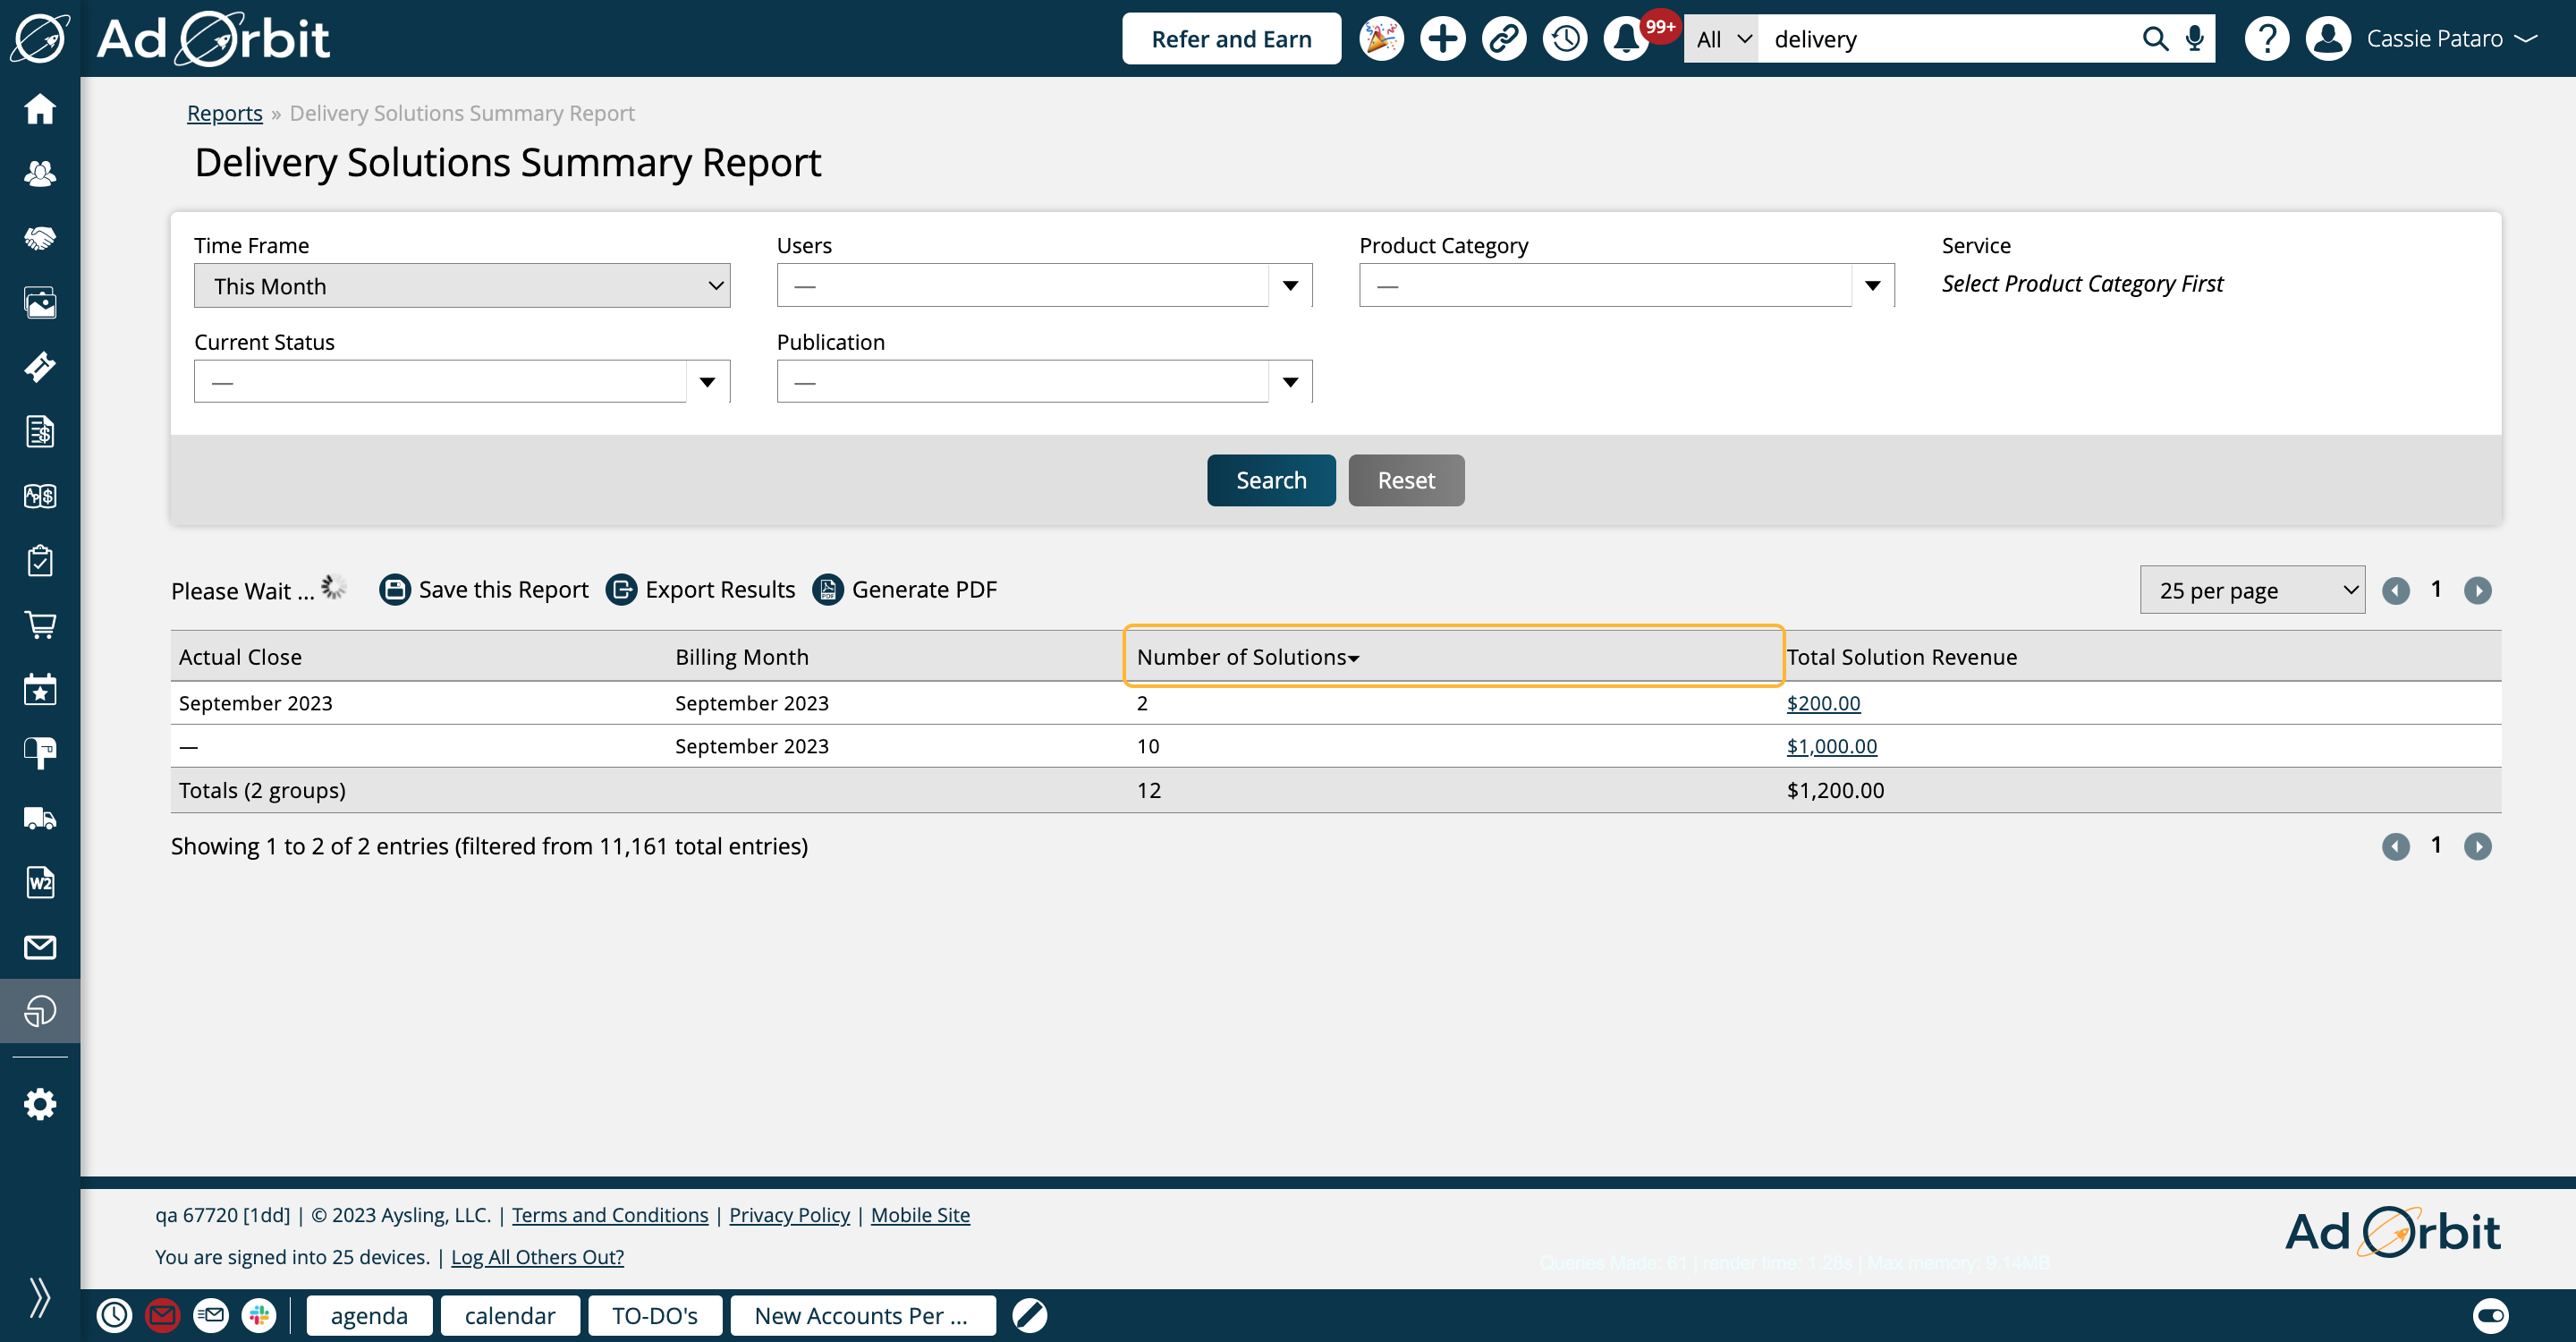
The Number of Solutions column reflects how many tickets fit into that Actual Close and Billing Month, based on the search criteria entered.
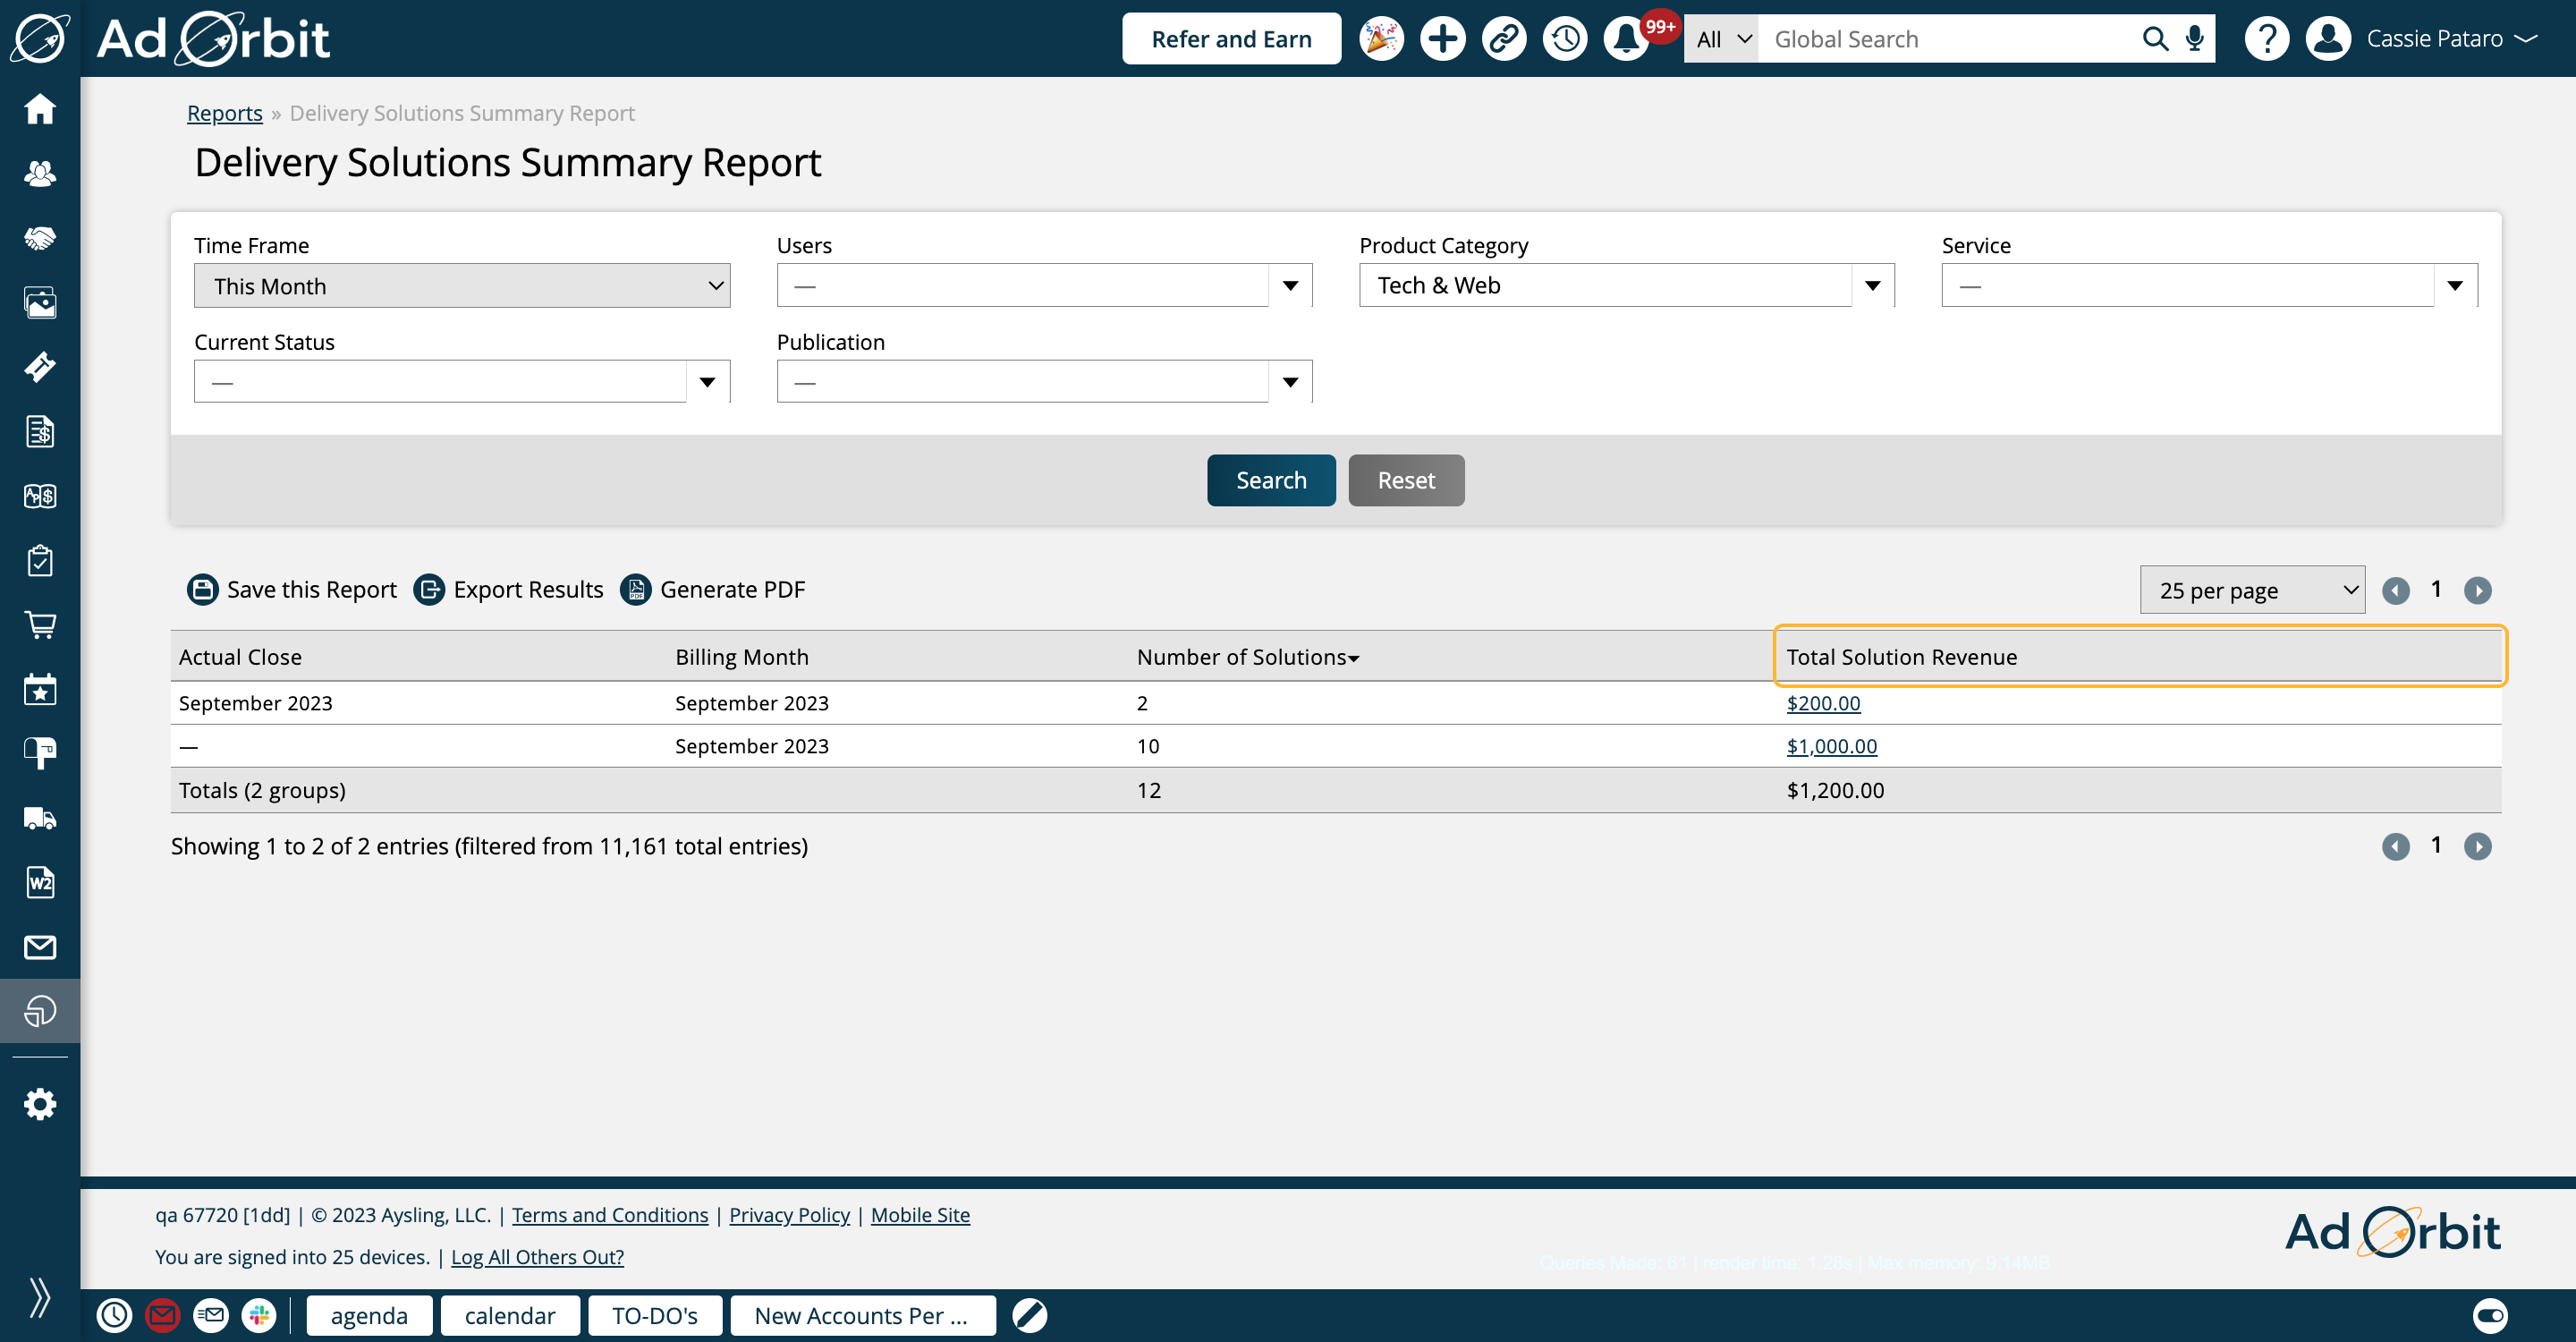
The Total Solution Revenue reflects the total revenue for the tickets in that row. You can click on the value in this column to open the Consolidated Sales report, which will have certain search fields automatically populated.
New 9/15/2023