Annual Client Spend
The Annual Client Spend Report shows the sales based on delivery date or sold date for your customers over the course of 12 months. Use the report to see how much your customers have bought with you this year and compare it to the previous year. You can drill down from this report to see the details of what customers purchased in the time period.
To access the report, you need the User Permission 'Annual Client Spend'.
To view data in the report for all users, not just yourself and any users who report to you, you need the sub-permission 'View All Users'.
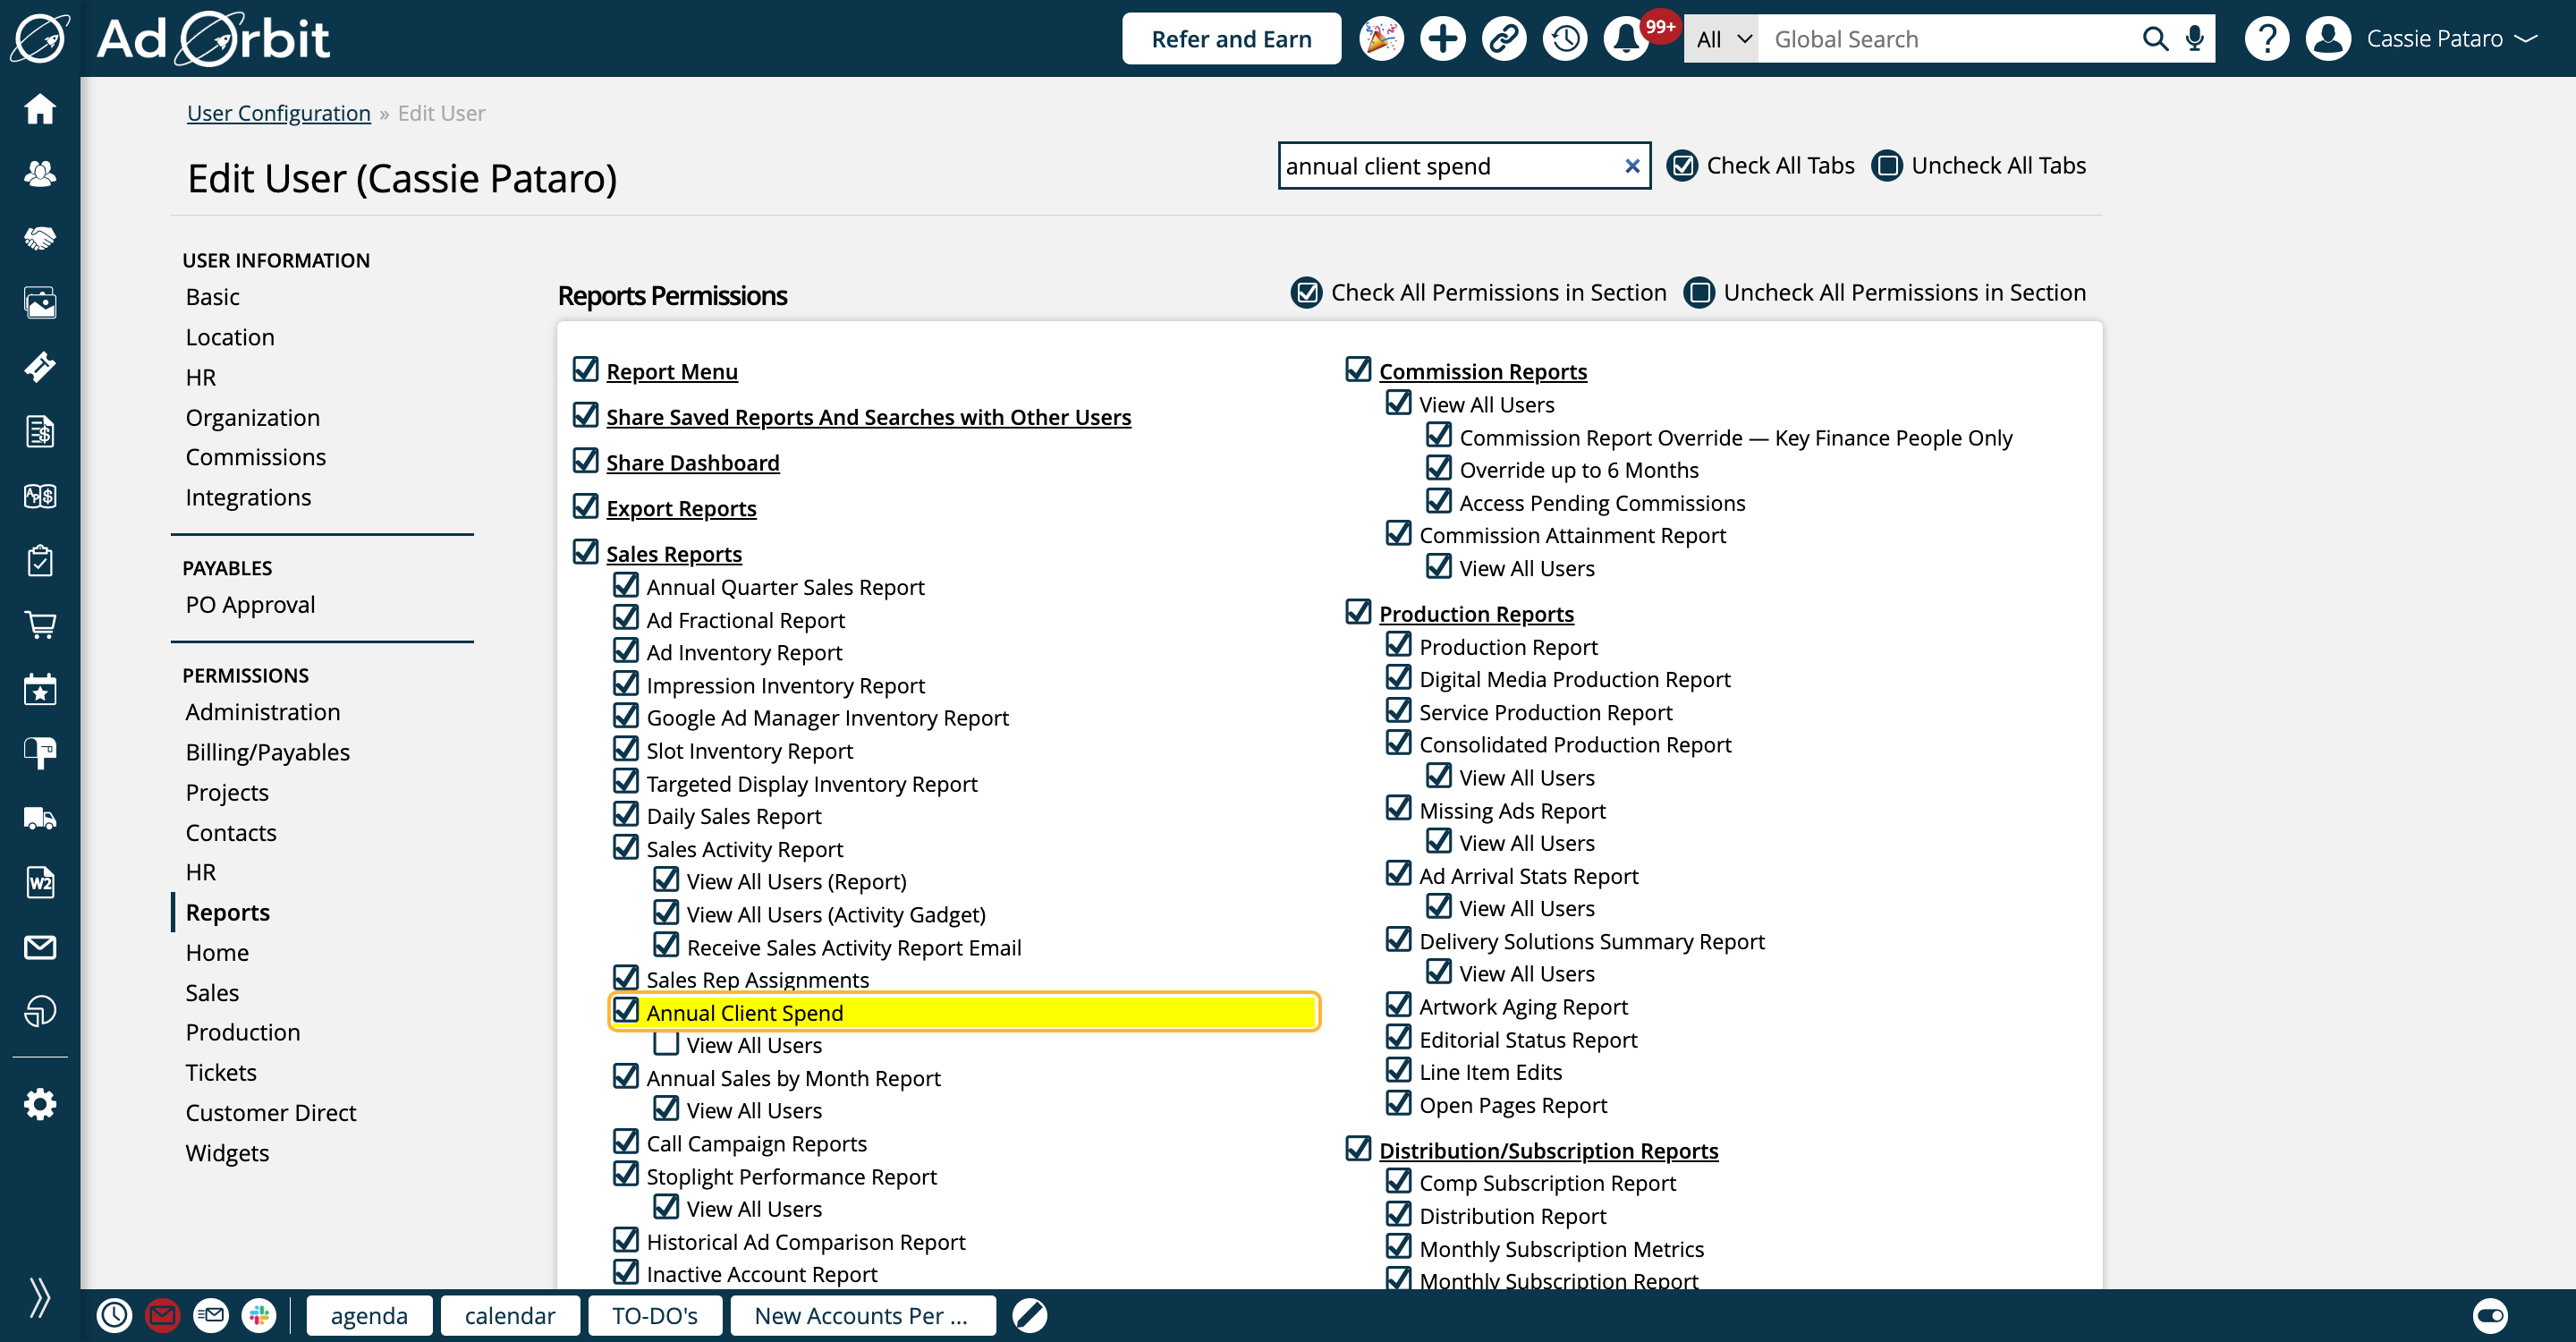
Before using the report, we recommend having the following items set up.
You can find the Annual Client Spend Report by going to Reports > All Reports and clicking on the report name. Or, you can use the global search bar.
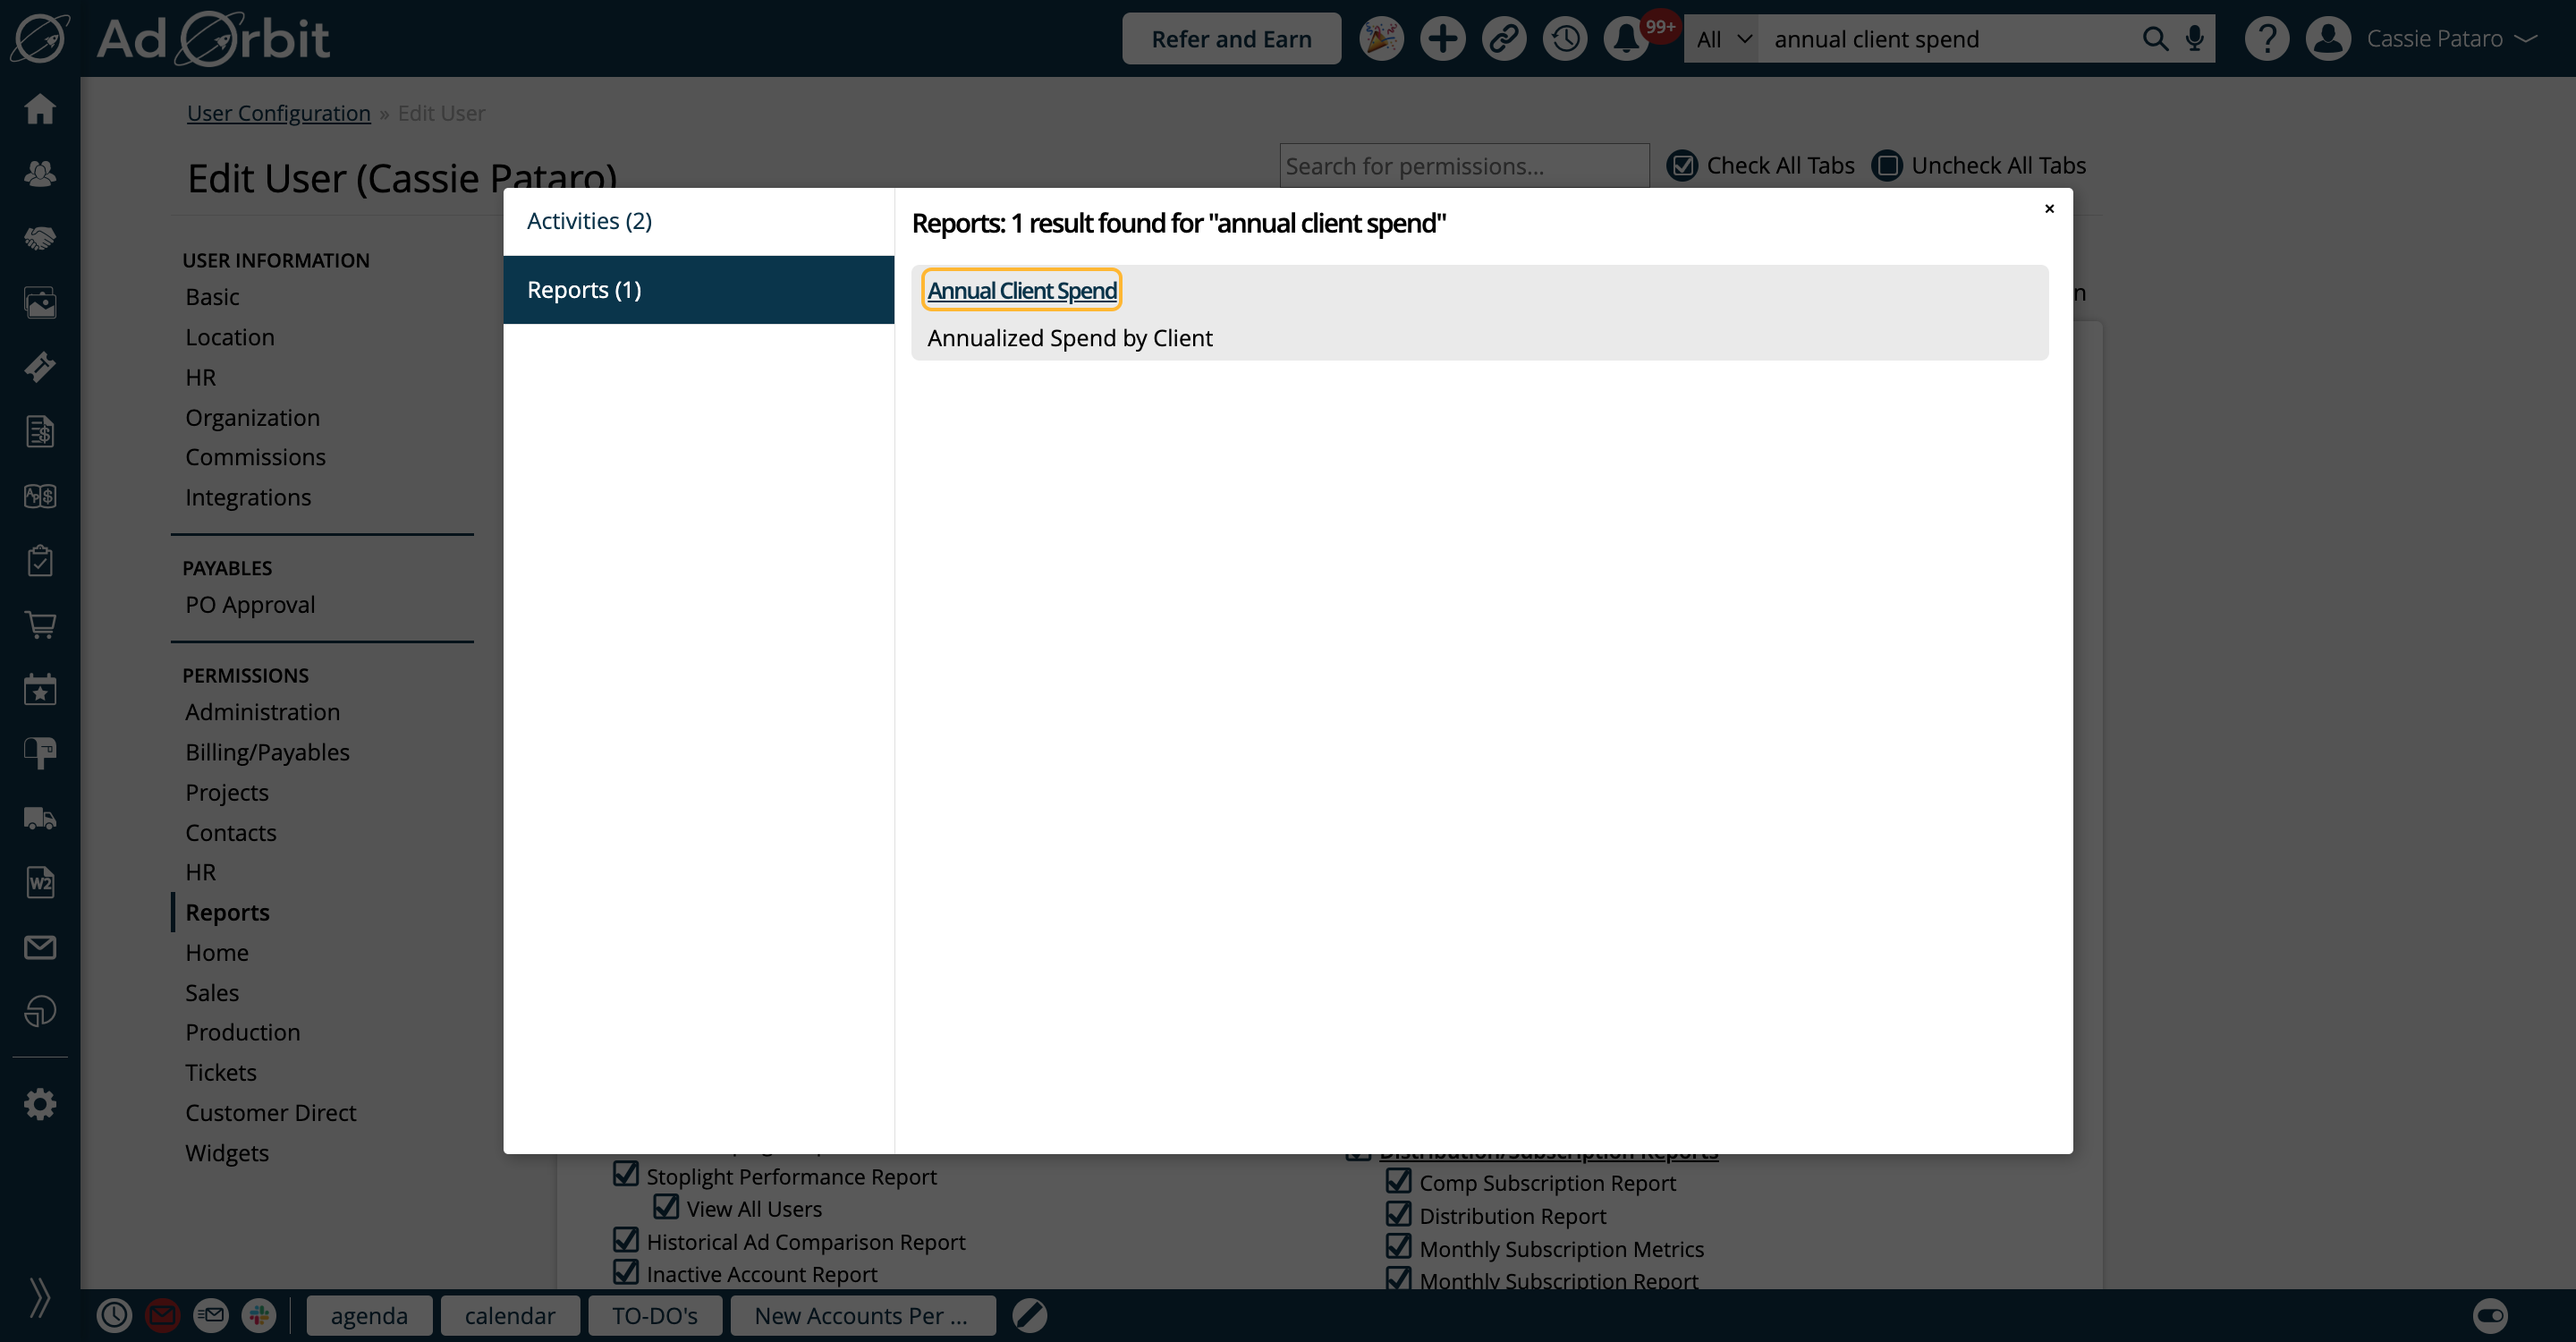
By default the report will show all of the available search fields. If you wish to customize what fields appear, click 'Edit Search Filters'.
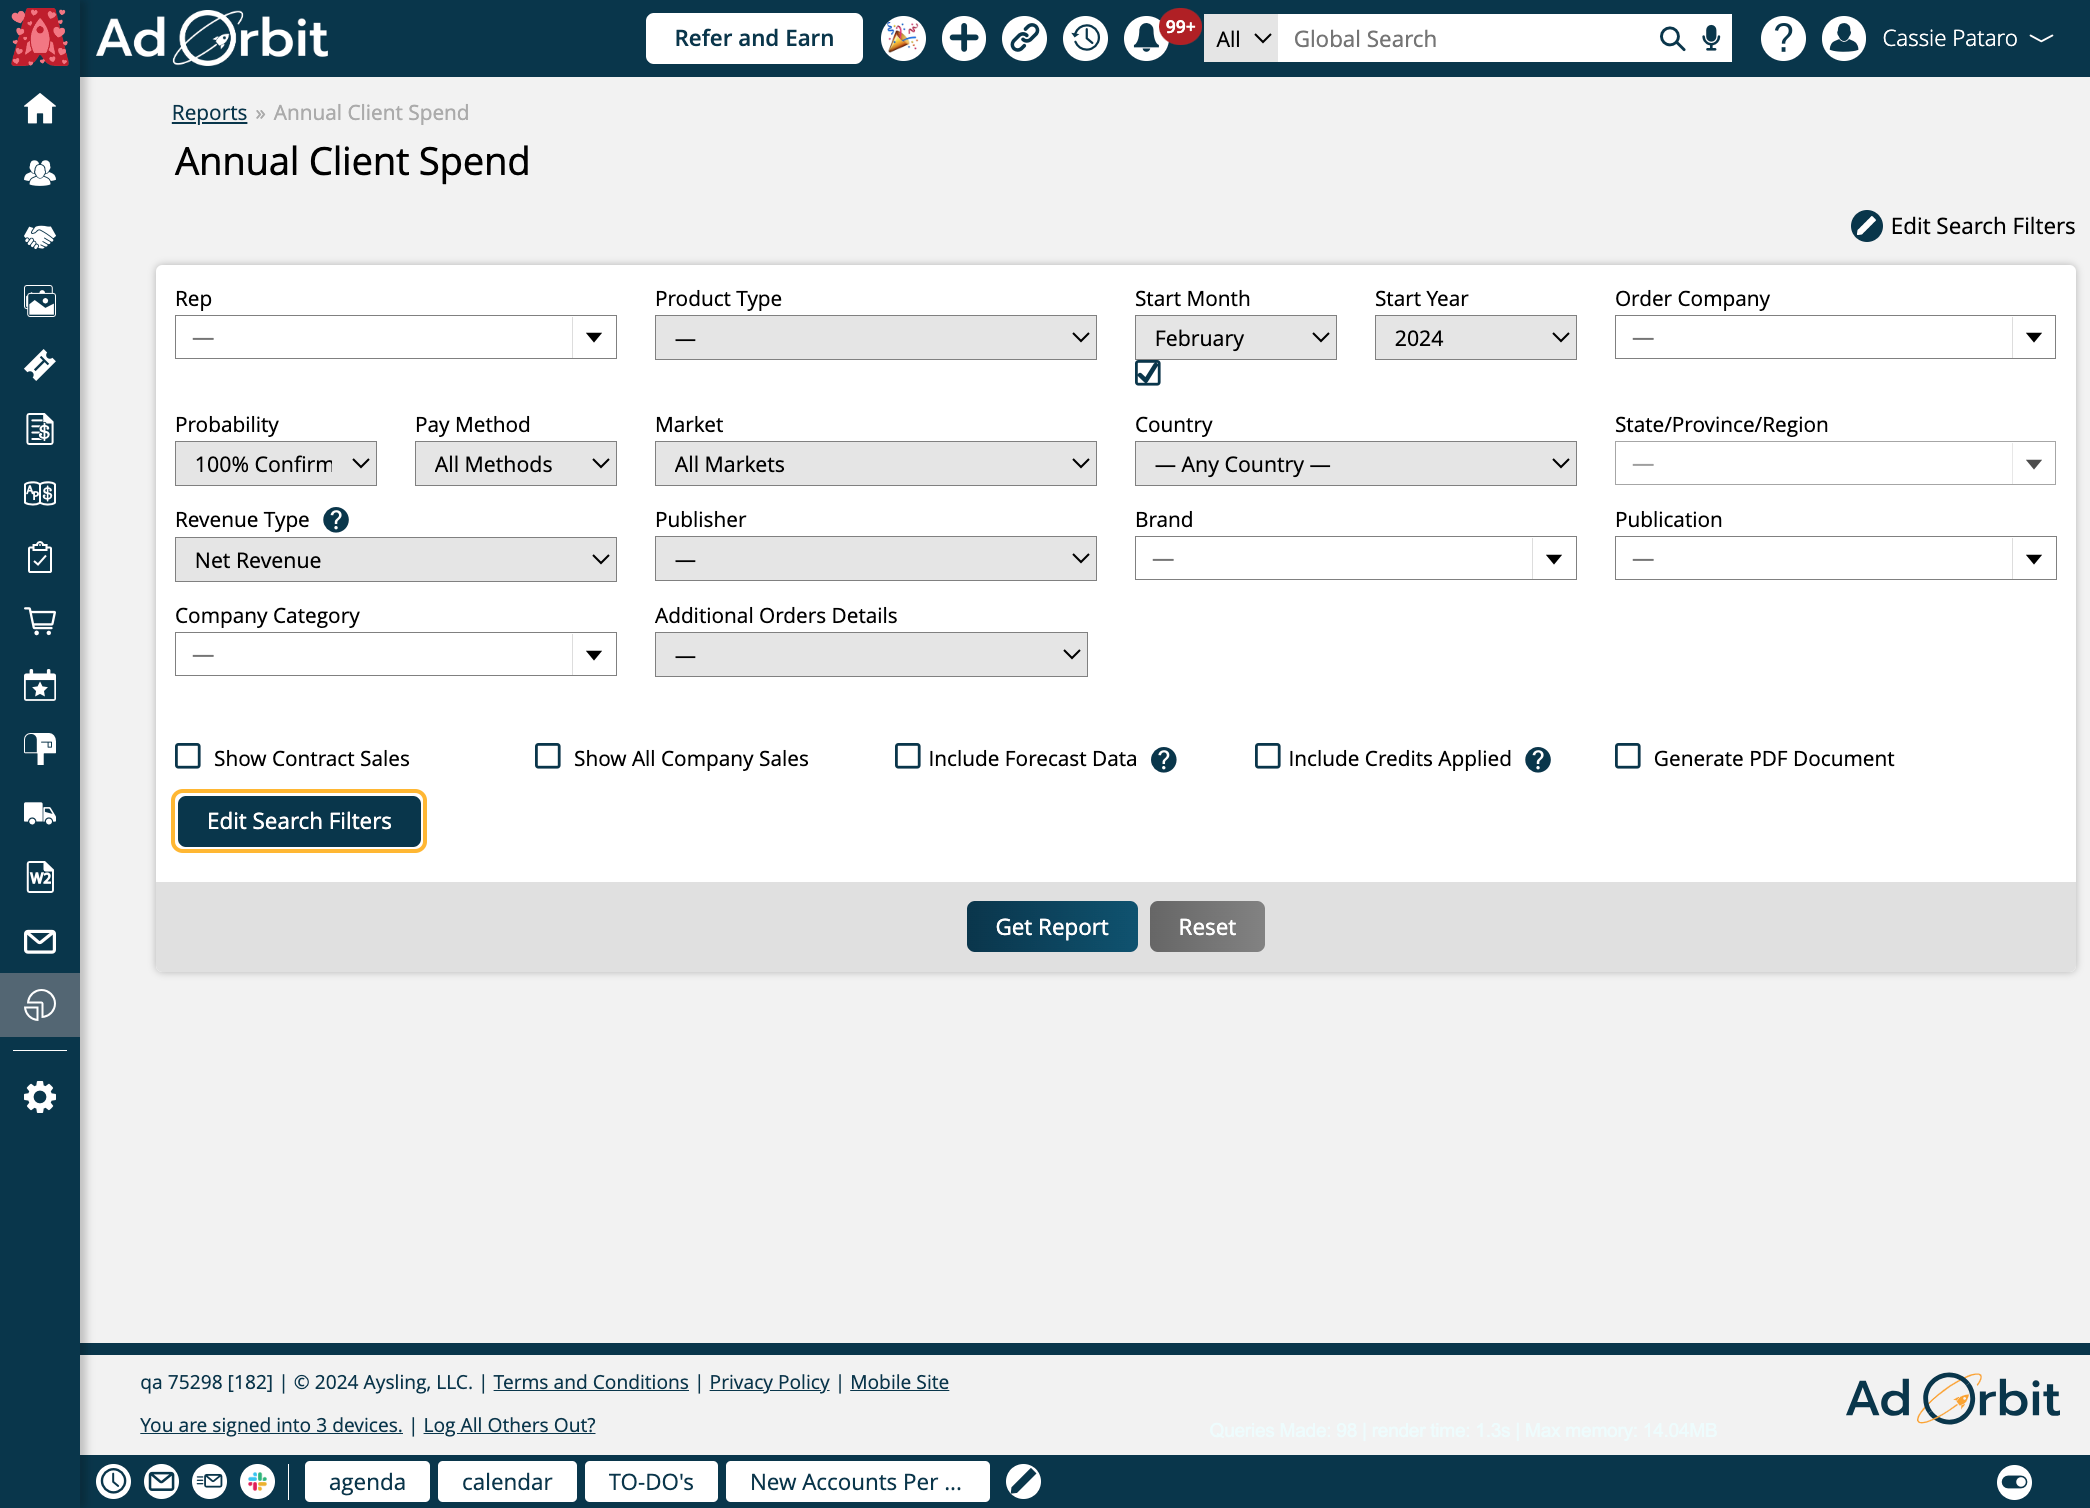
When editing the fields that display, you can either update the display for just yourself, or for all users if you have the User Permission 'Apply Default Search Filters for All Users'.
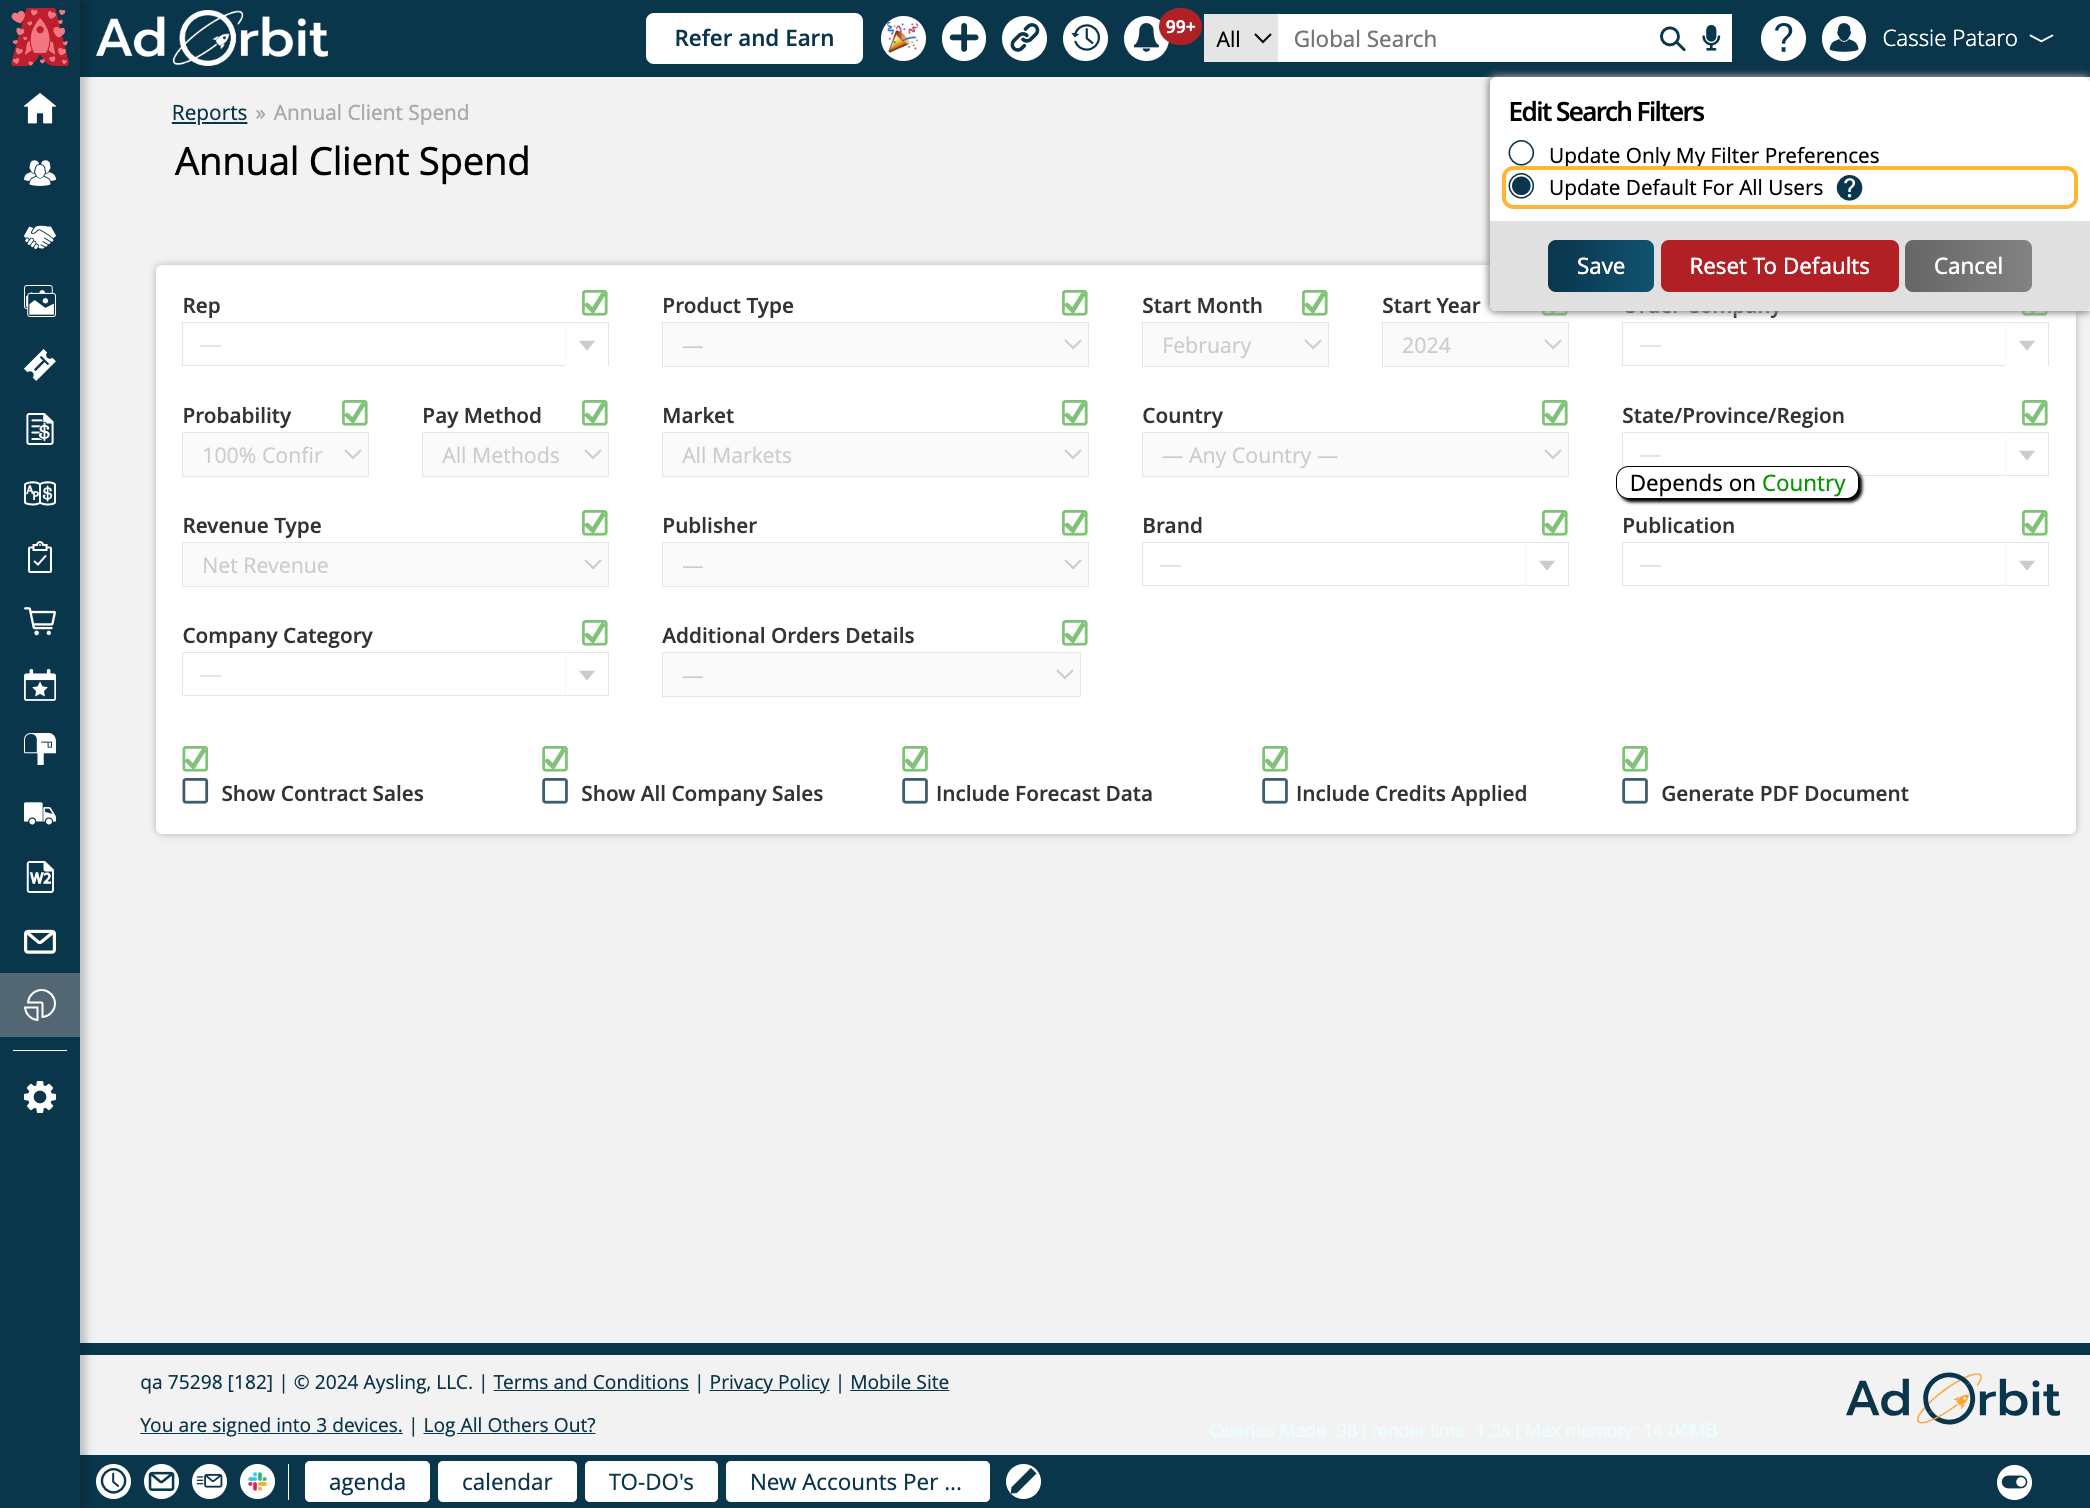
Any fields currently displaying will be shown in bold text with a green checkbox.
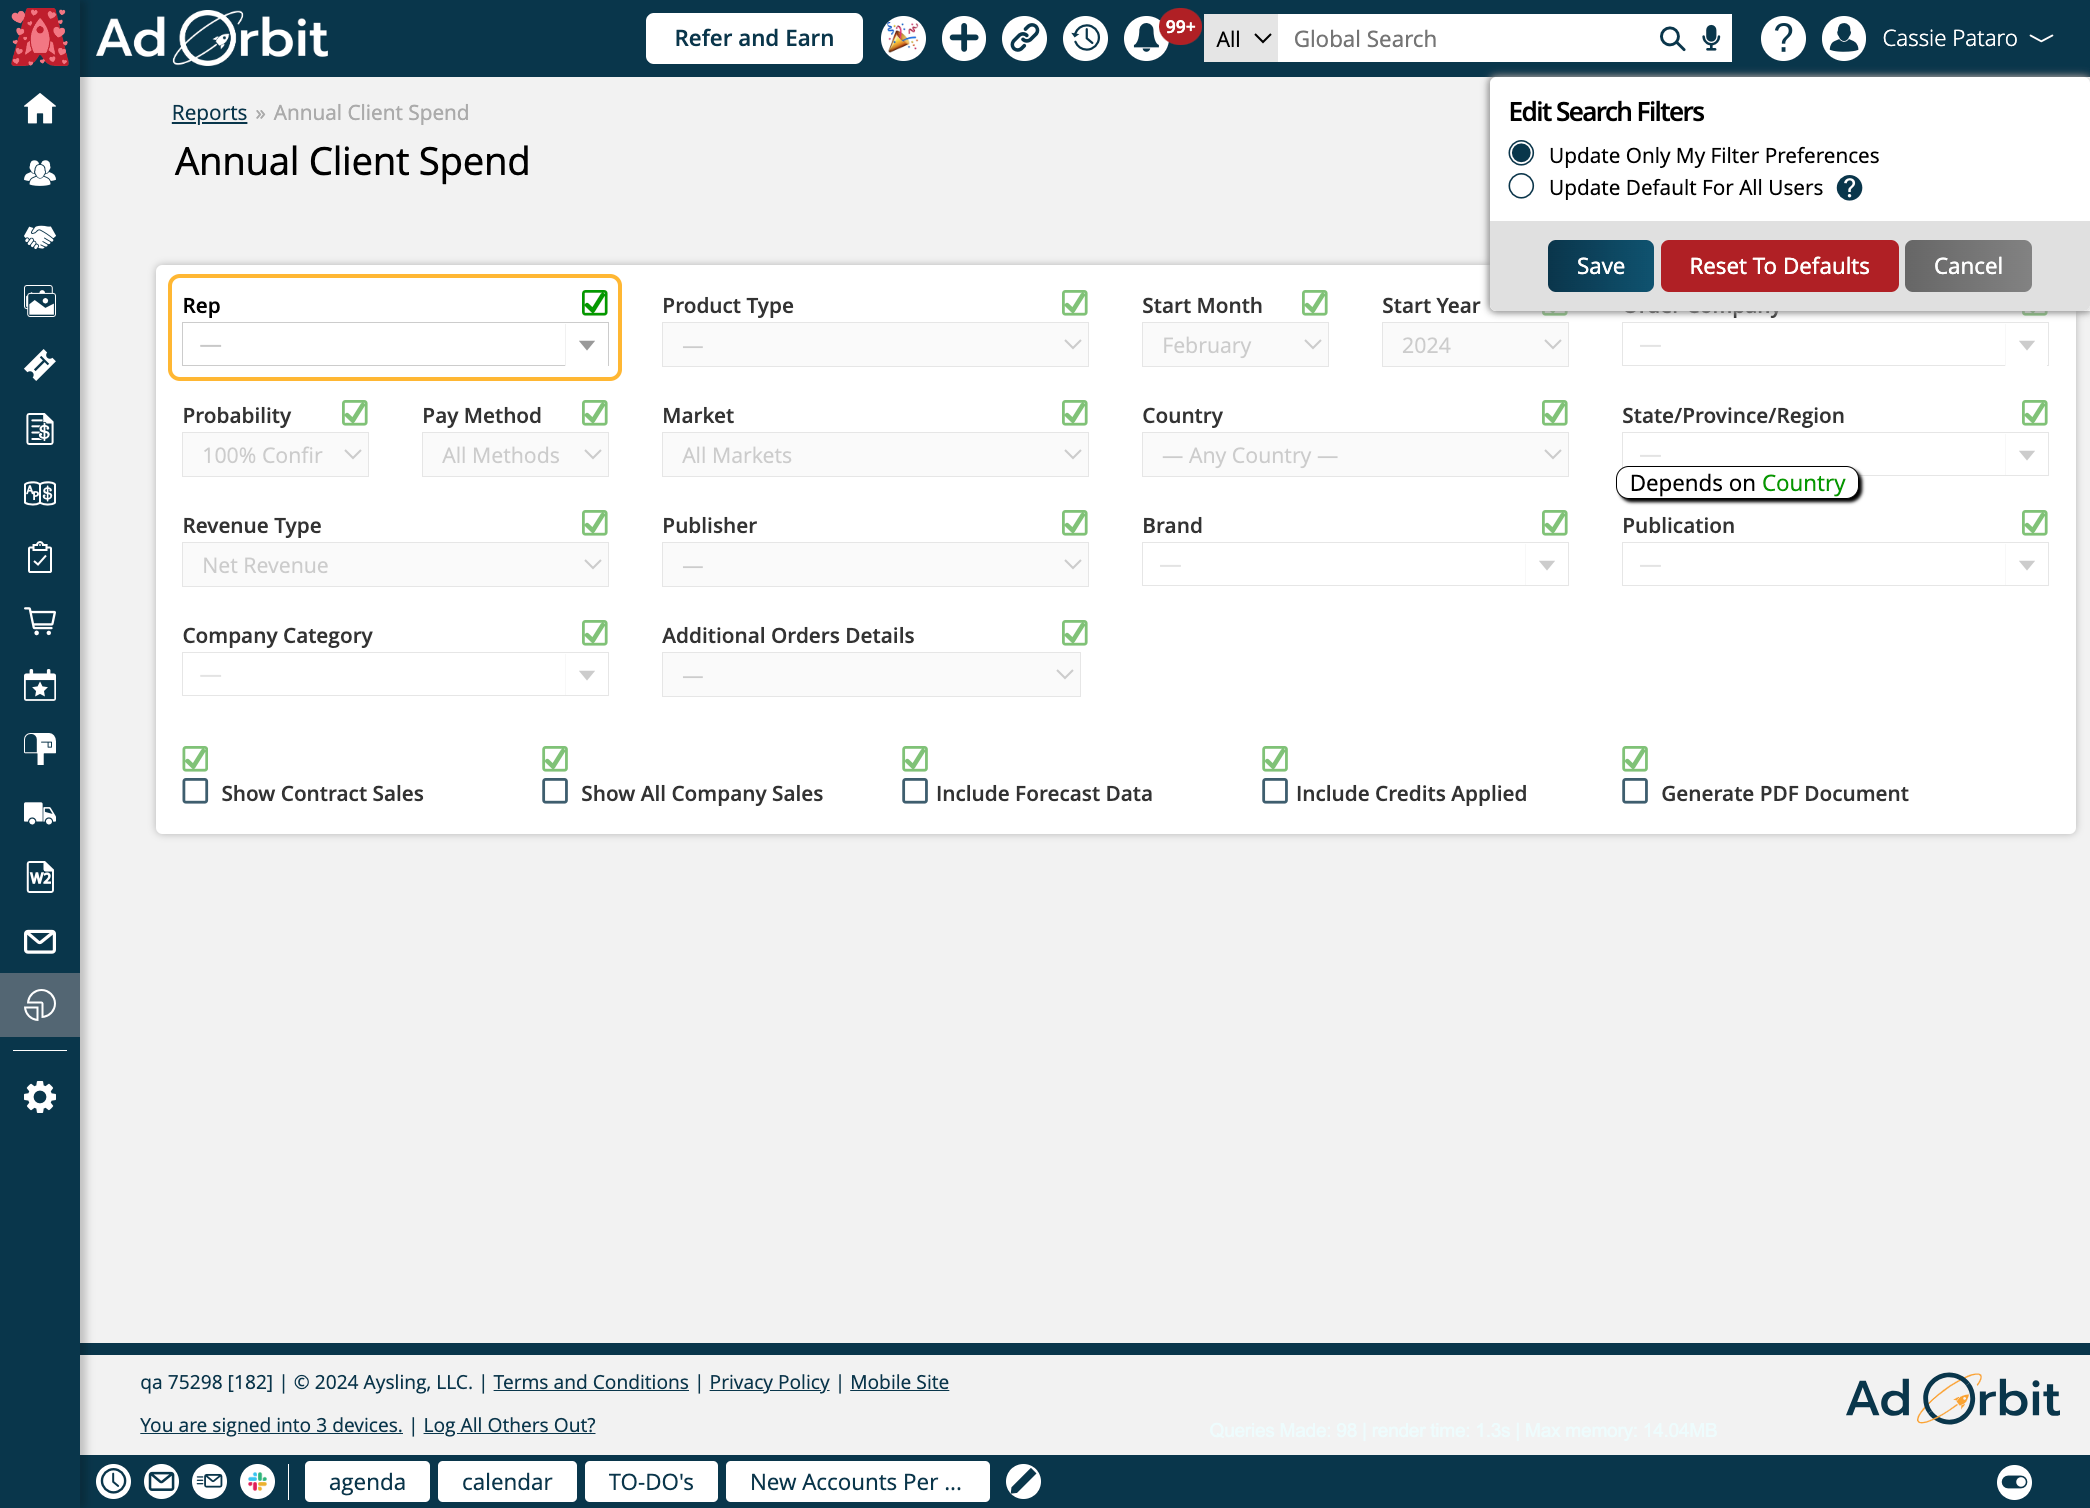
Simply click on a field to enable or disable it from showing in the display. Any fields not marked to display will be shown in grayed out text with a red checkbox.
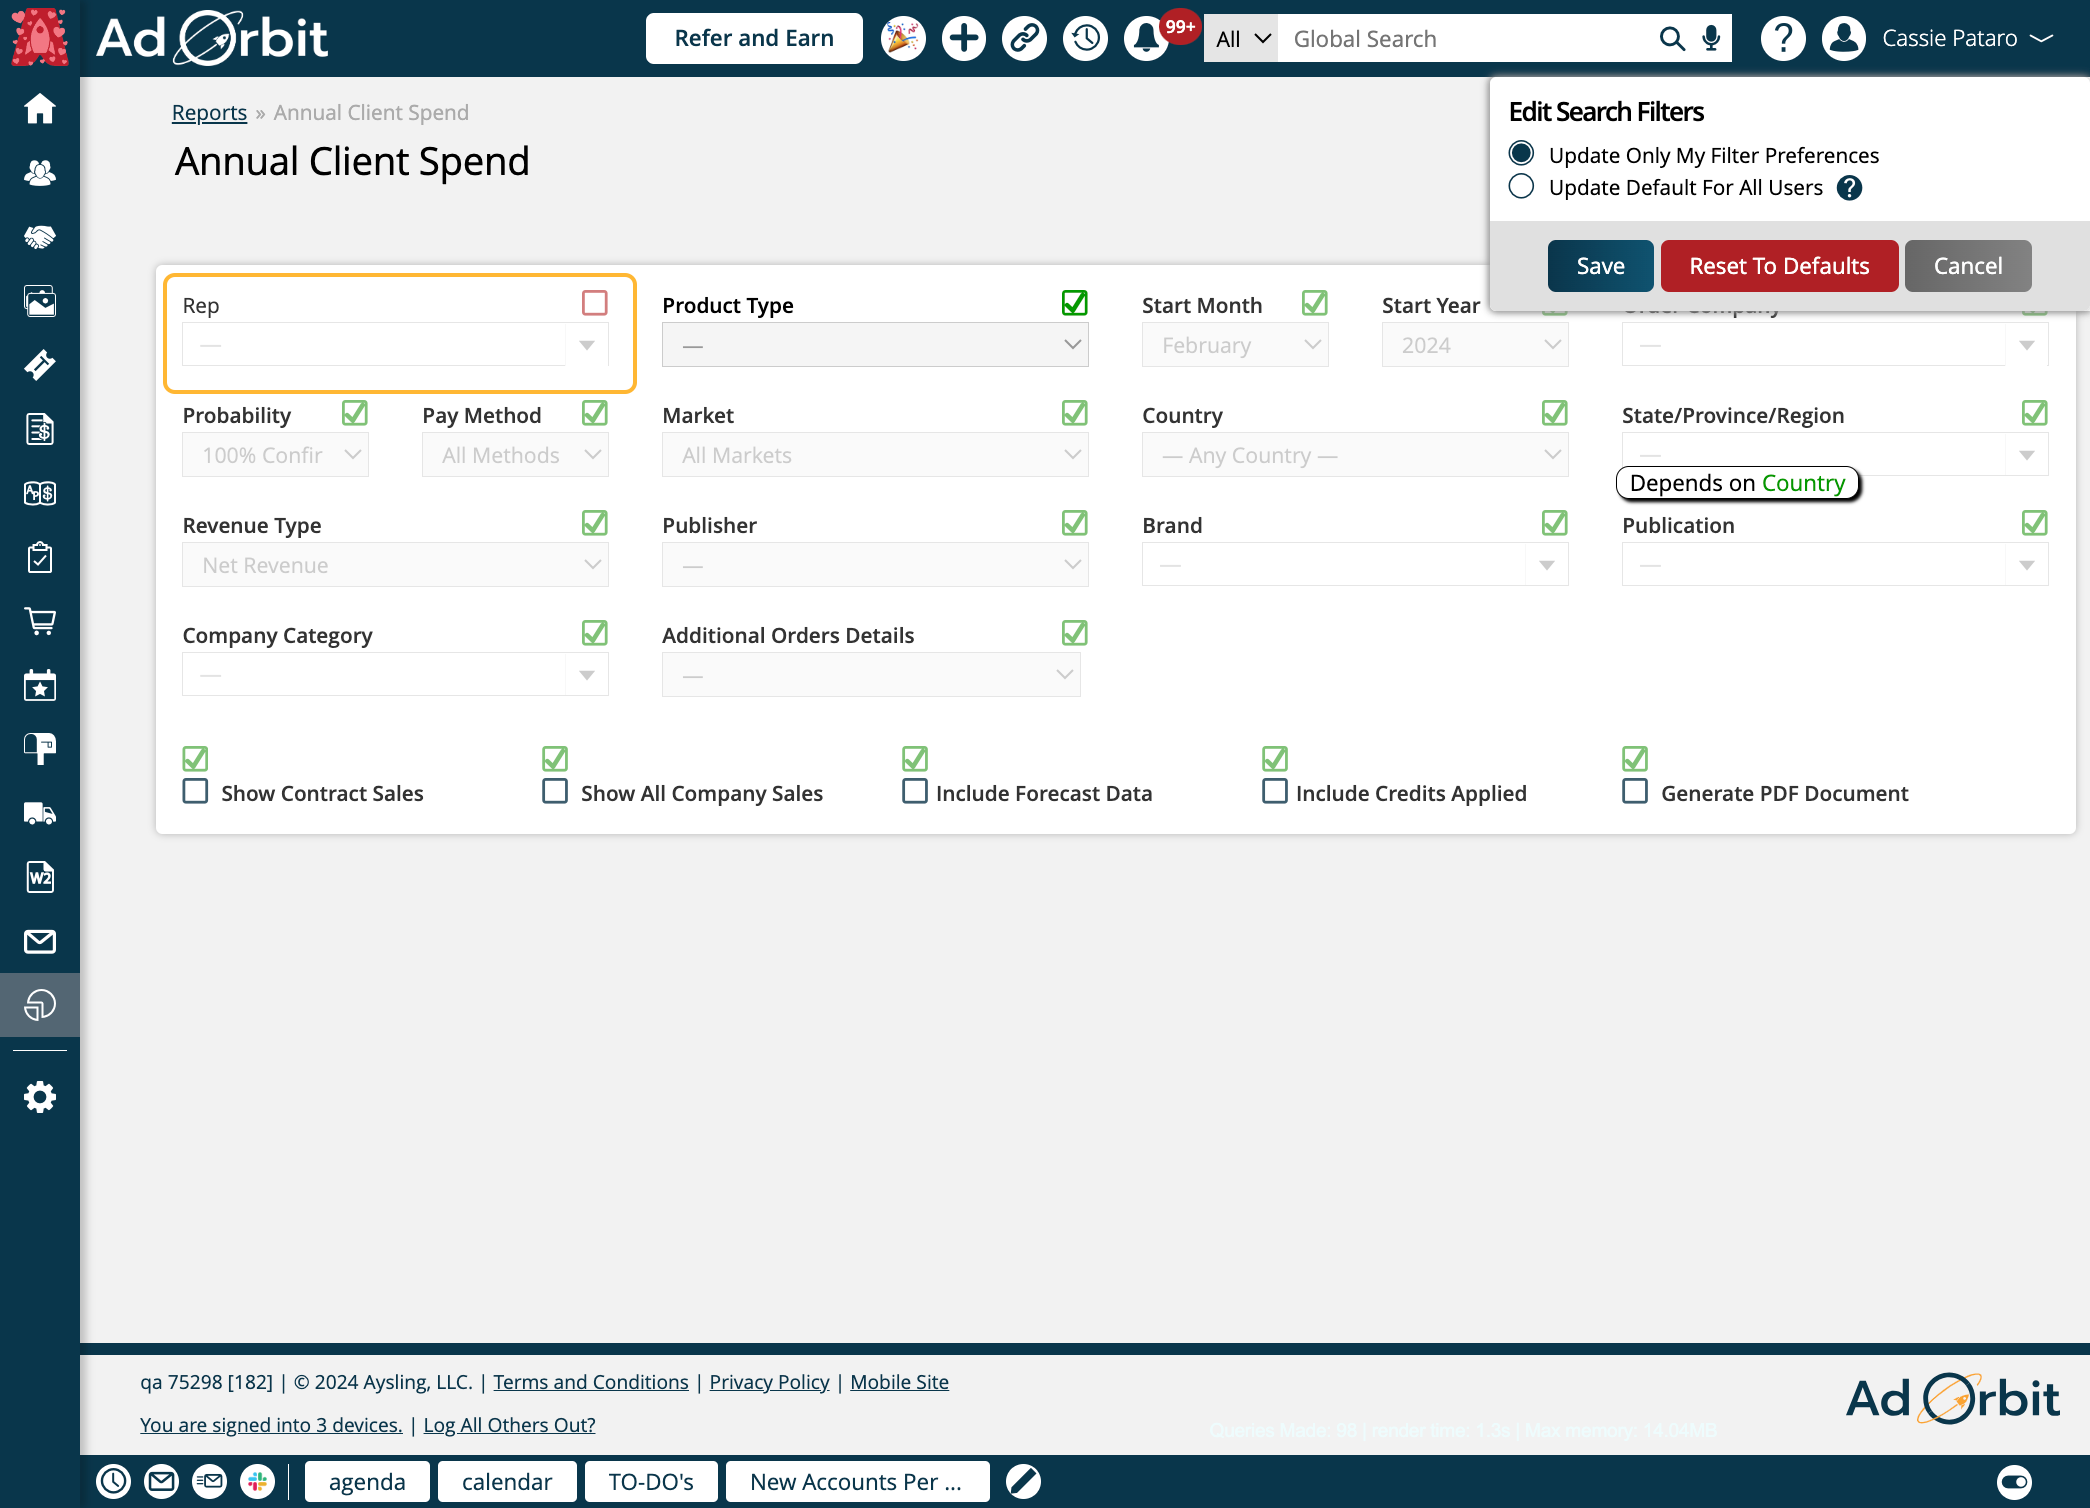
Click Save to apply your changes.
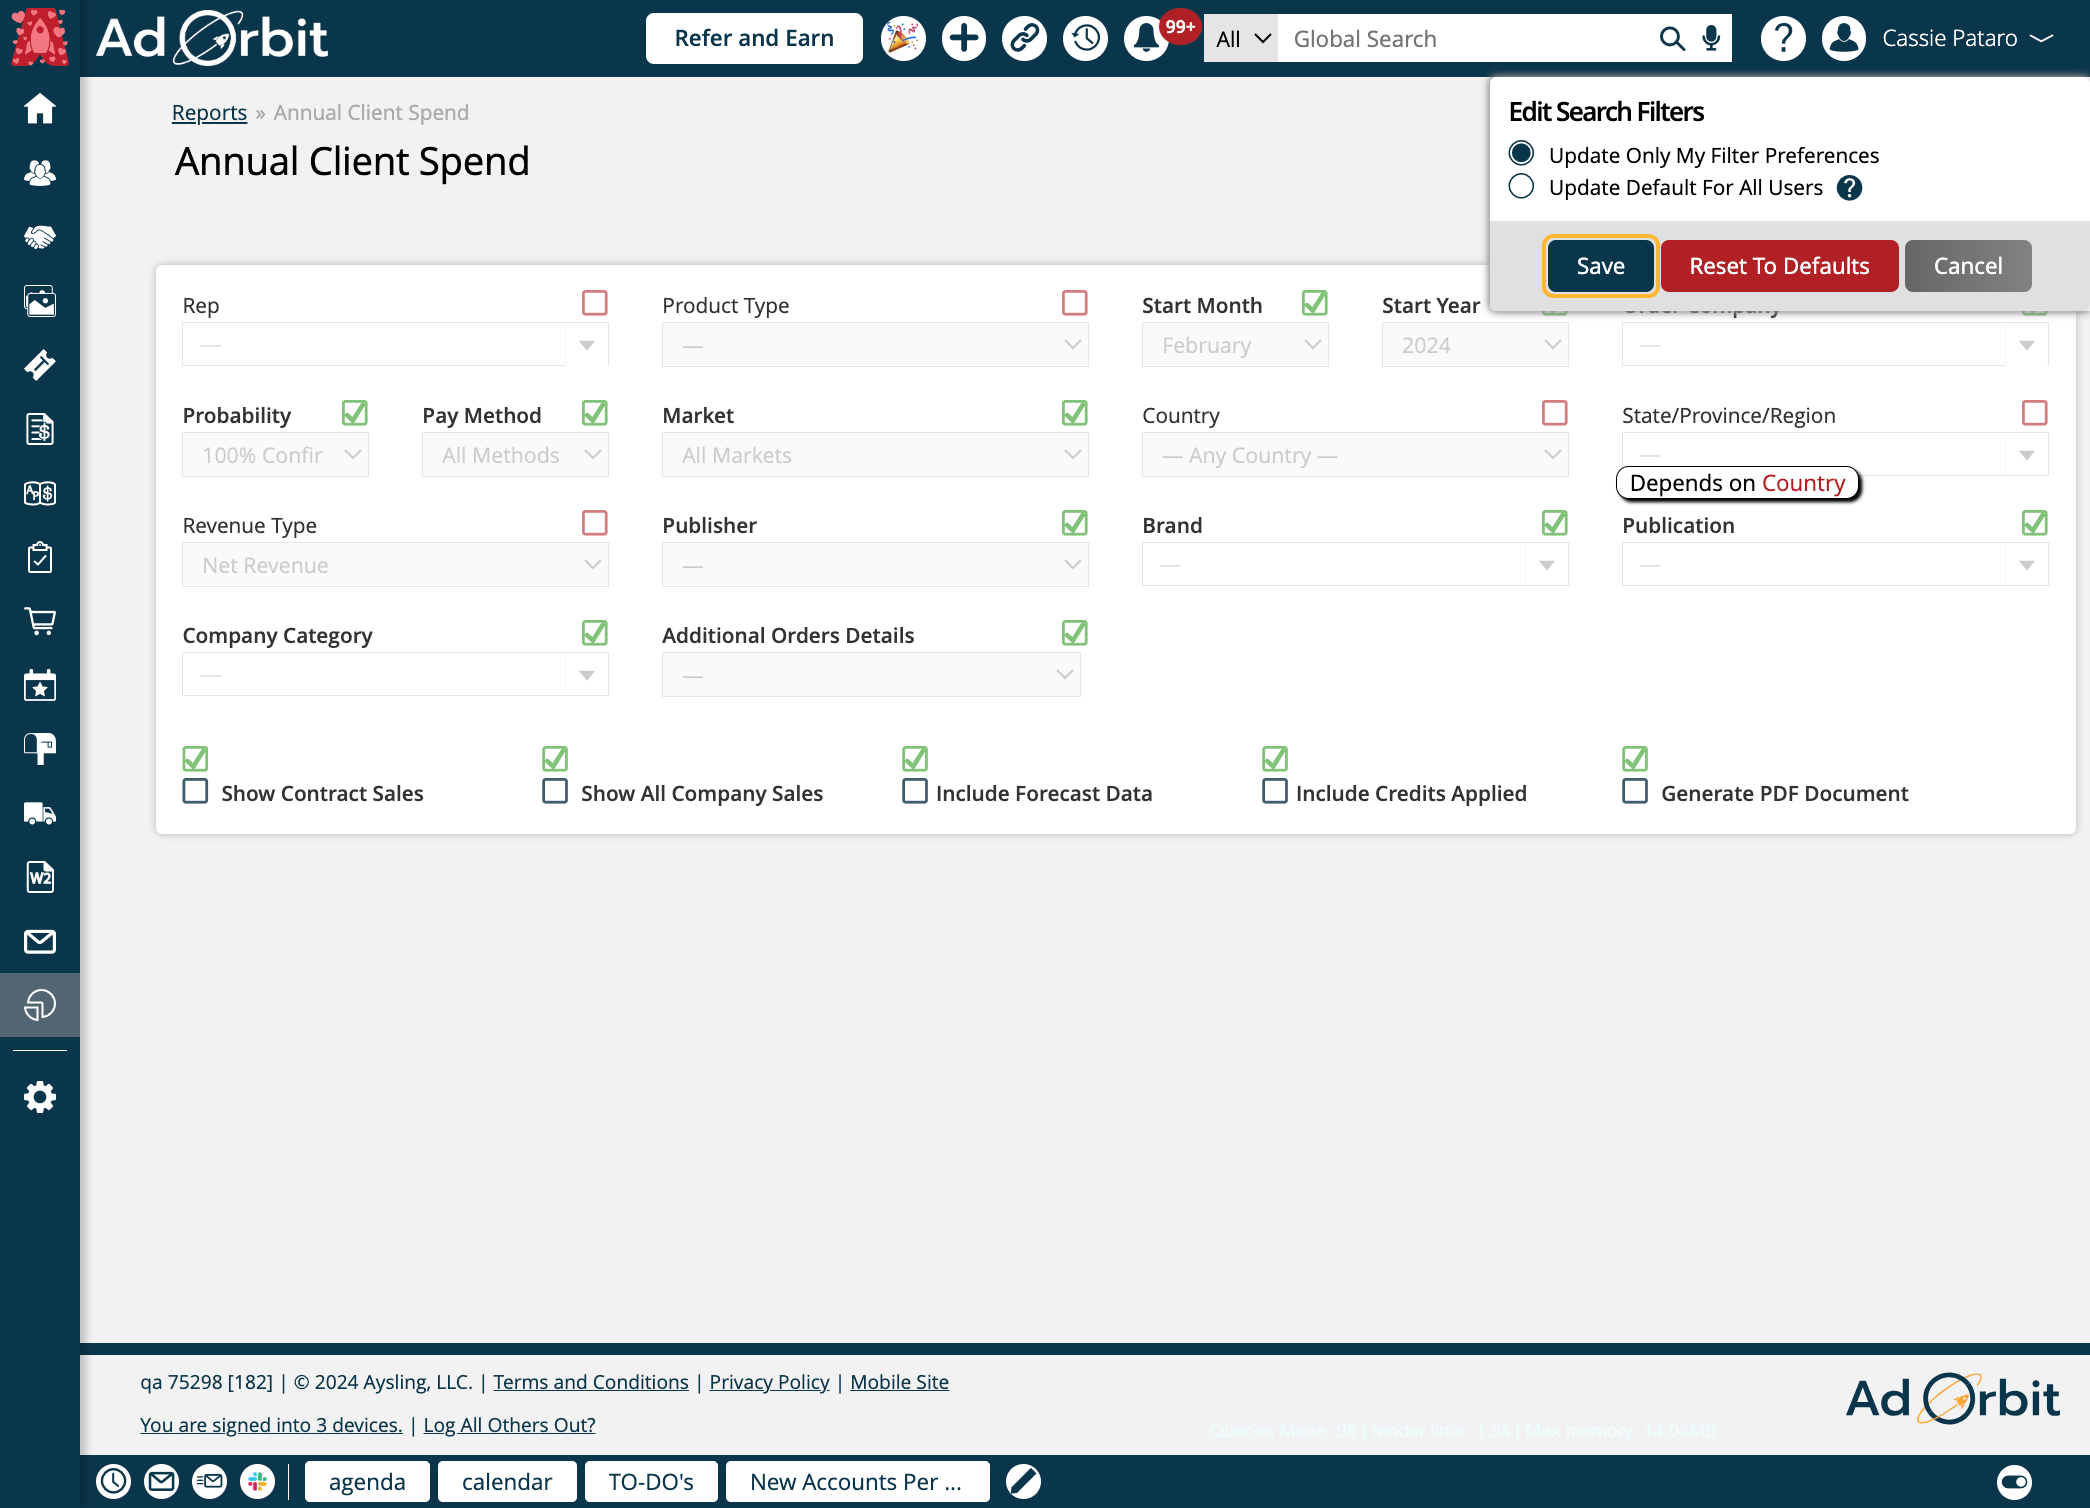
Or, click Reset to Defaults to revert back to showing all search fields on the report.
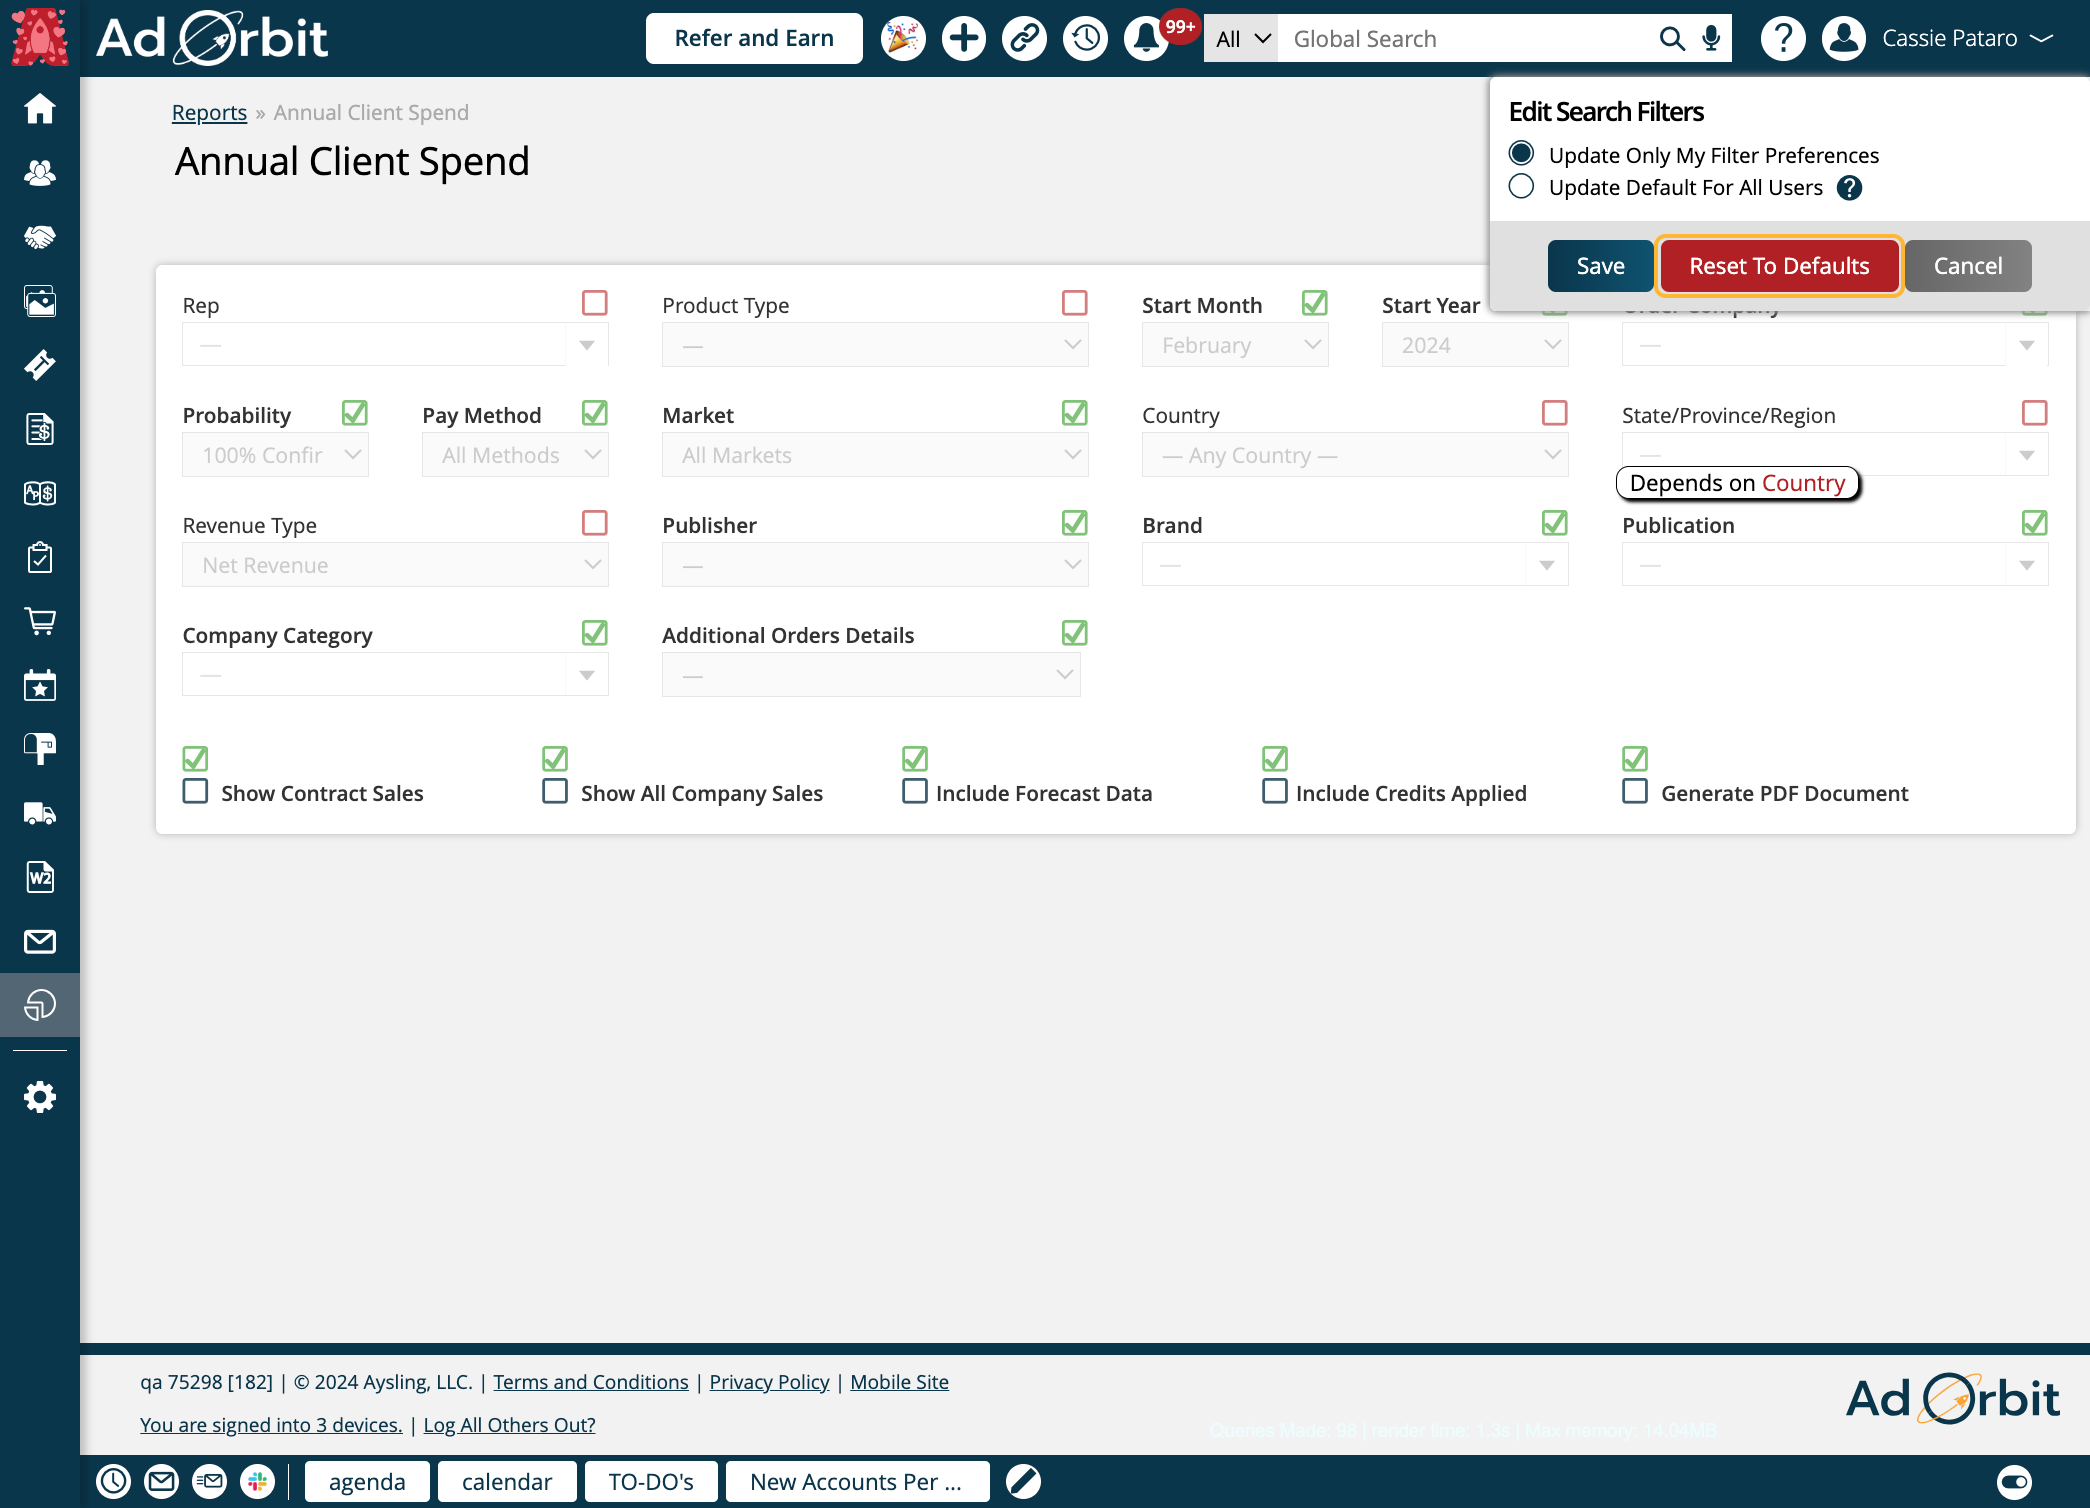
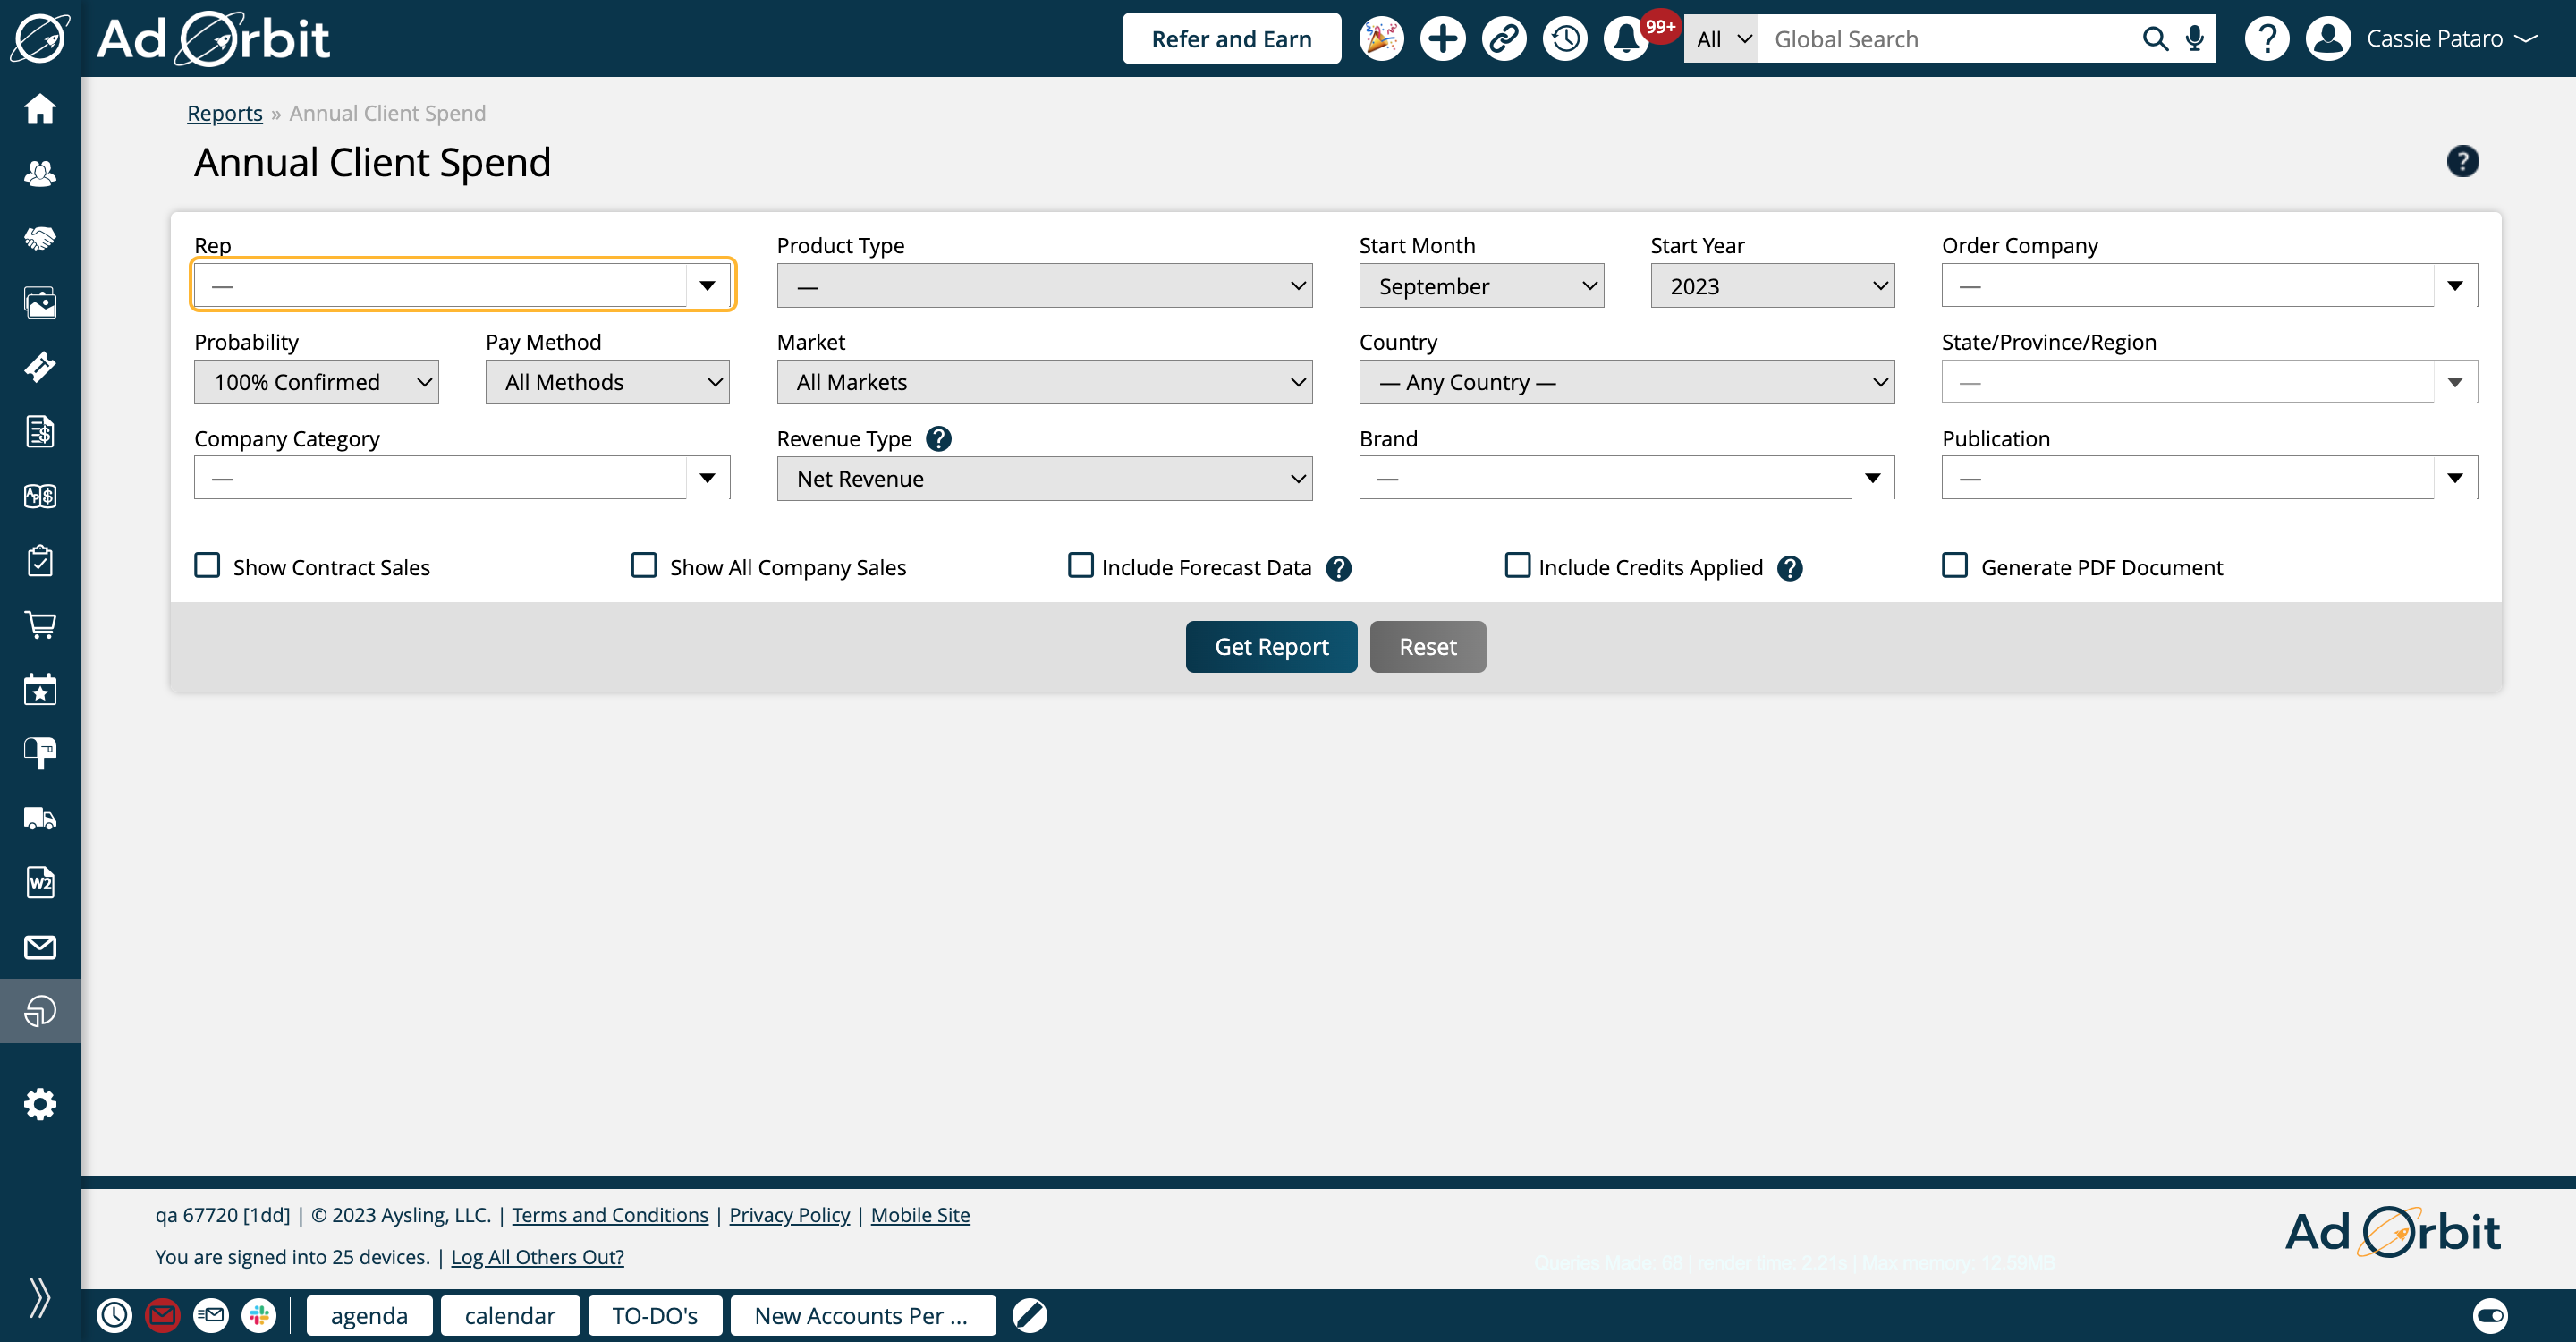
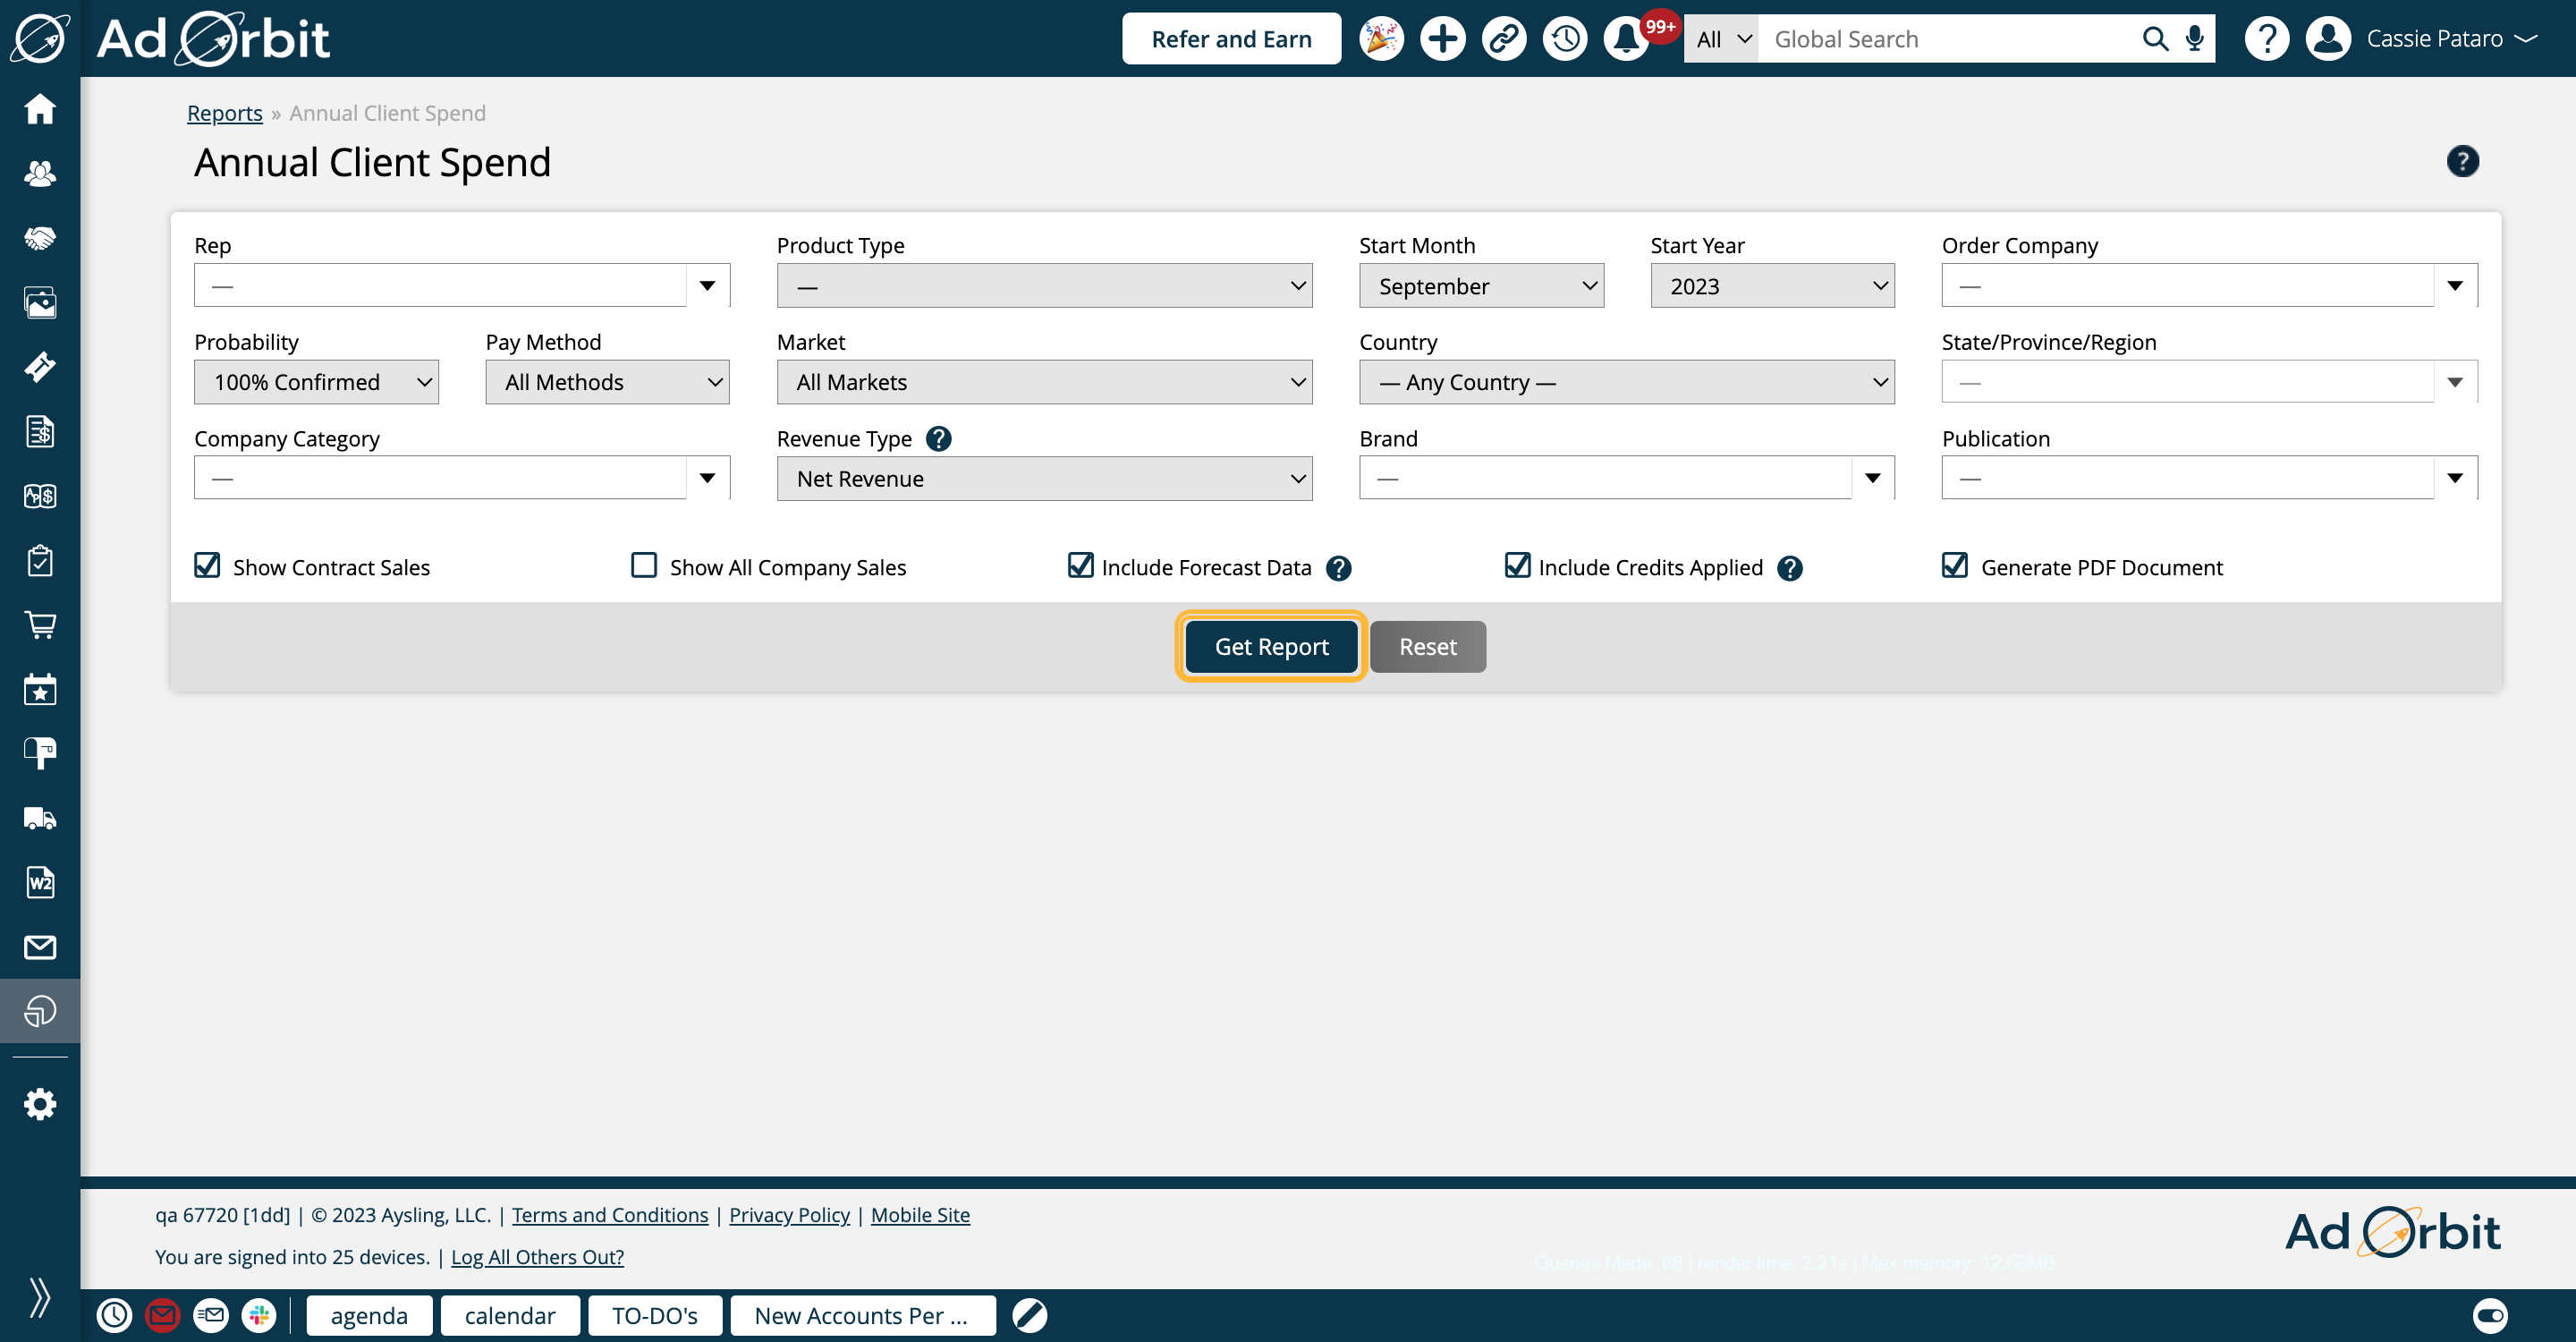
There are various search fields on the report which can help you find the results you are looking for. The first is Rep.
This finds results based on either Order Rep or Primary Rep, depending on whether or not you have 'Show All Company Sales' checked.By default, it uses Order Rep.
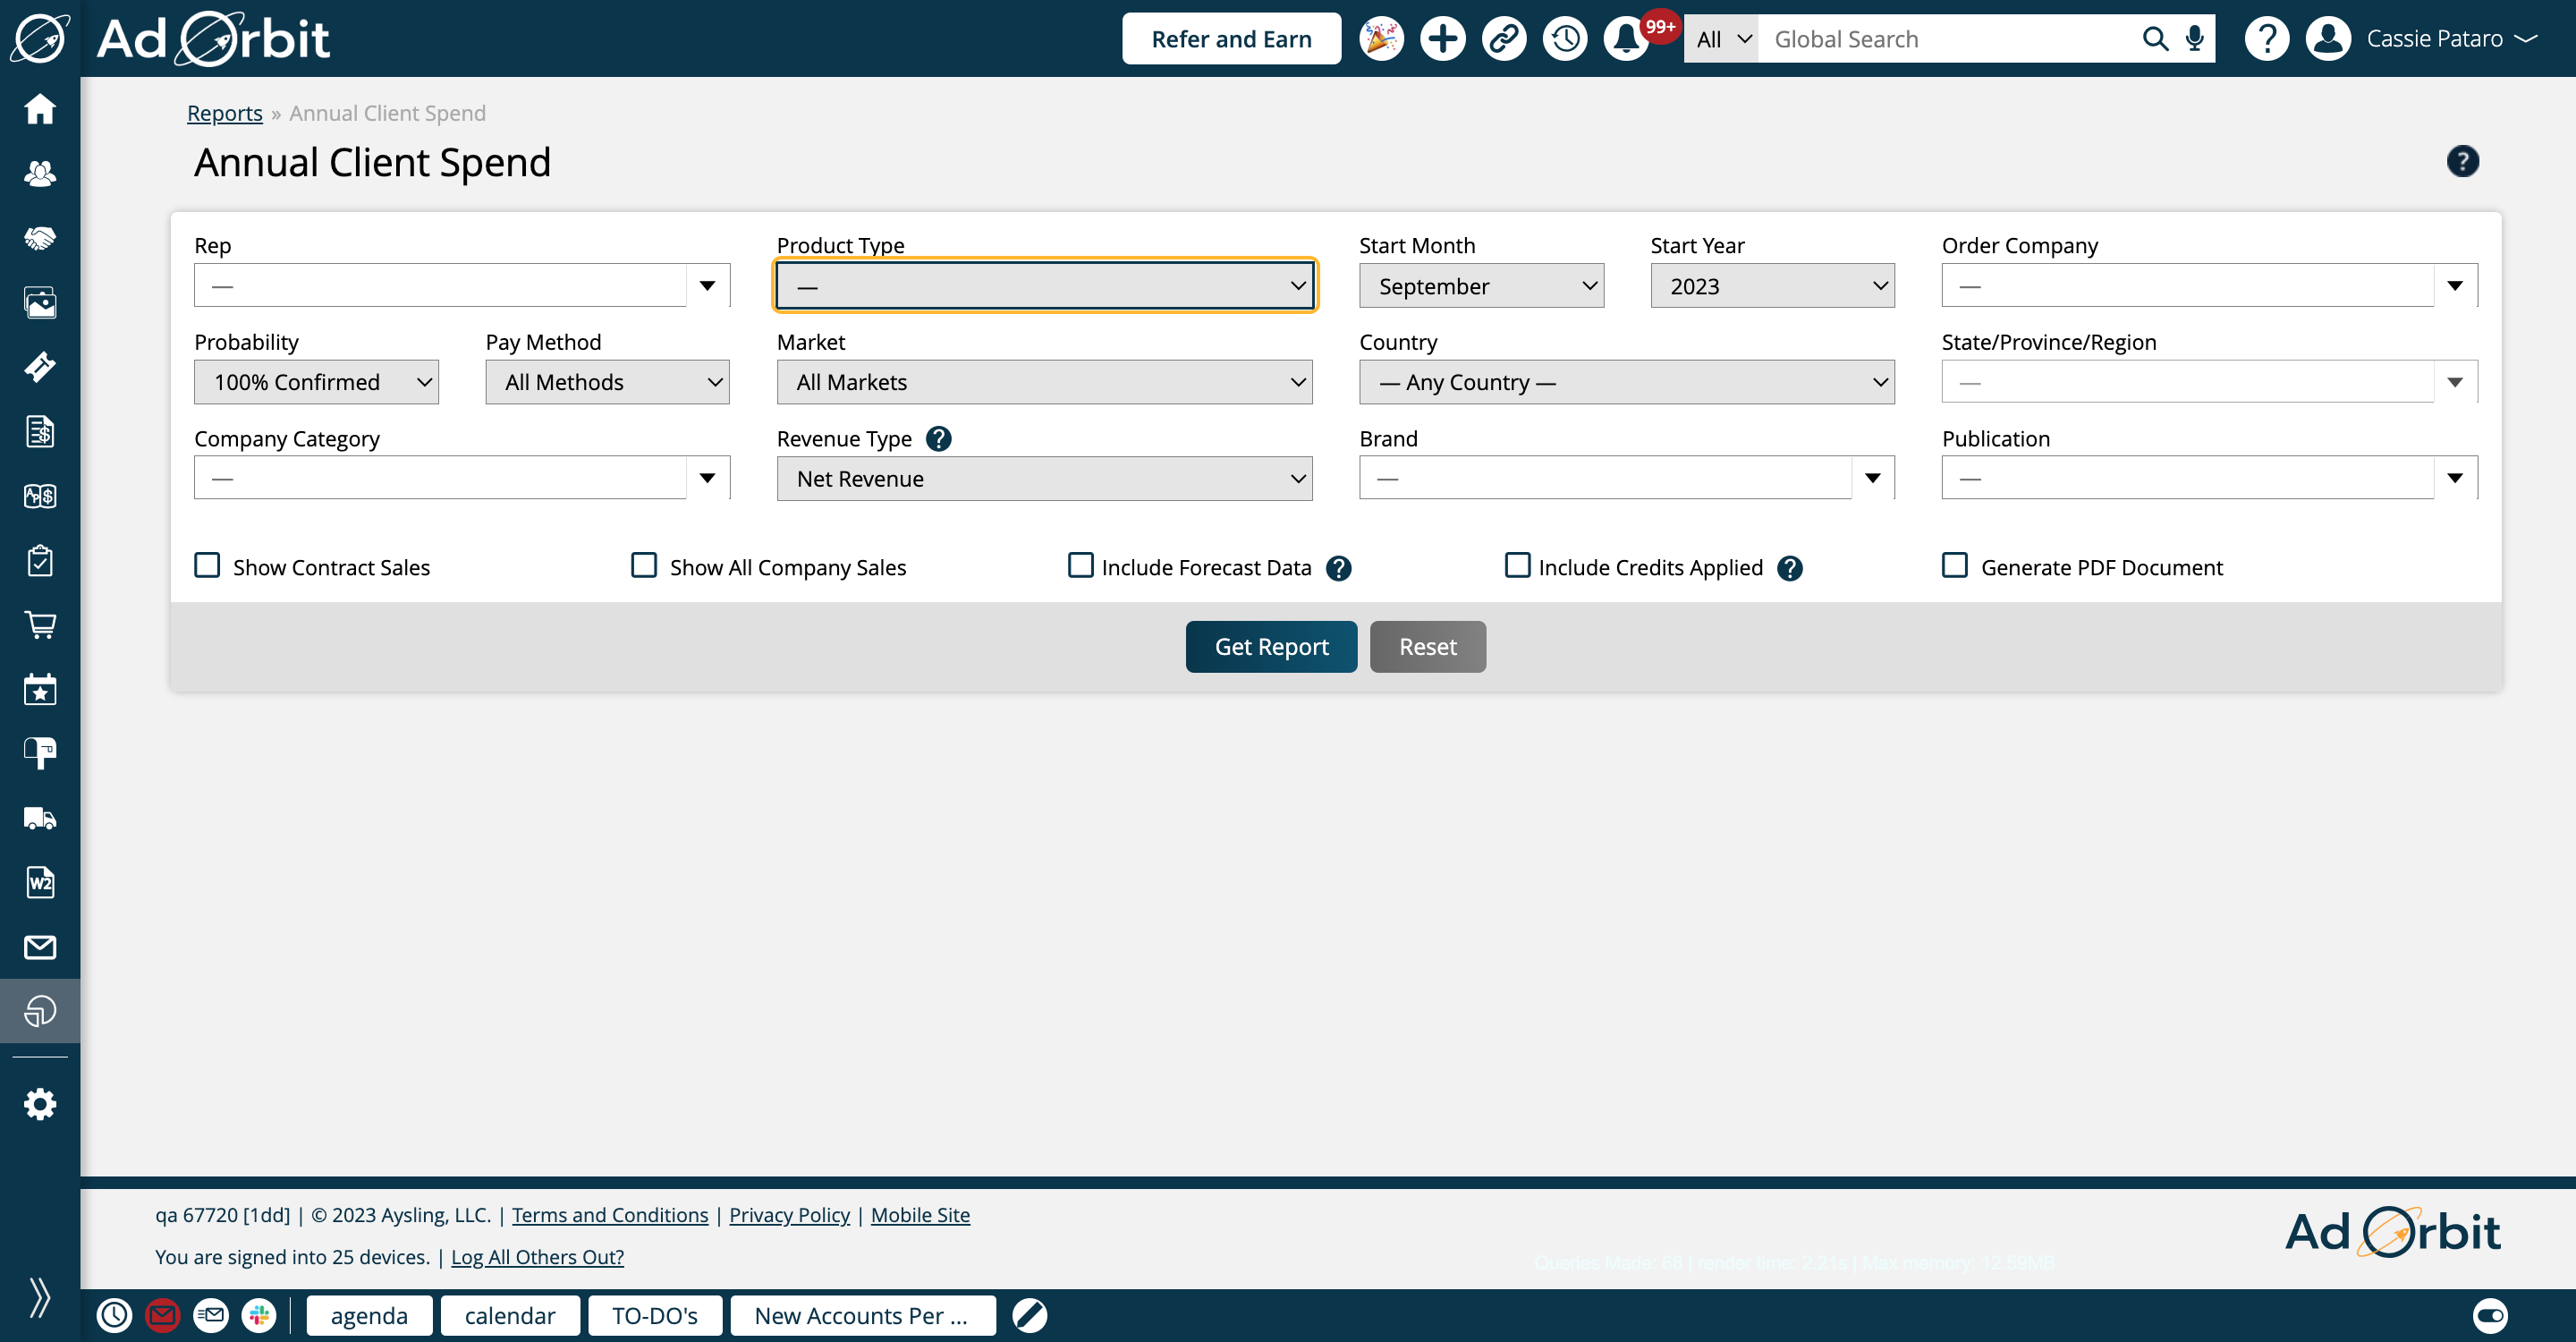
By default all Product Types will be included. Or, you can use this field to filter by Print, Digital, or Services Digital Media & Events.
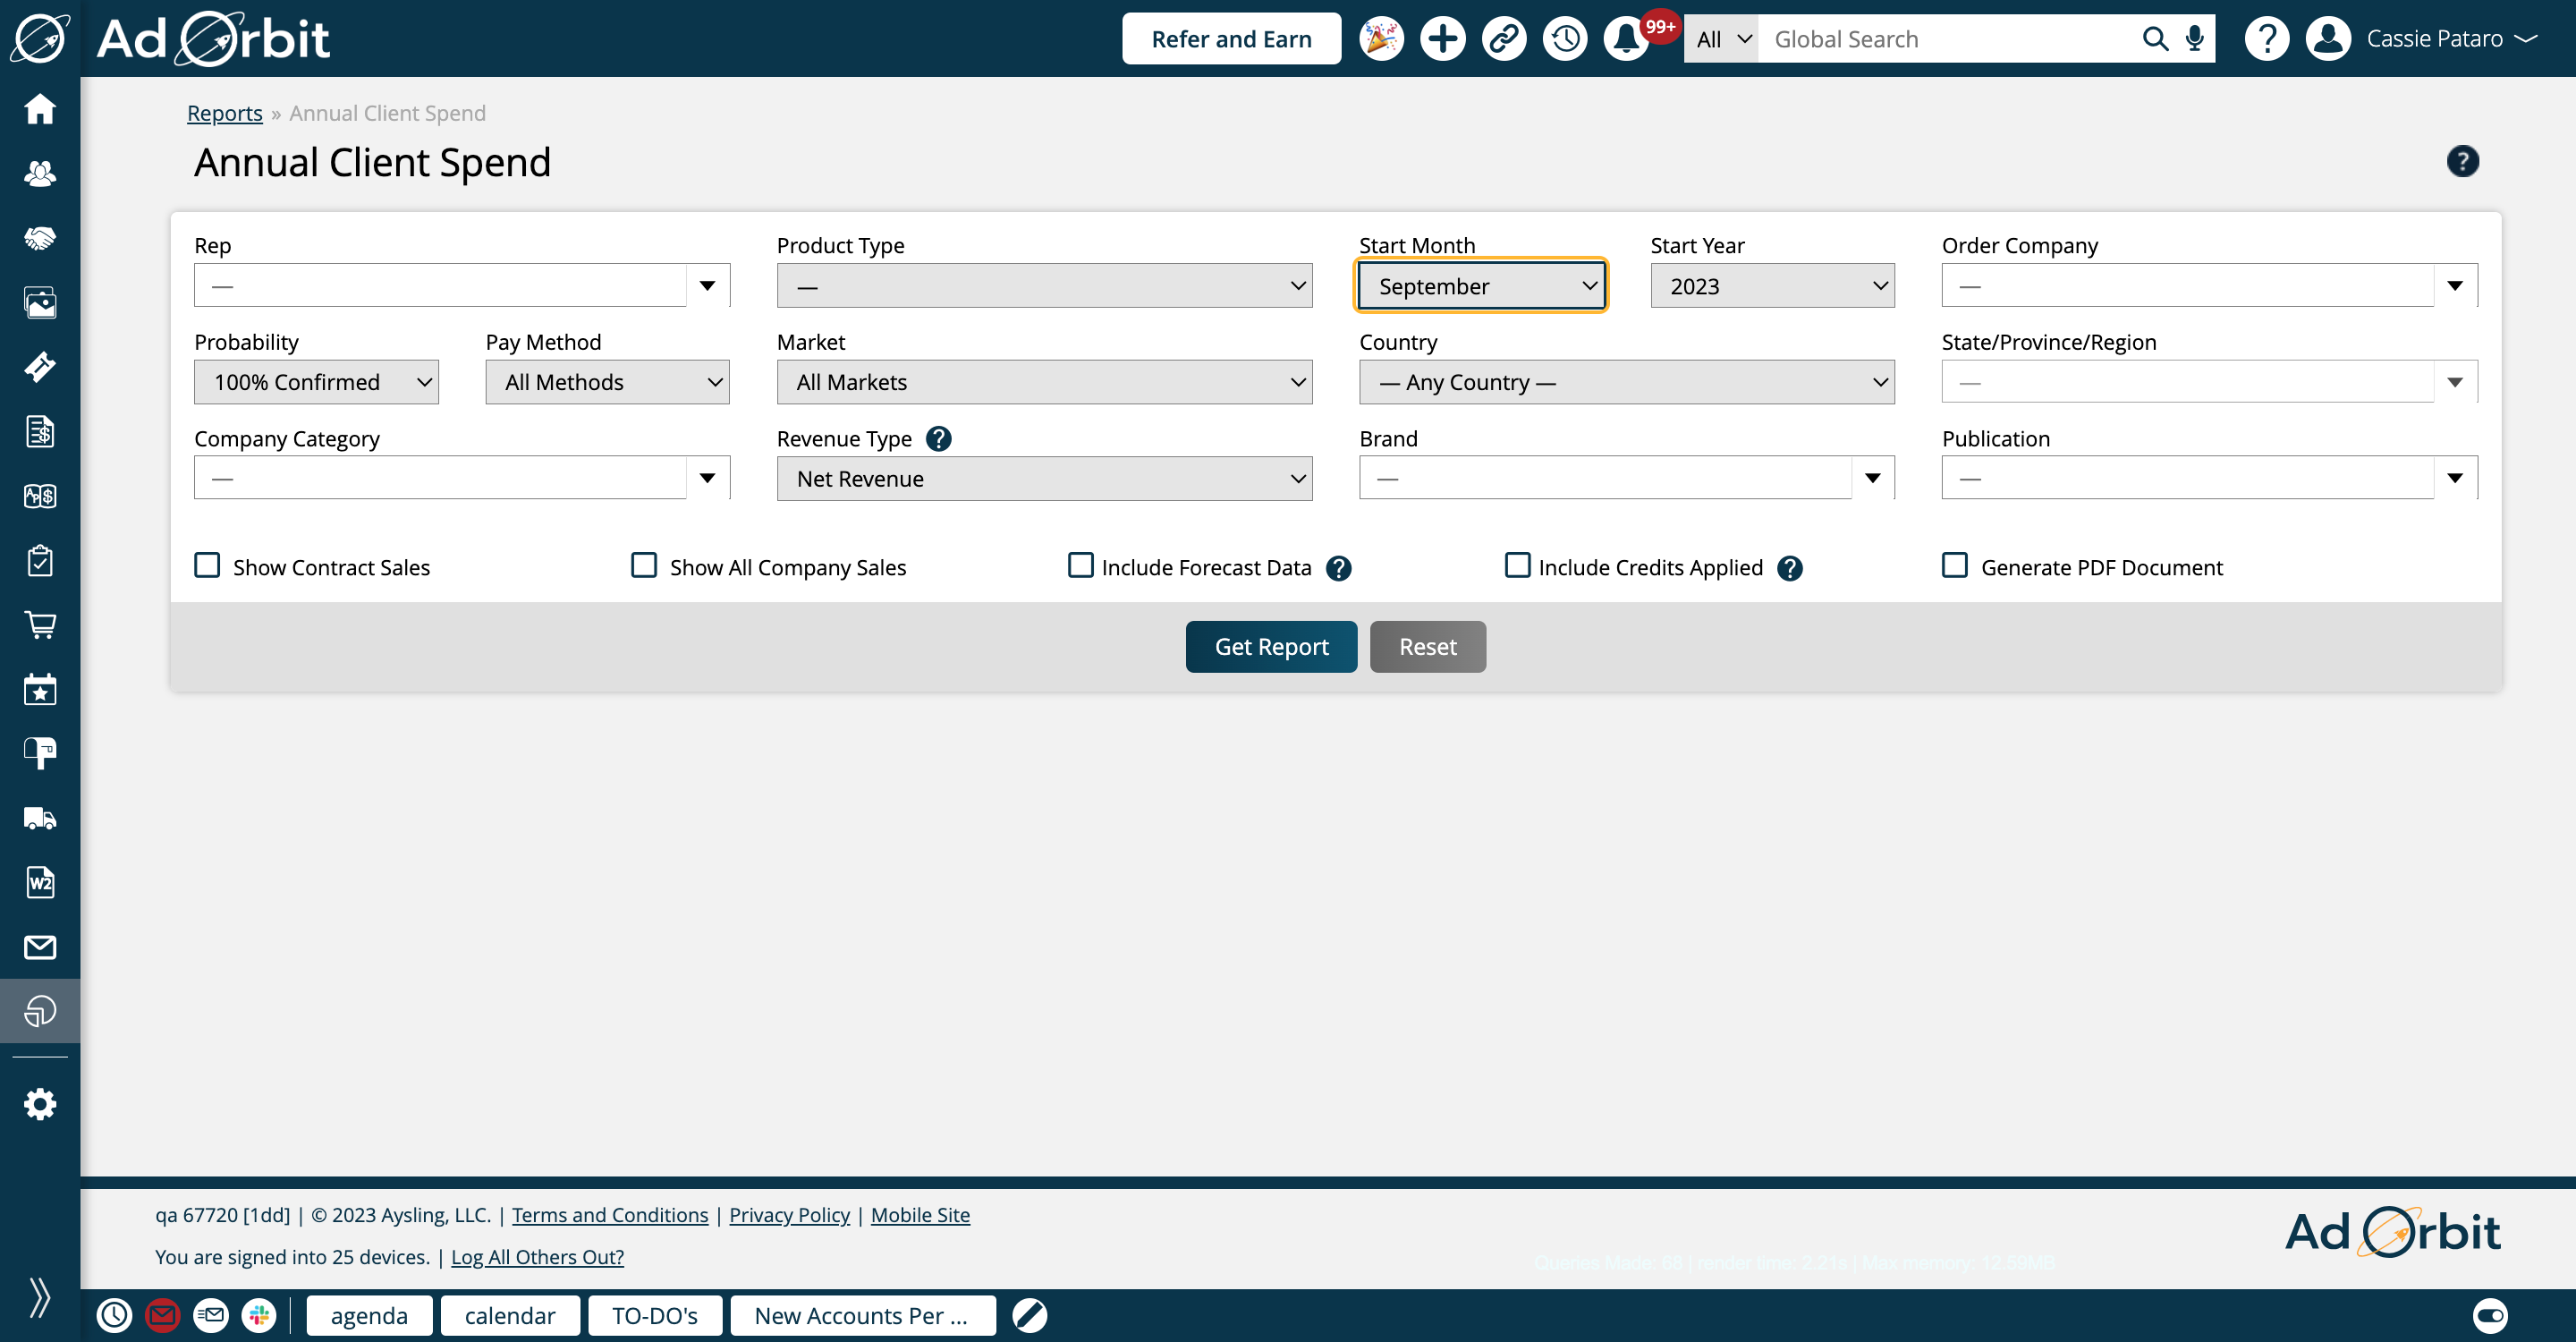
To run the report, you will need to enter a Start Month and Start Year, both of which will by default be set as the current month and year. The results will be shown for a year, starting with the dates you choose here.
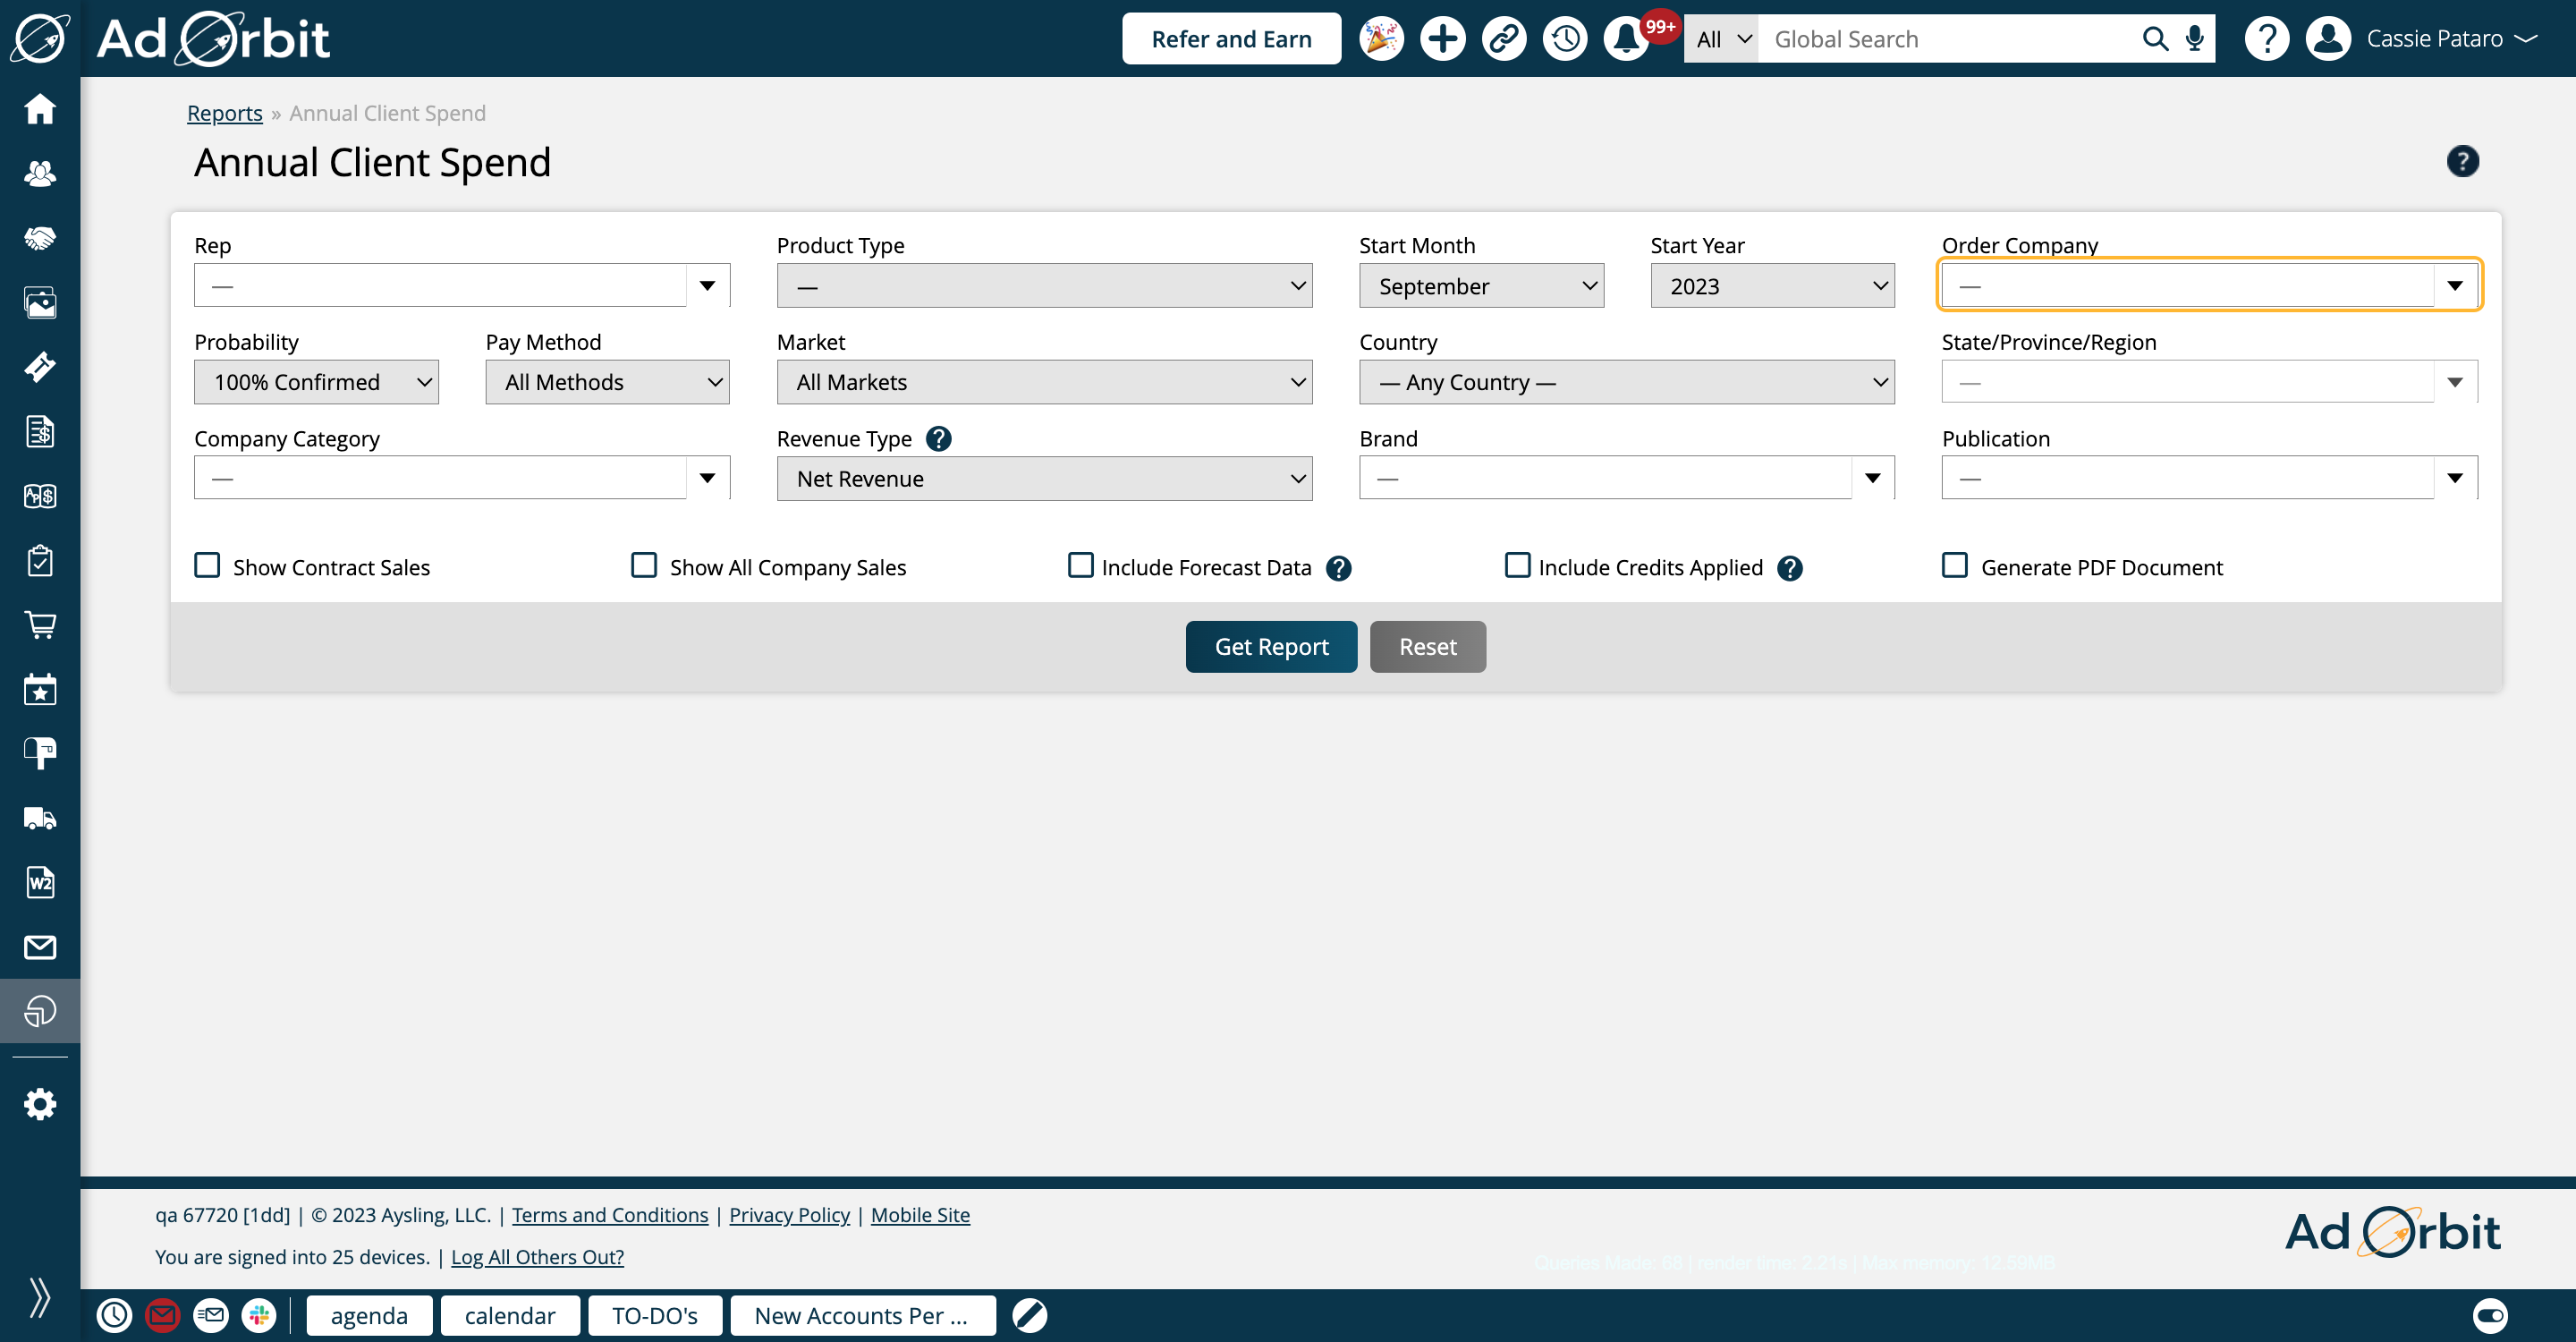
Order Company is a multi-select field and can help you find data for particular advertisers.
By default, the Probability field is set to 100%, meaning it will only find fully approved orders. If you wish to include Client Approved orders in your results, you can change this to 95% and Higher.
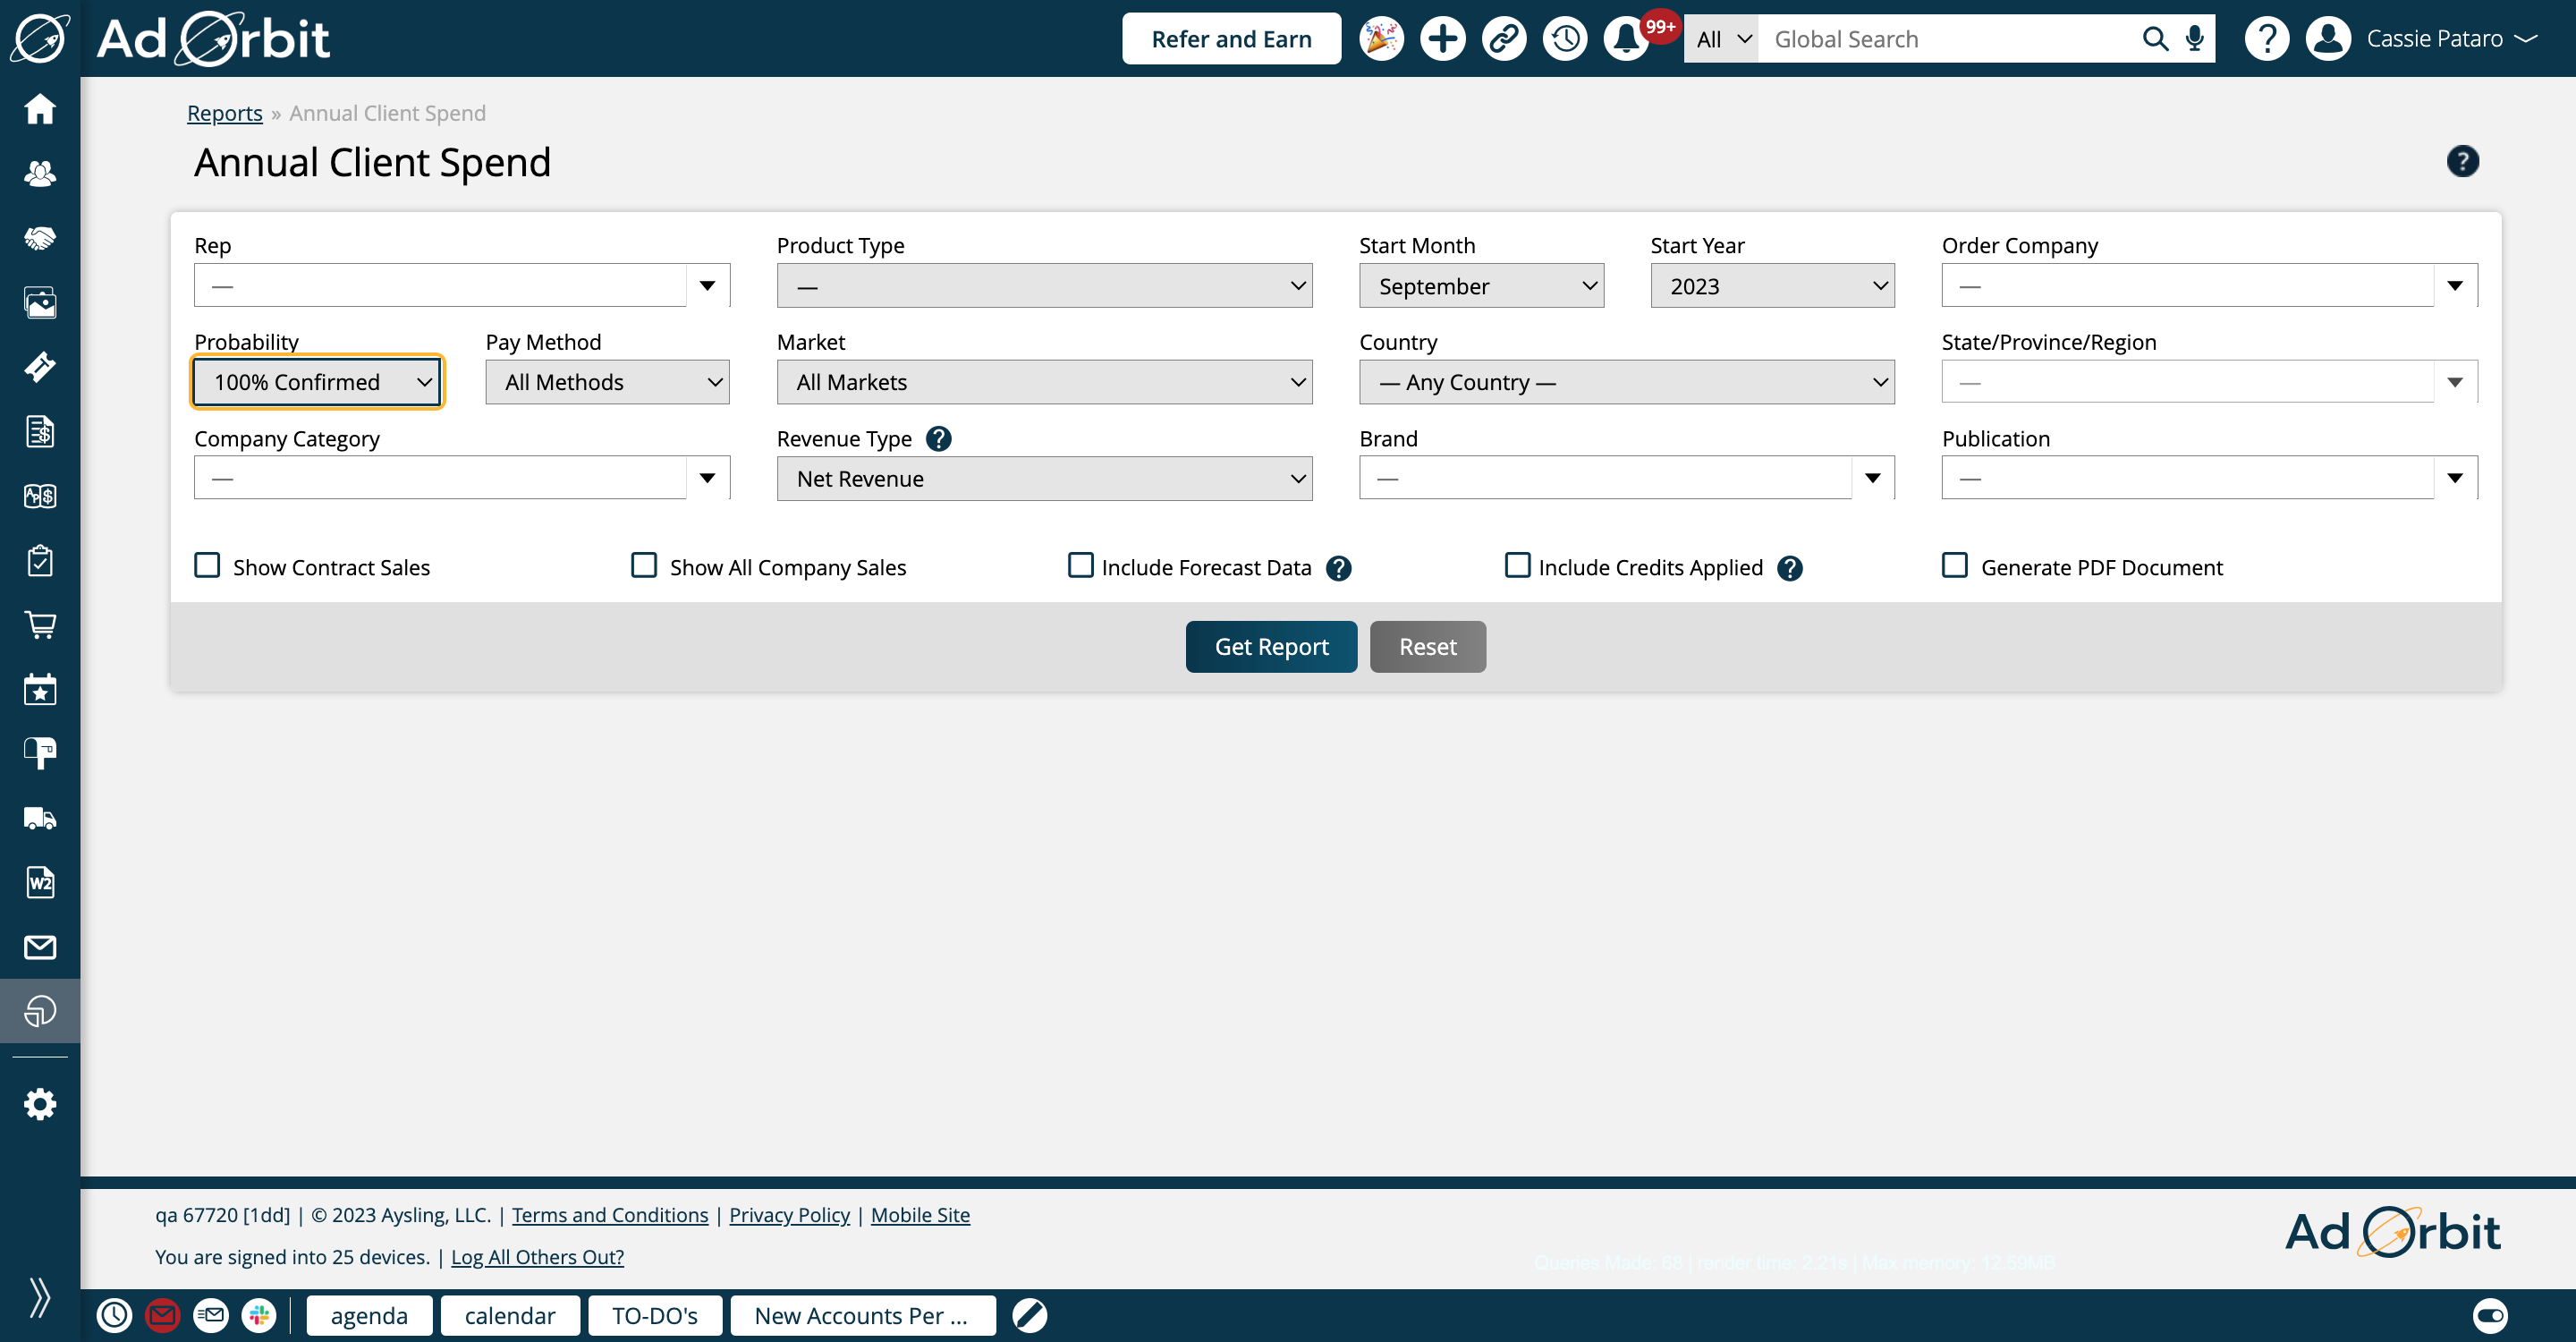
All Methods are included by default in the Pay Method field. If you wish to find data based on orders with ACH or Credit Card data tied to them, for instance, use this field.
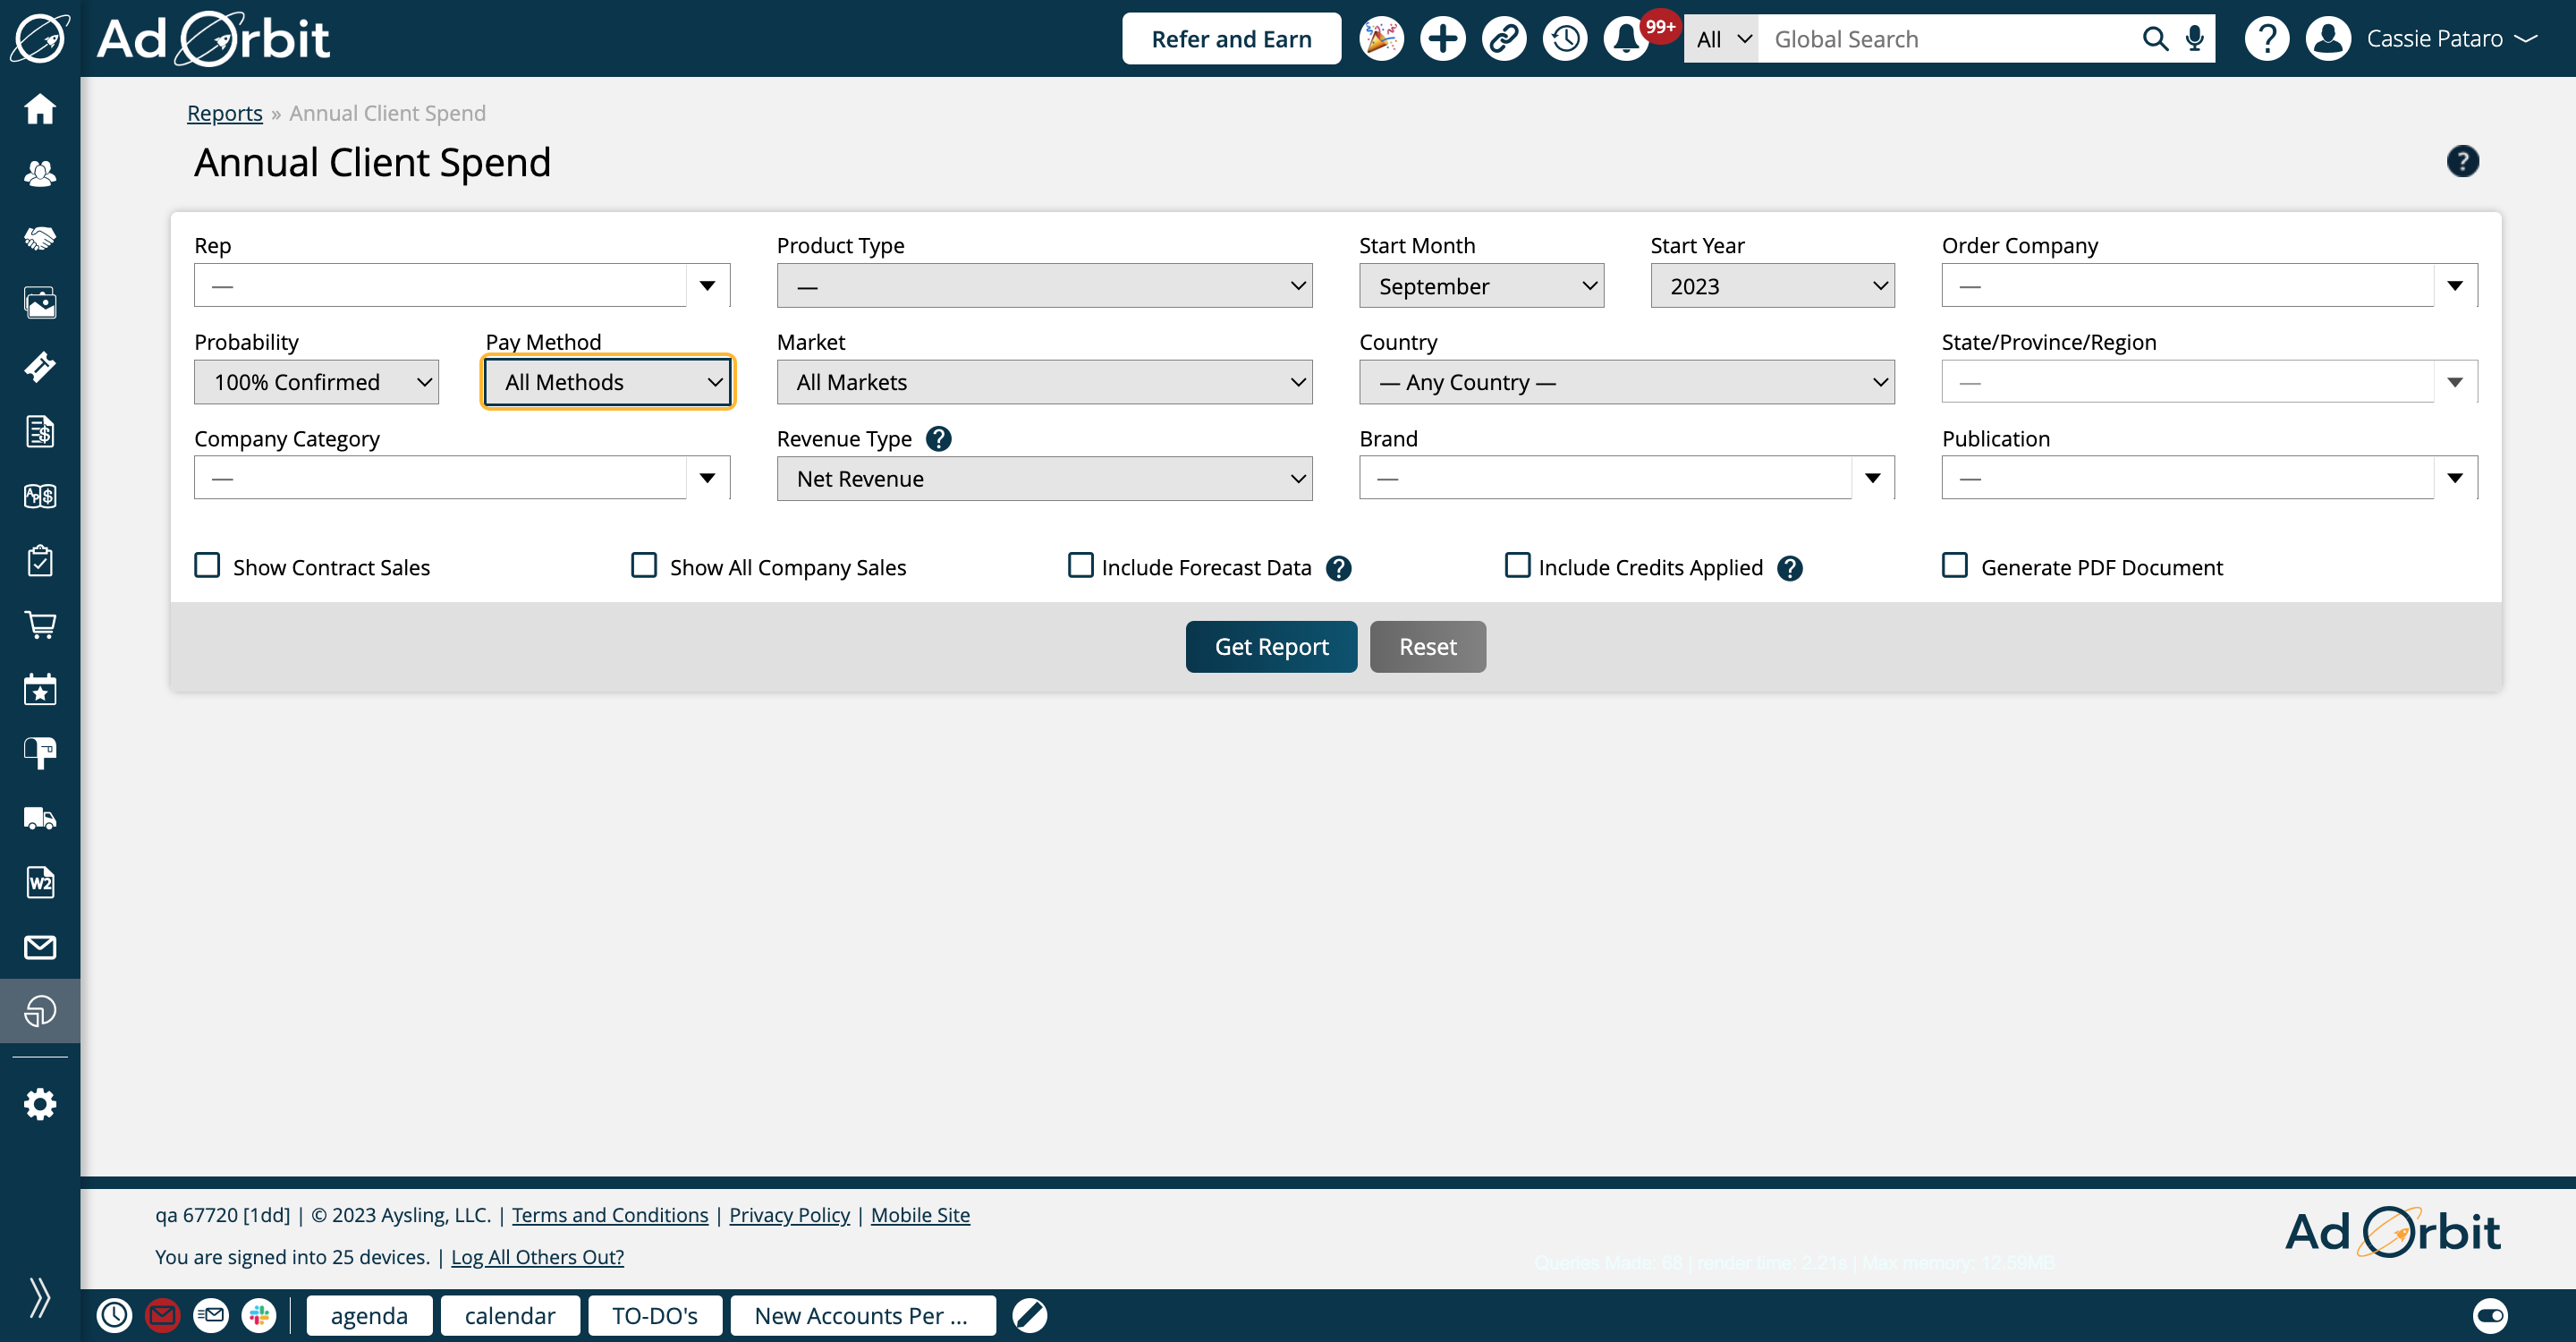
Markets allows you to find results based on the Markets you have defined in your system. By default all markets are included.

Country allows you to find results based on the addresses set on the company records. If you enter a country here, the State/Province/Region field will update to reflect the regions in that country.
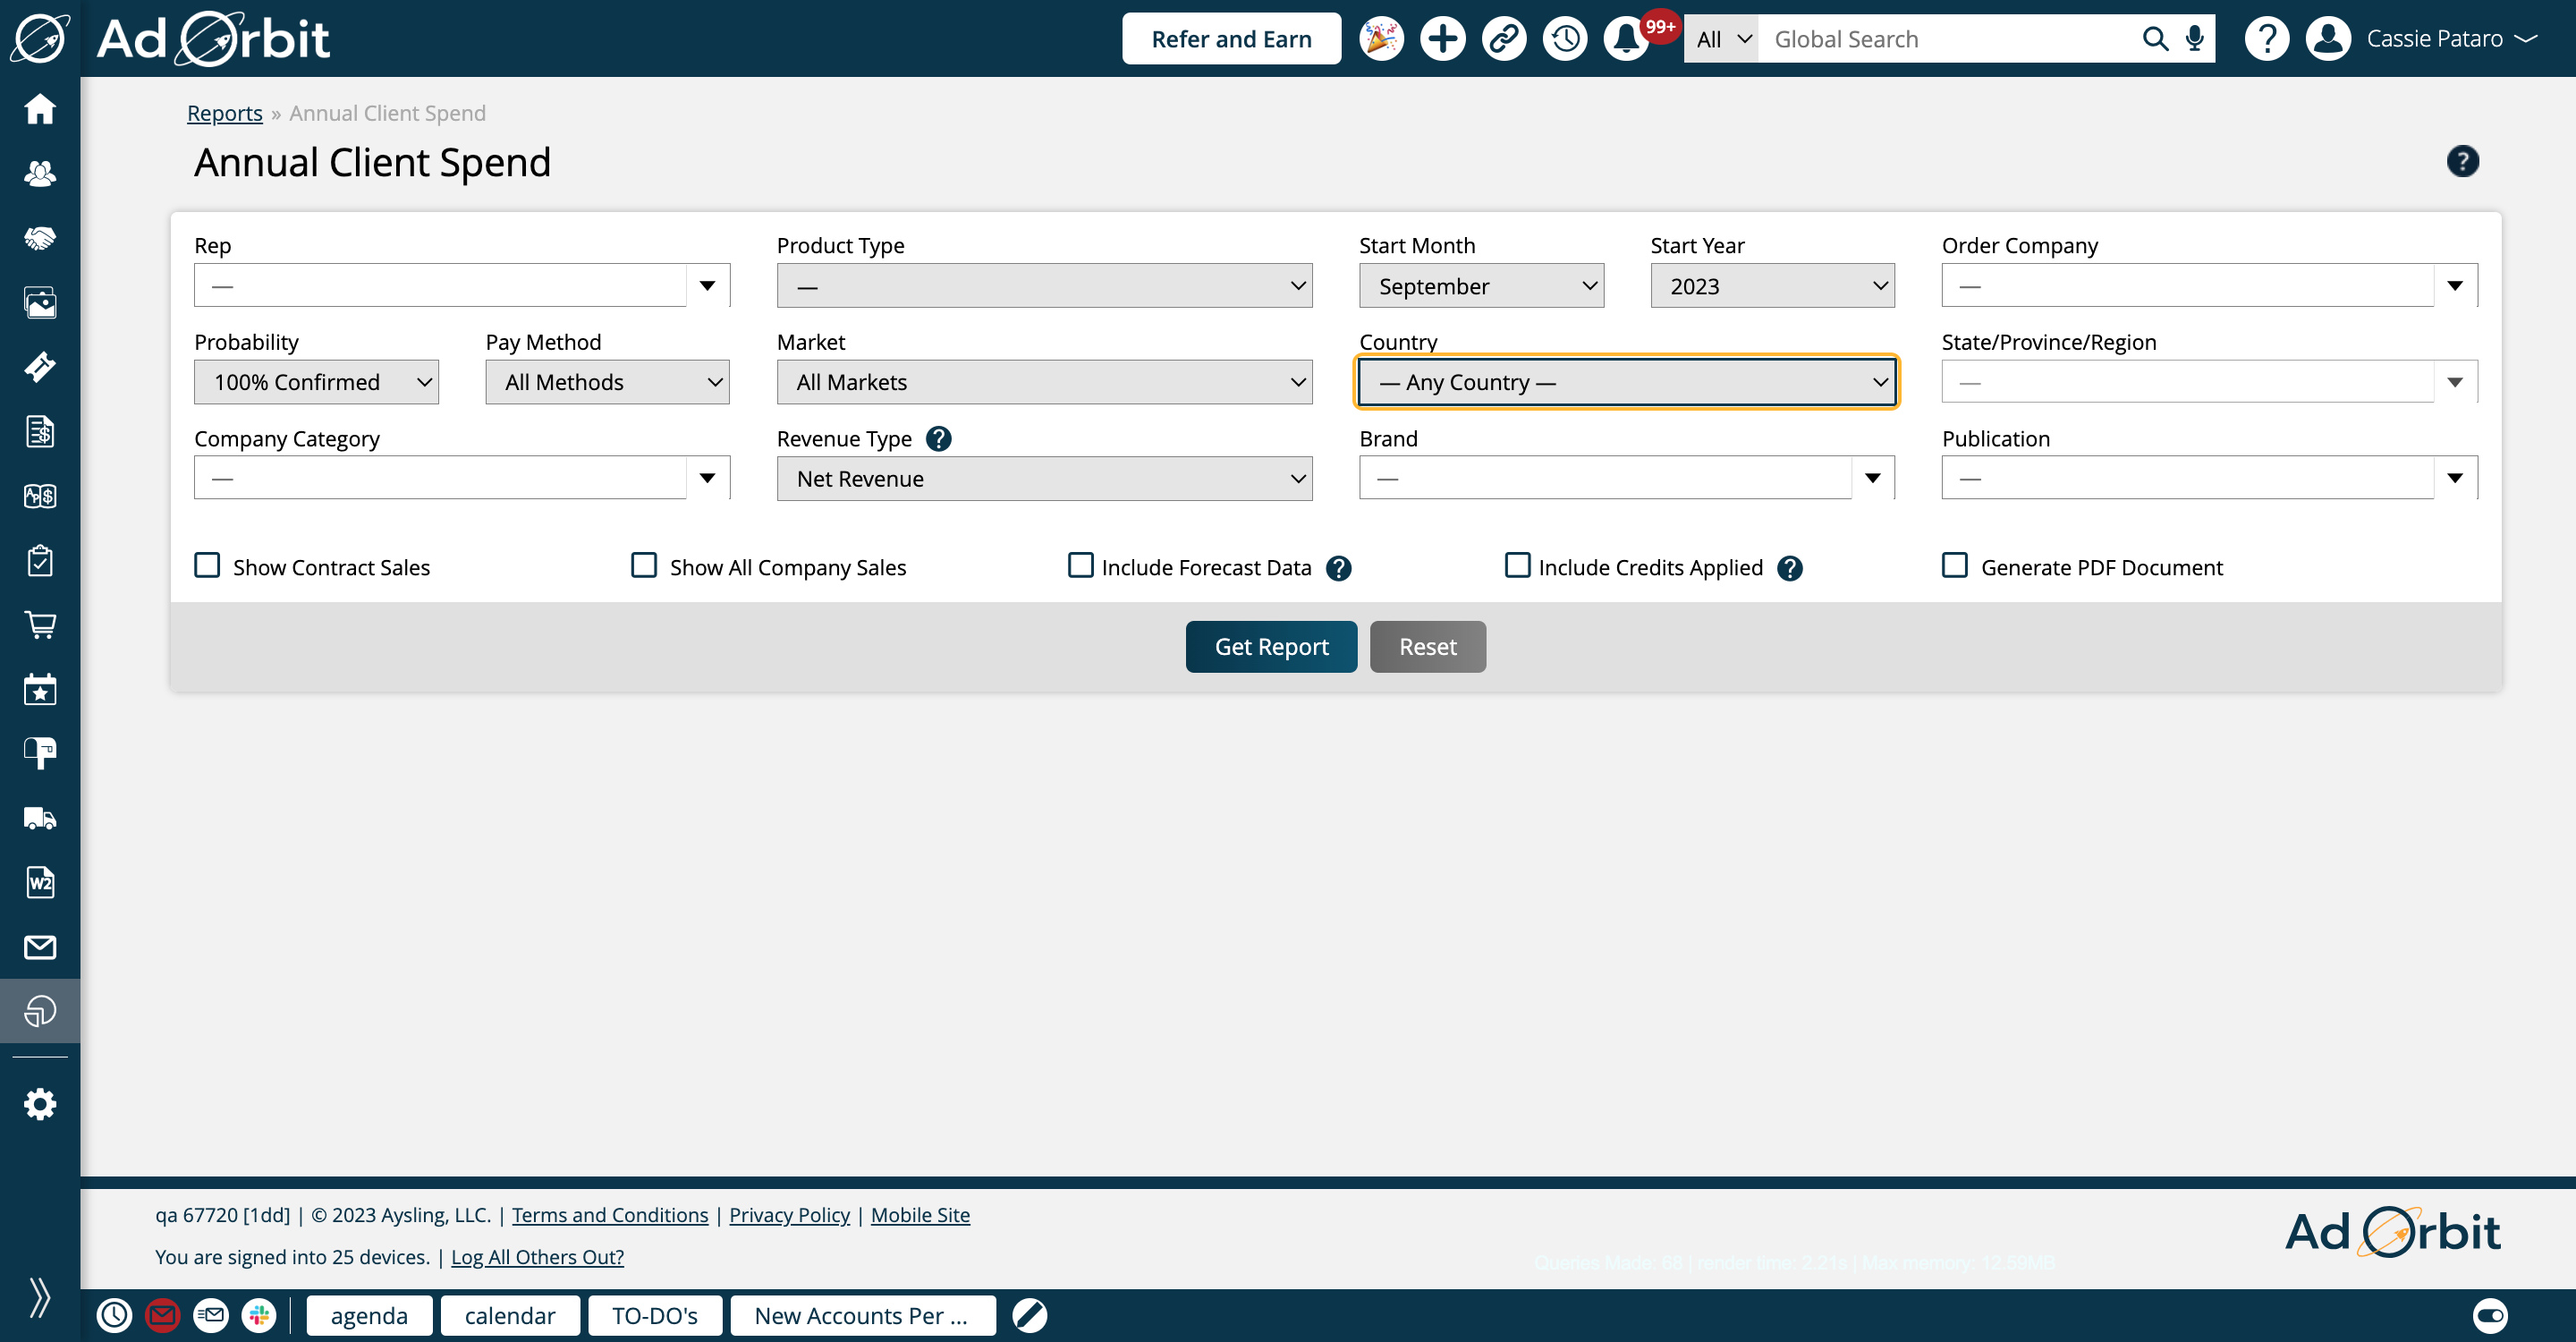
This field is only applicable if you've selected a country. If a country is chosen, this field will show the regions associated with that country.
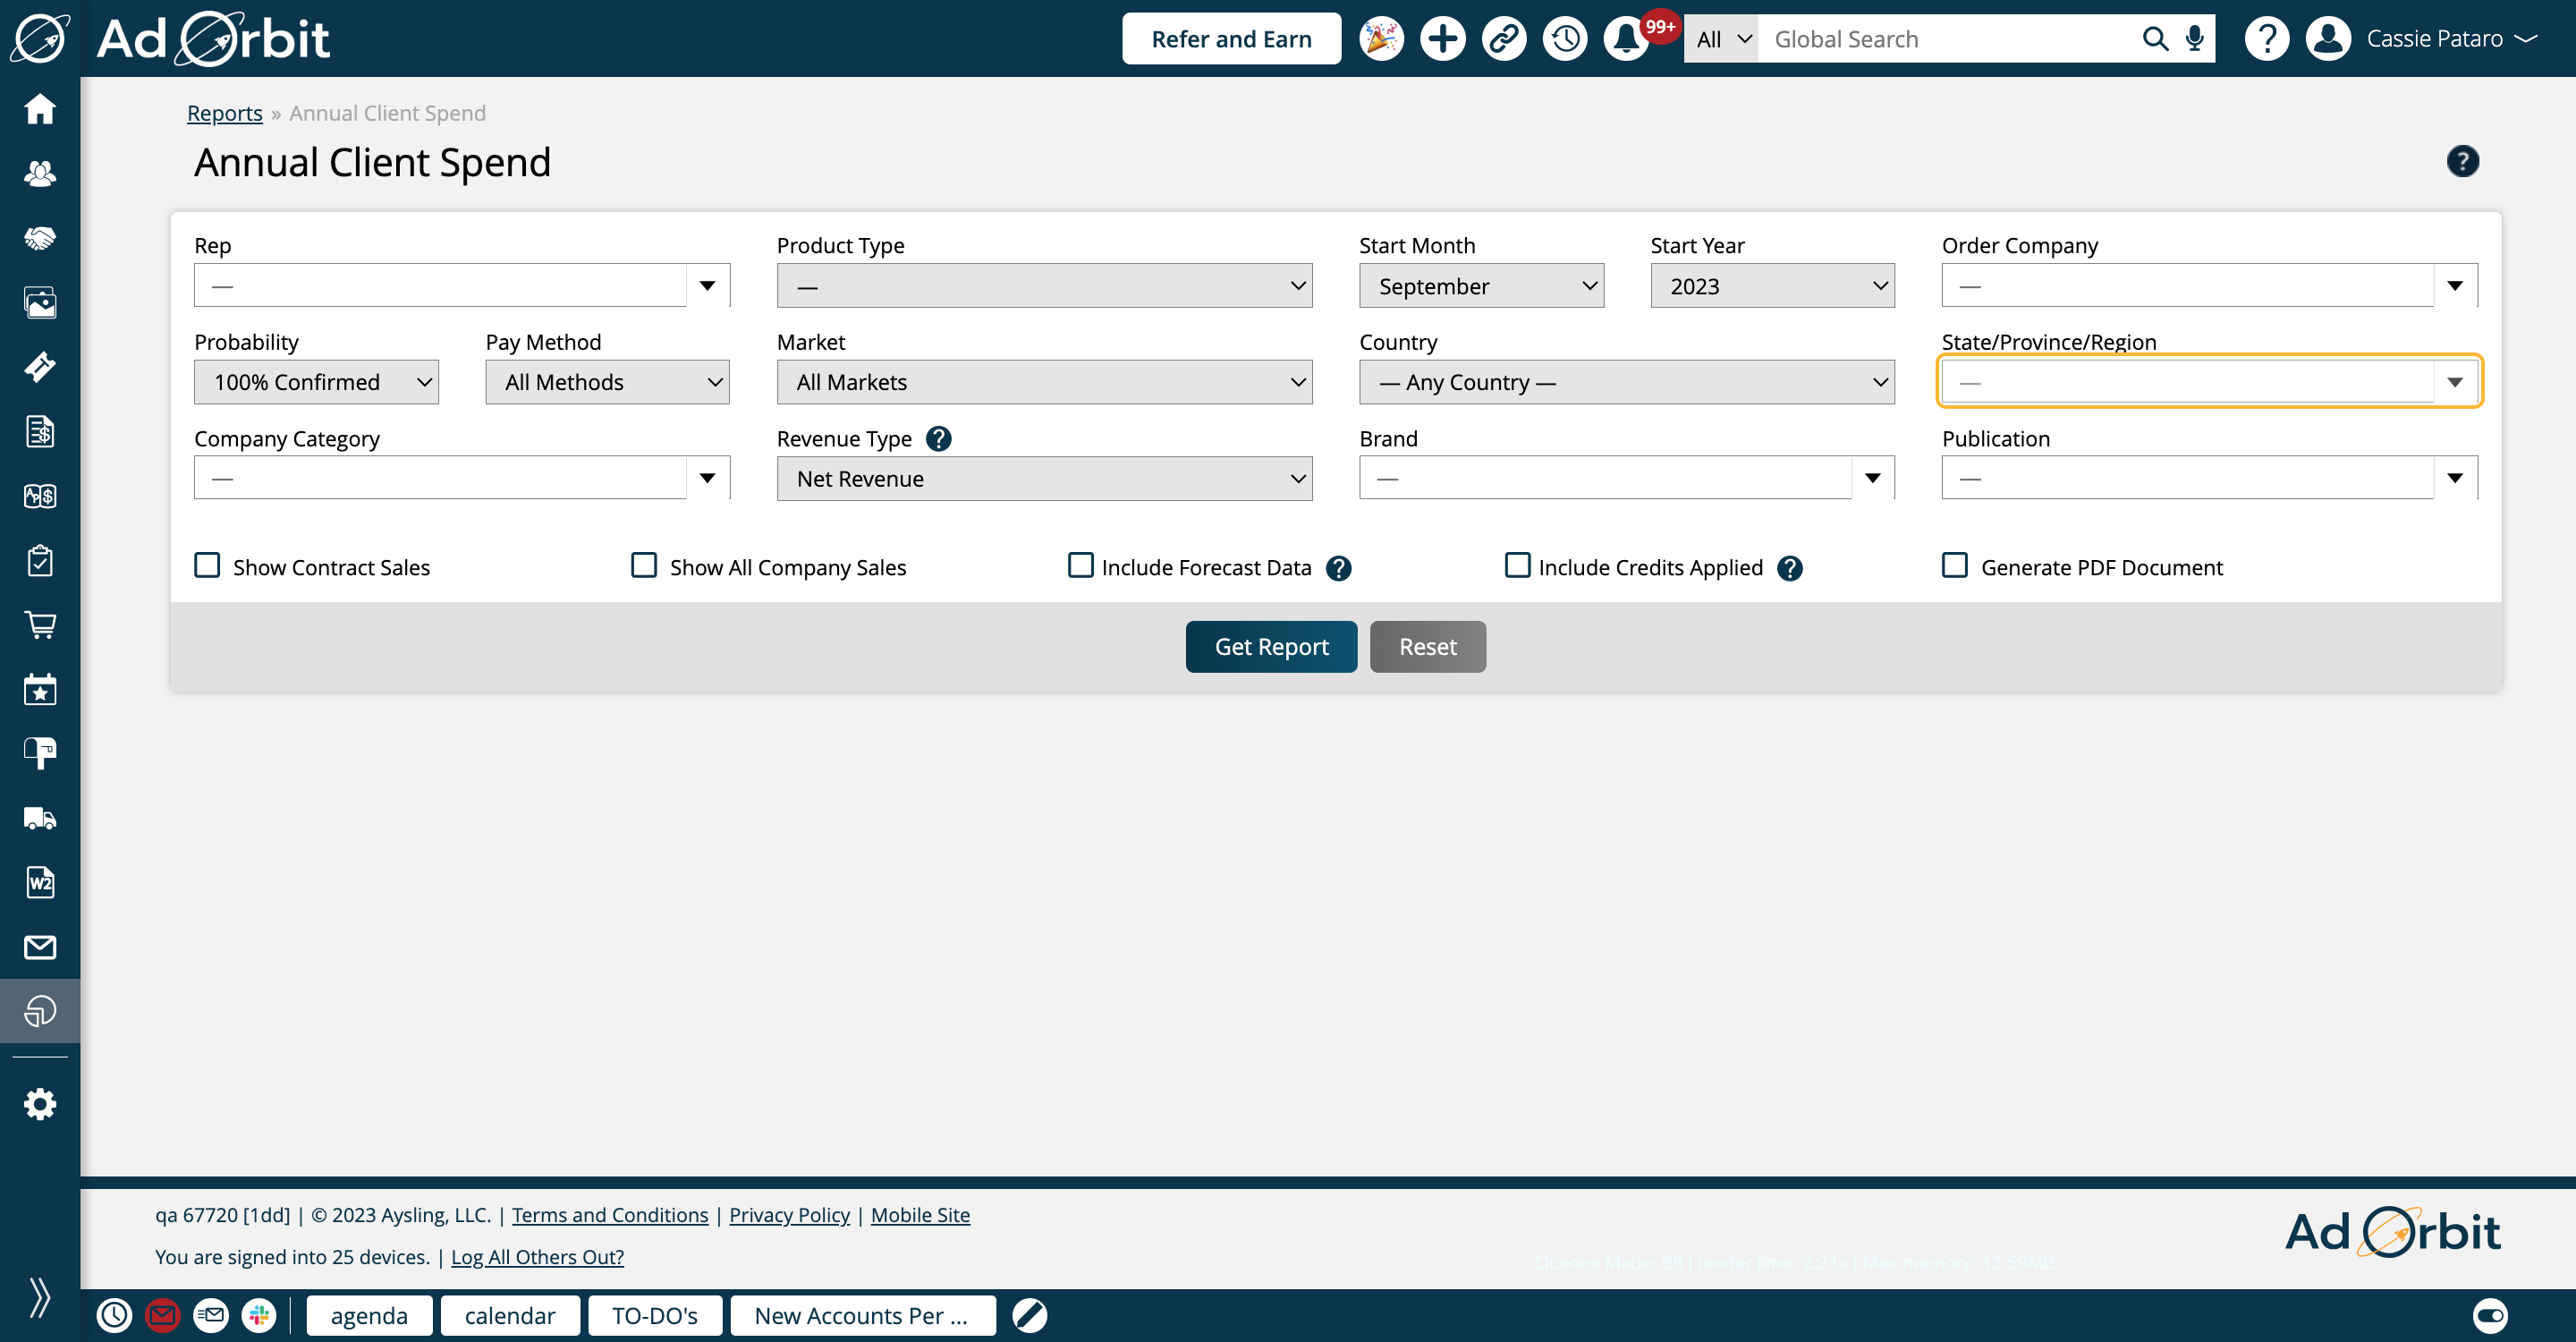
Company Category allows you to find results based on the Primary and Secondary categories set on each company.
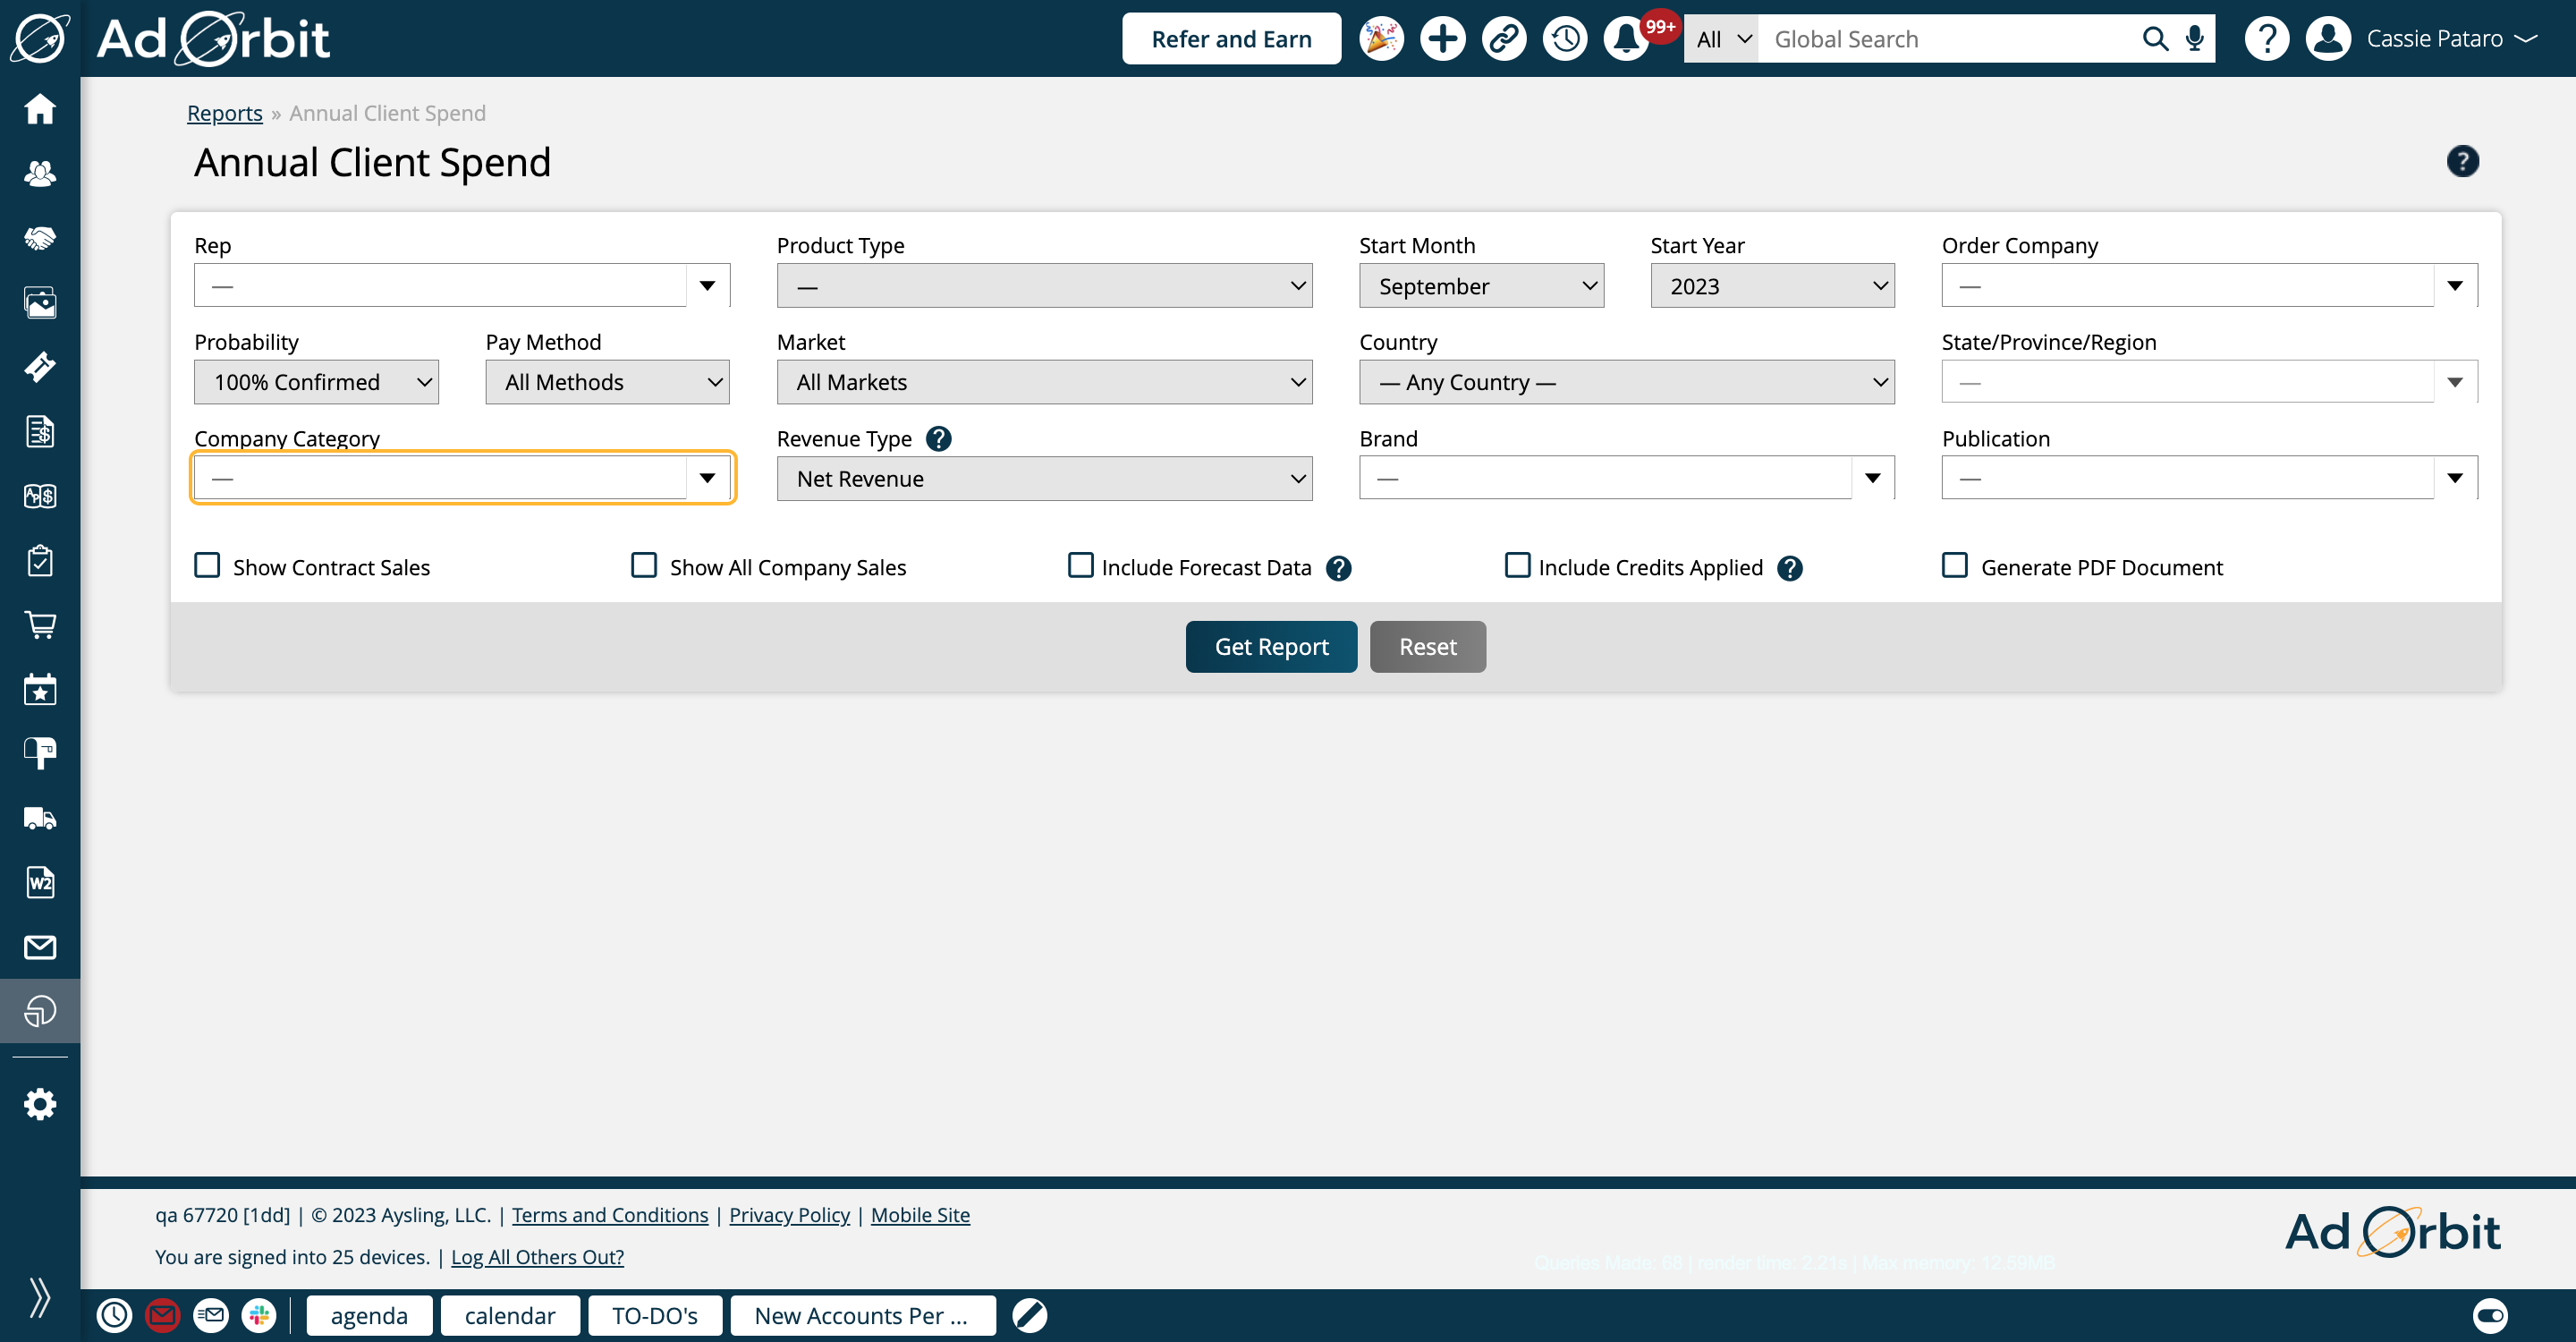
The Revenue Type field is set to Net Revenue by default, which is the cash amount, minus any barter. If you'd like to see all revenue (cash and barter), you can change this field to Total Revenue. Or, you can also view only barter sales by setting this to Barter/Trade Sales.
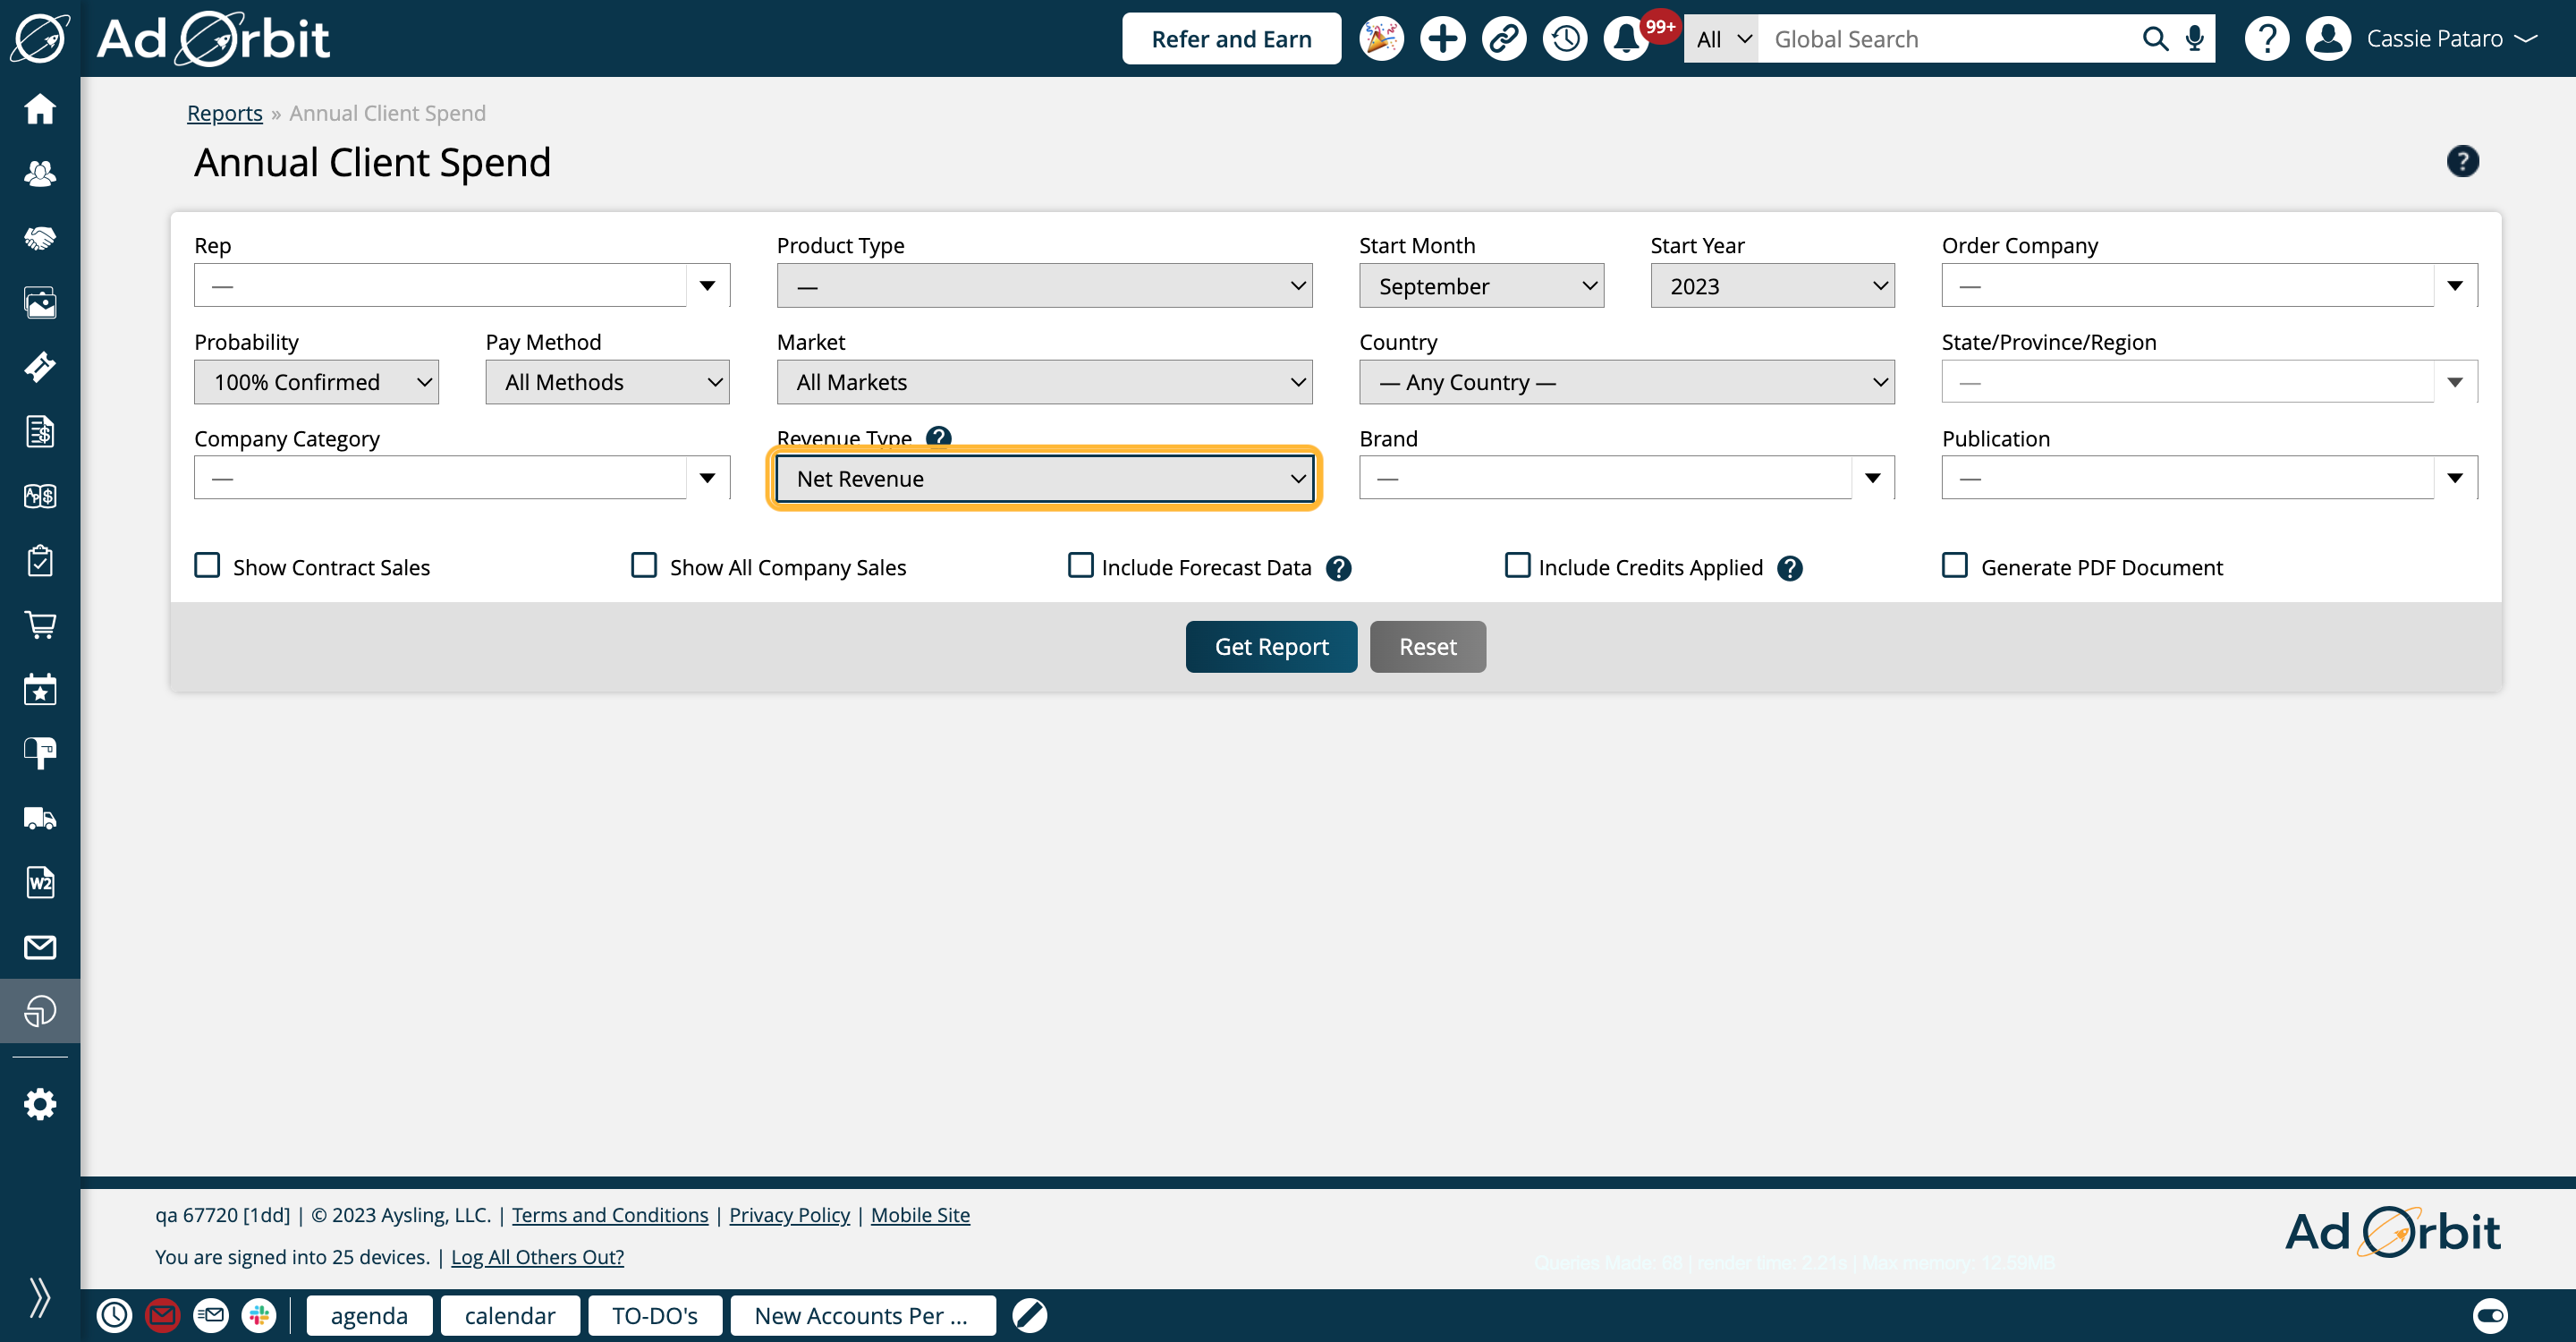
The Brand filter finds results based on the publication the sale is for. For instance, if Publication A and Publication B are tied to Brand A, when you filter by Brand A, it will find all sale items for Publication A and Publication B.
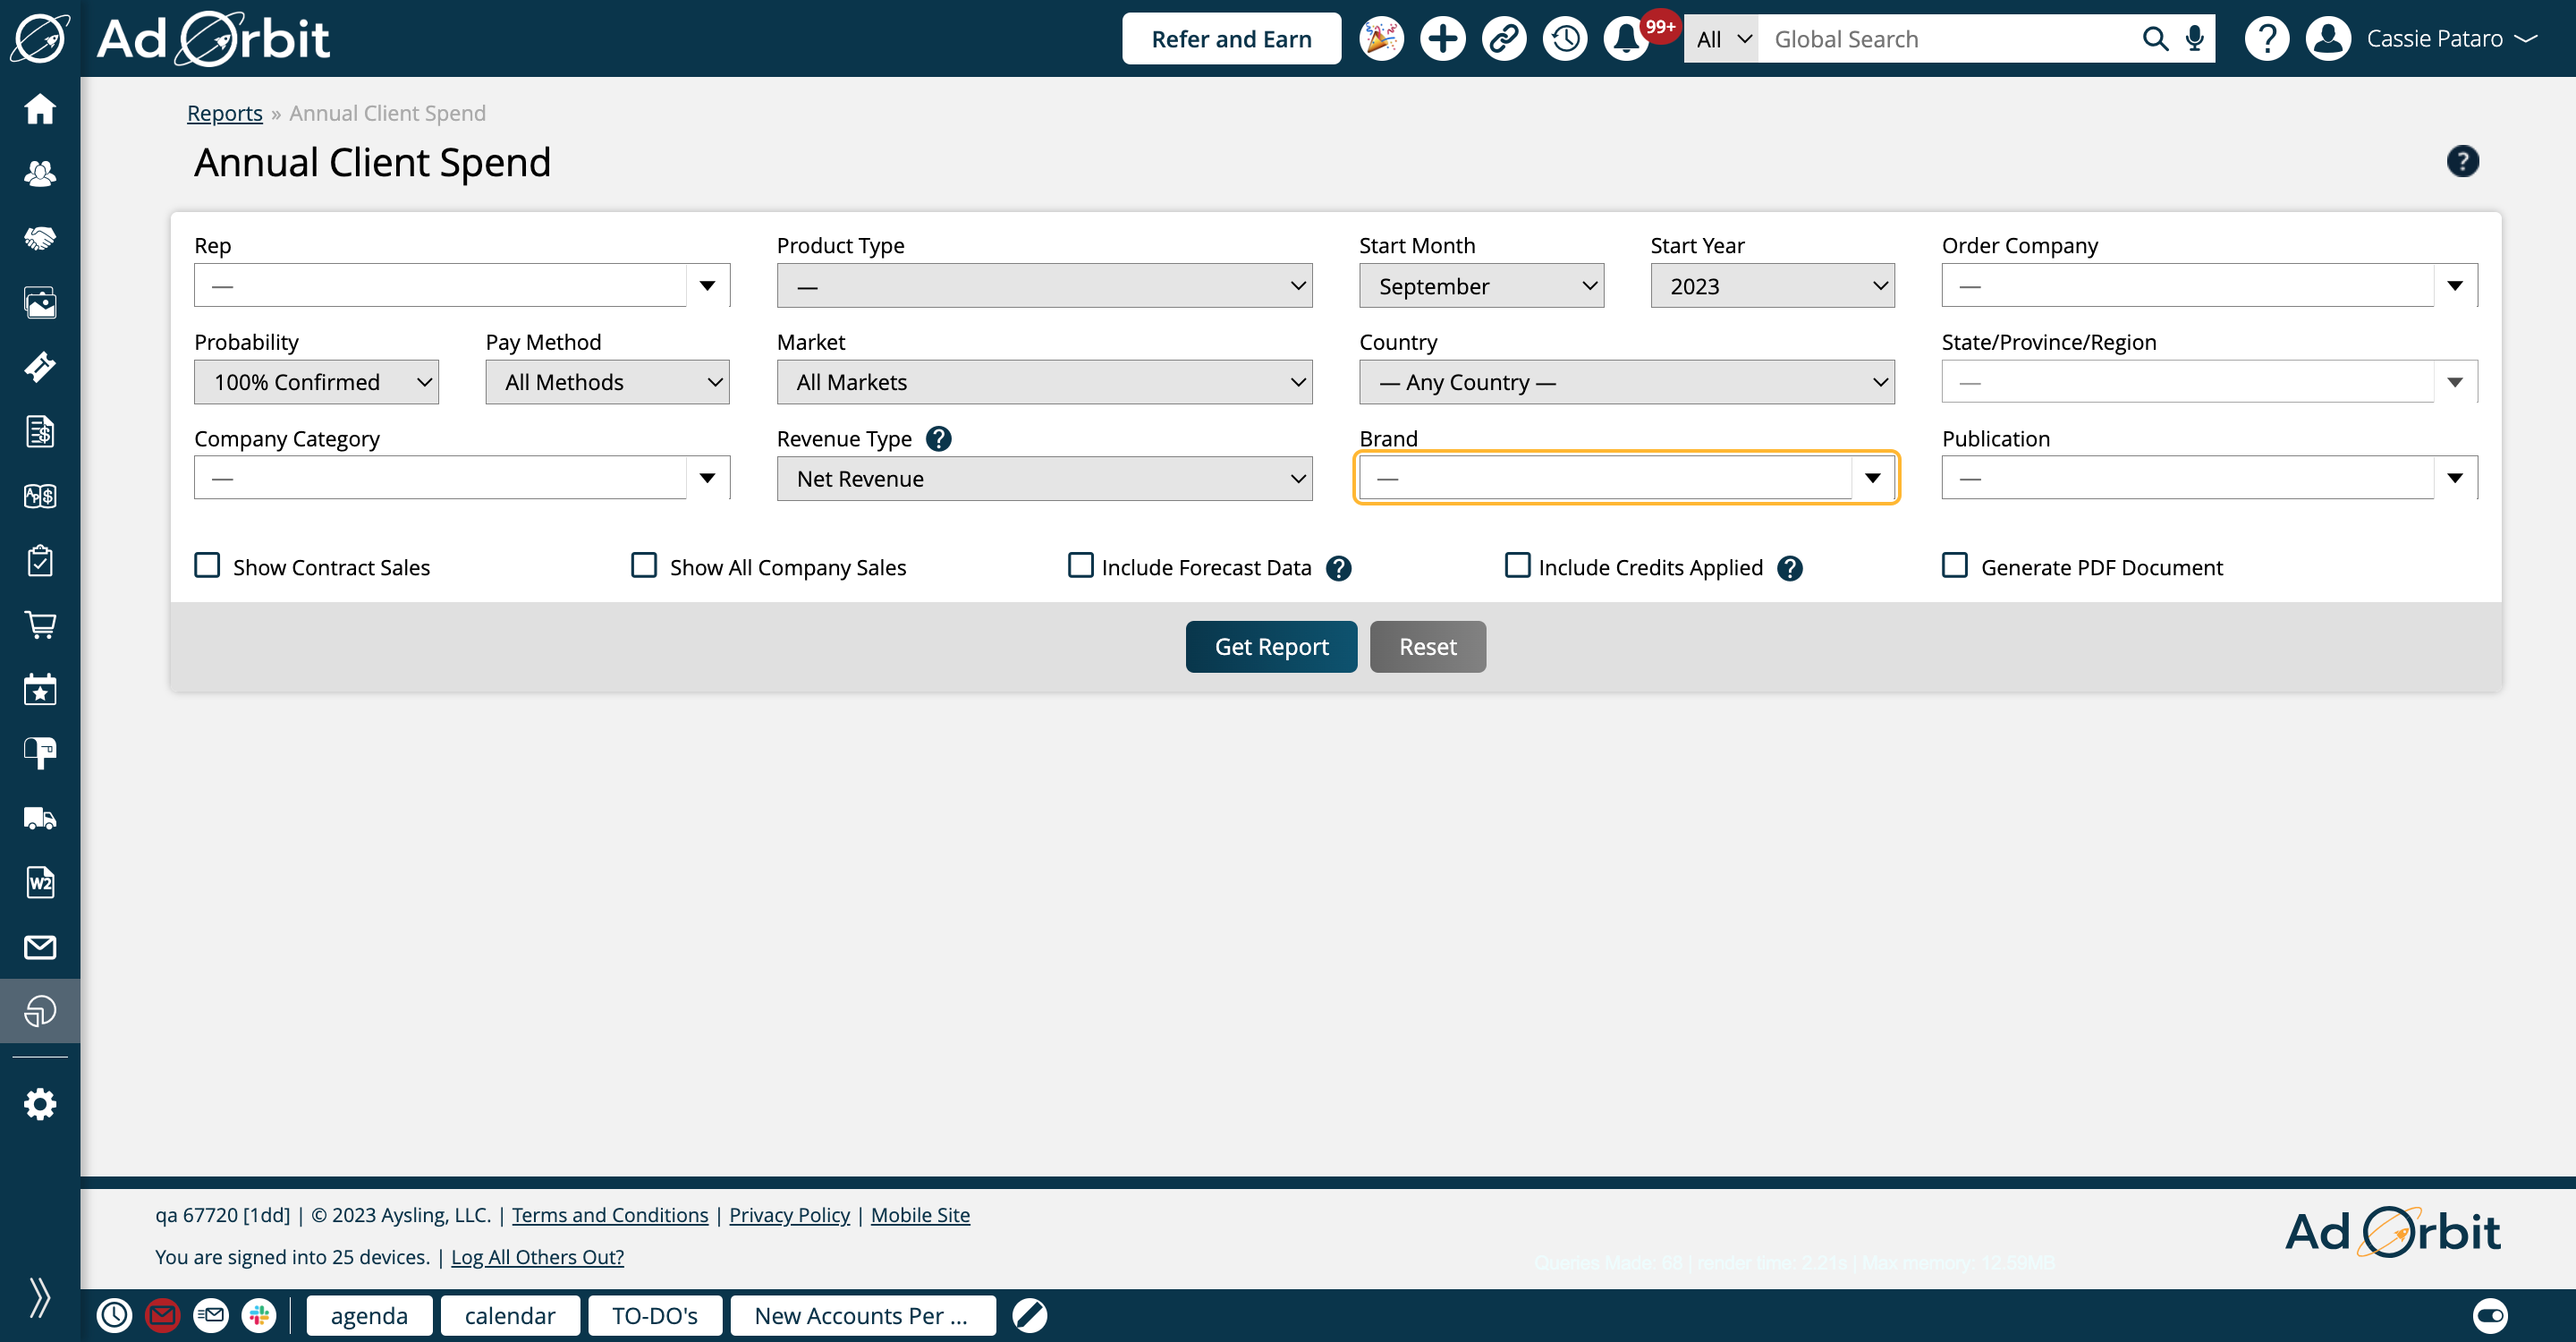
The Publication filter will find all sale items associated with the selected publications.
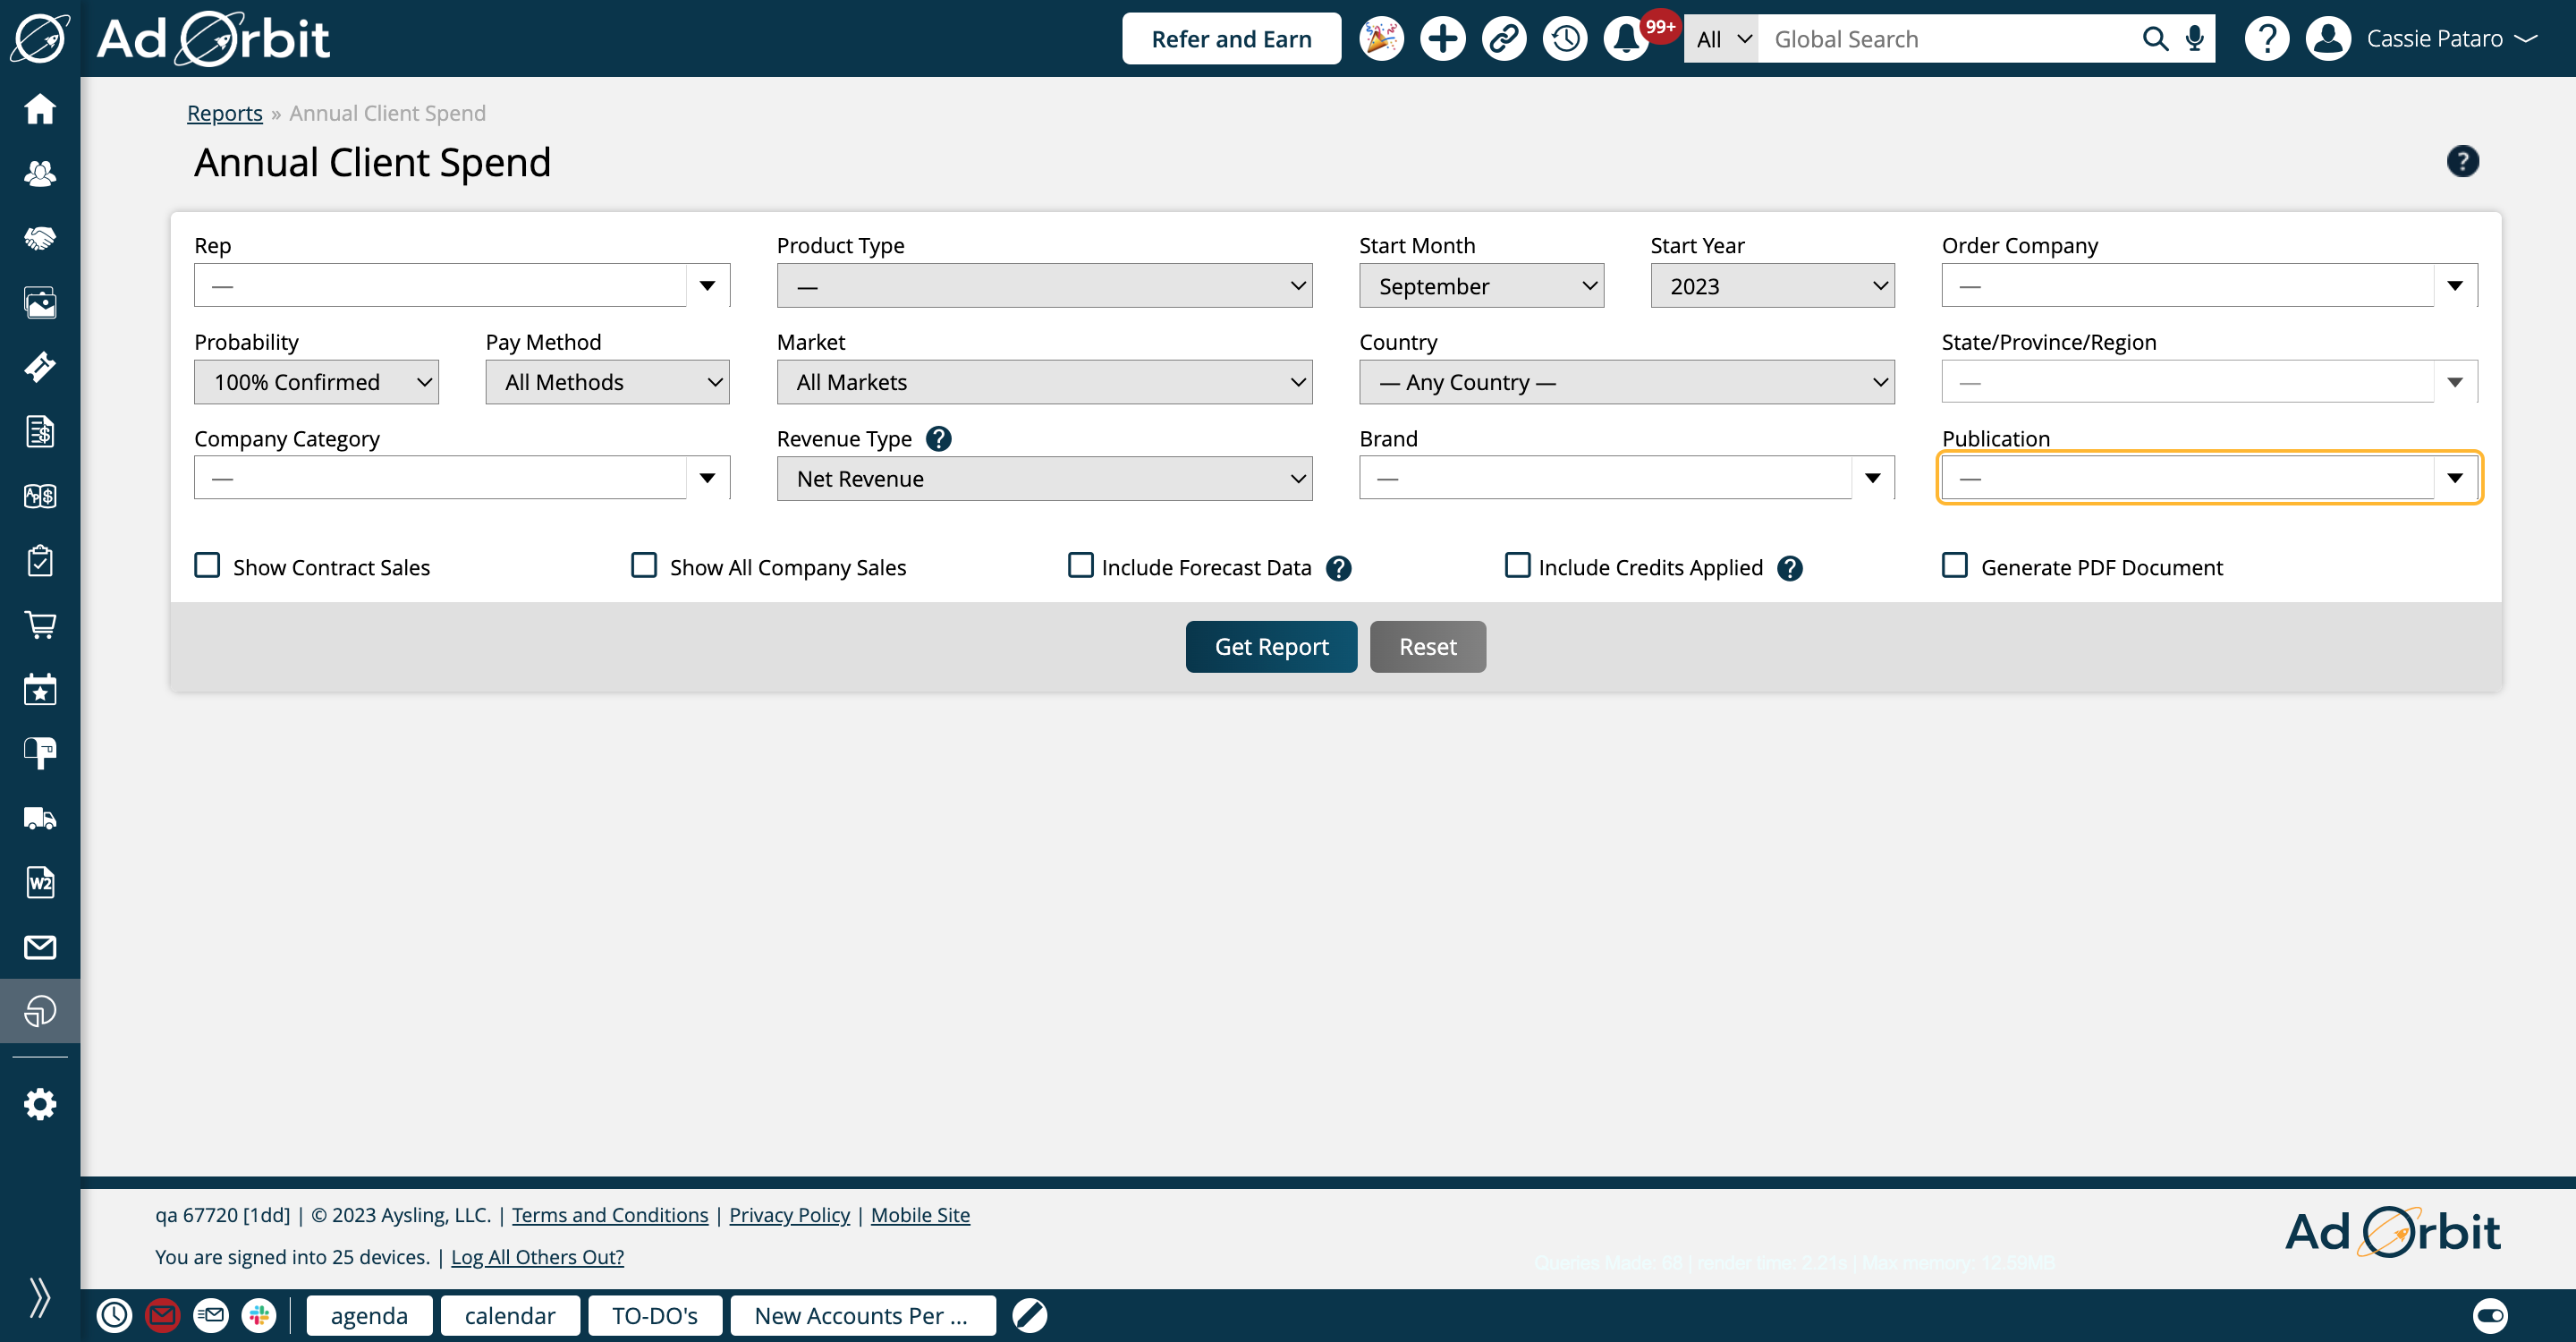
Additional Order Details allows you to restrict your results to only include sales line items that are associated with orders that have the relevant order dynamic attribute values specified in this filter.
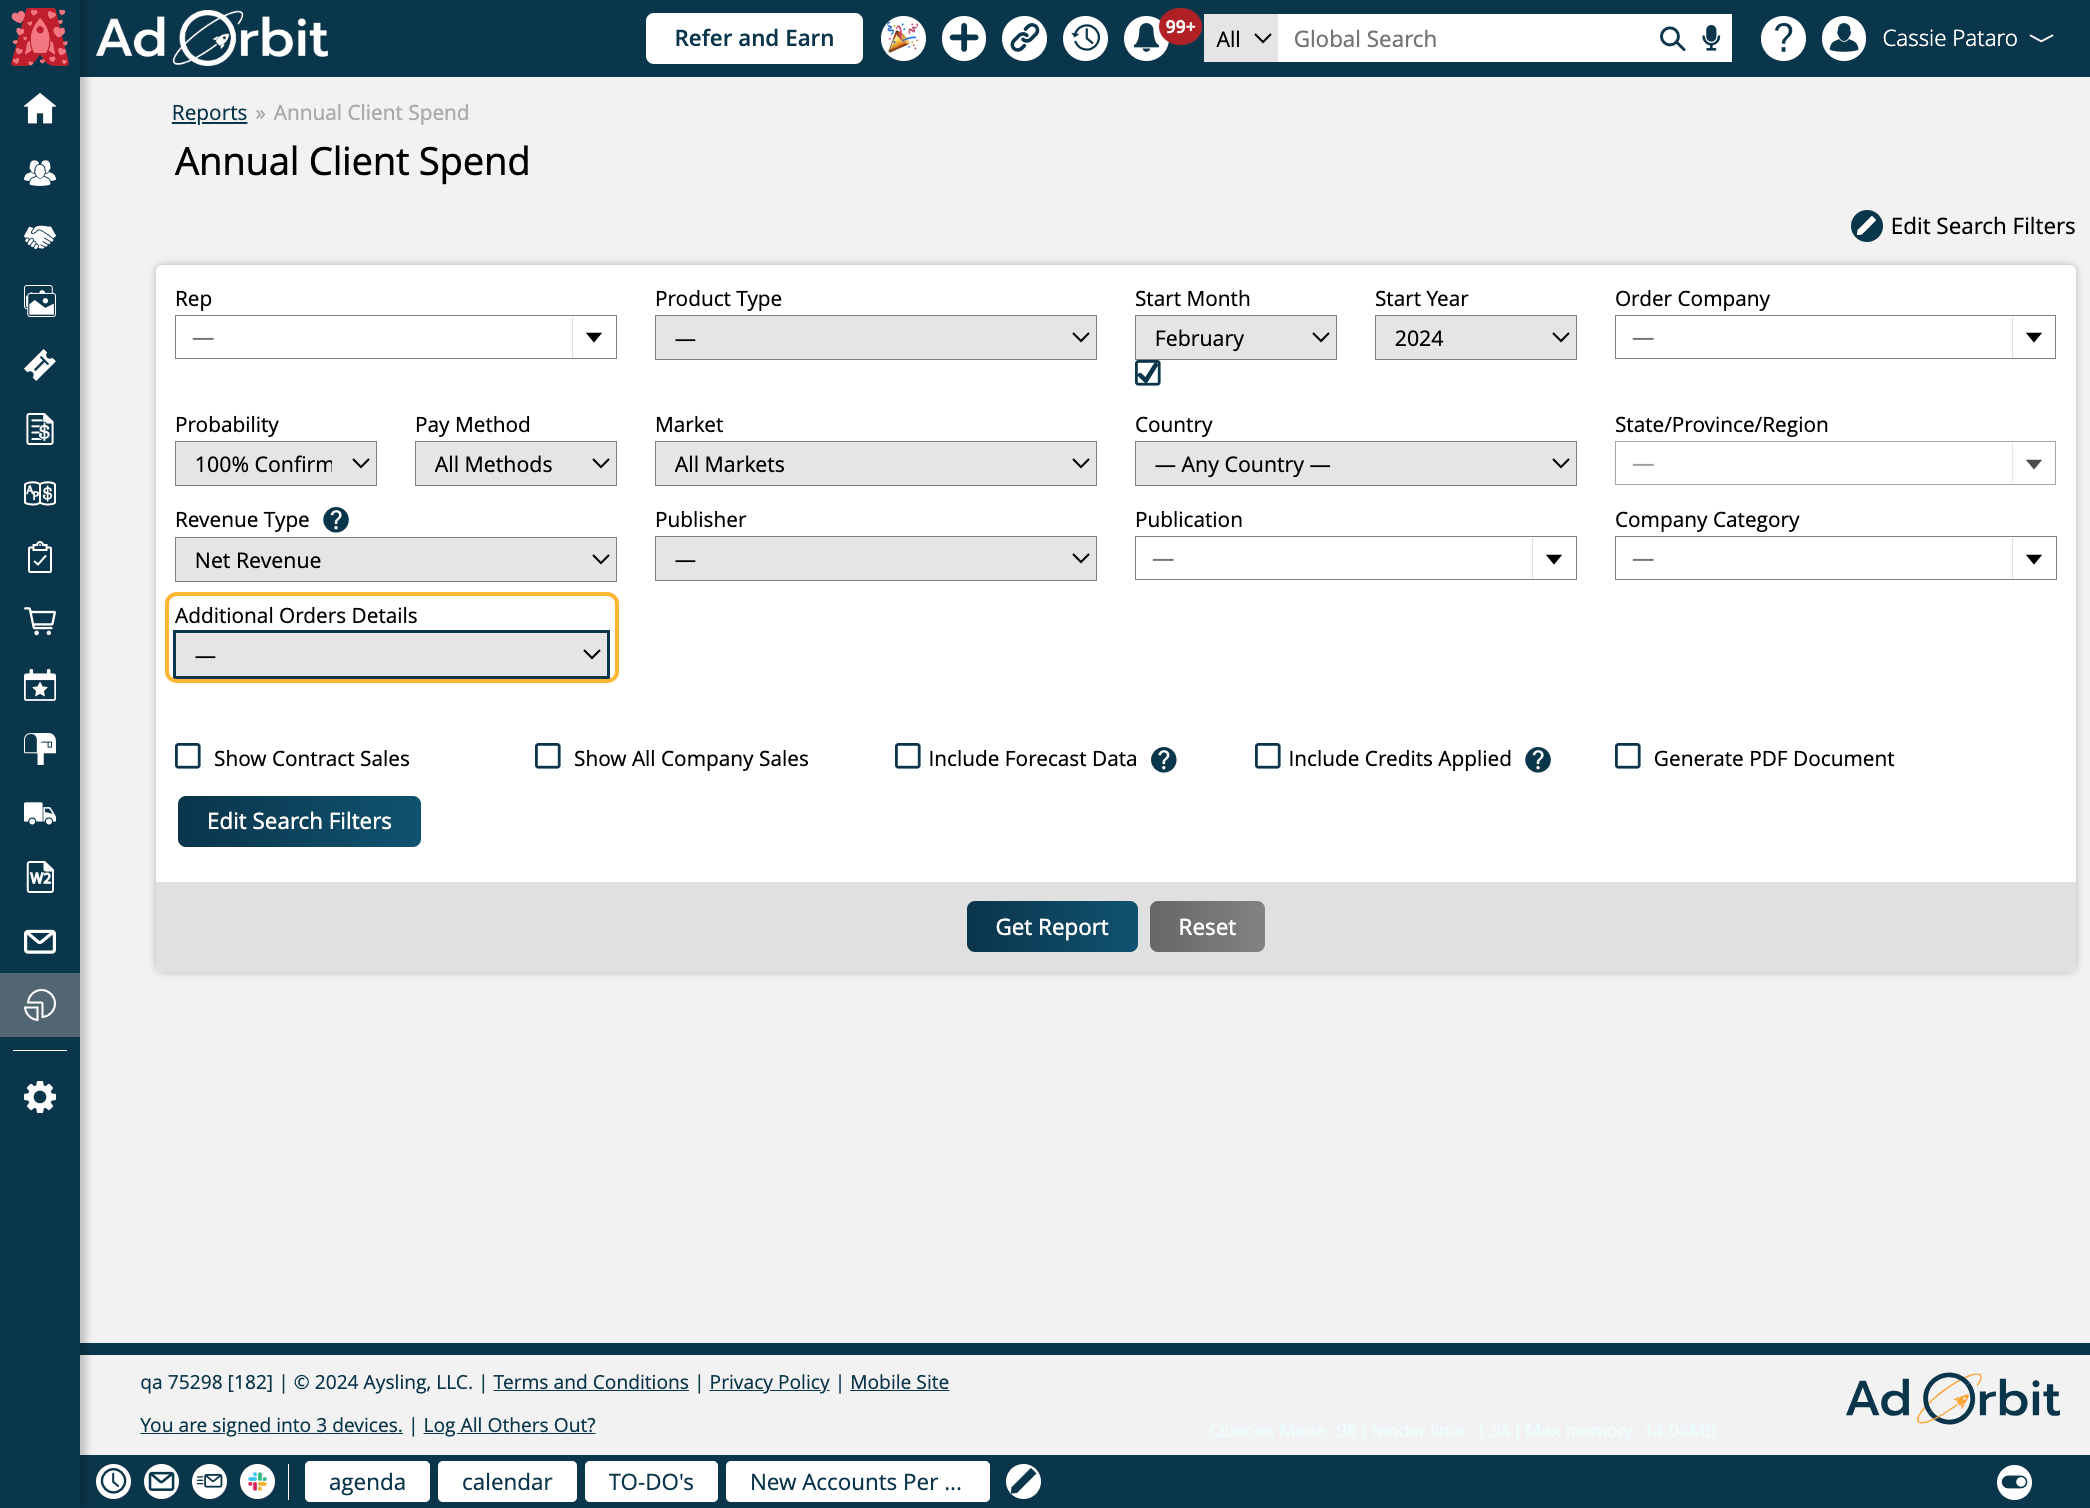
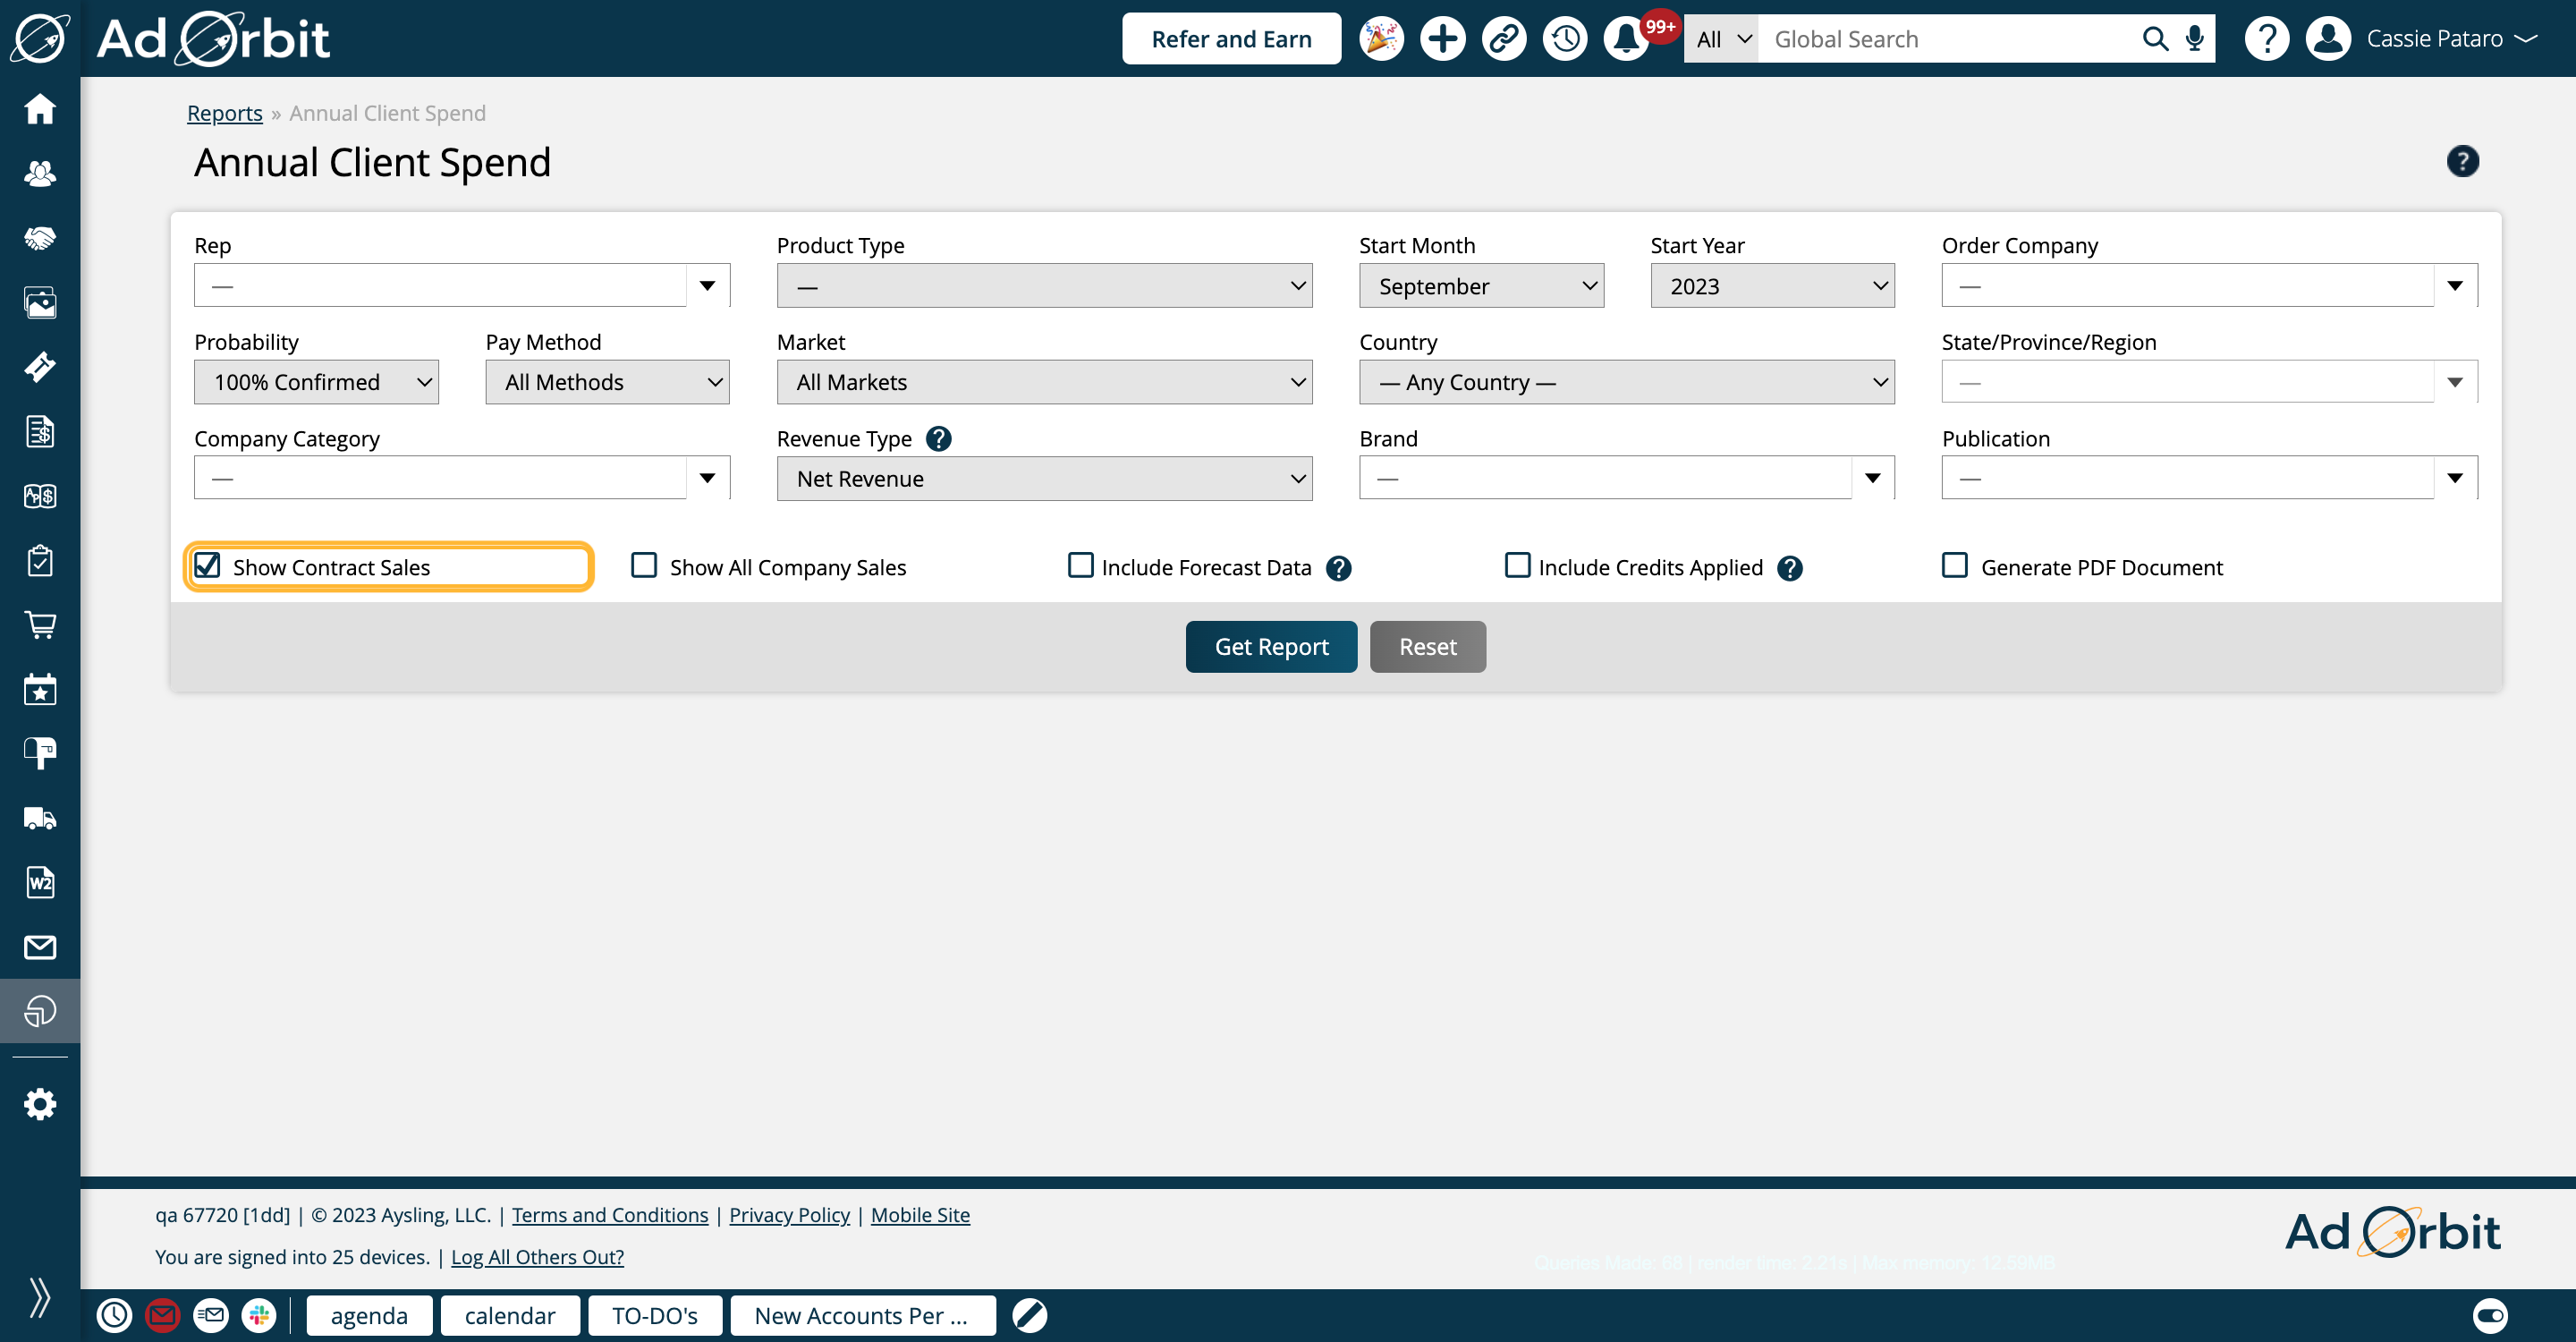
By default, the report separates the data into months, based on either the Issue Reporting Date for advertisements, or the Bill Date for services. When the Show Contract Sales option is selected, the data is instead grouped based on the Sold Date of the order.
For example, if a sale was made in January for an issue whose reporting date was in February, the report would typically display the sale amount in February. However, if the Show Contract Sales option is checked, that sale amount would instead display in January.
The Show All Company Sales option is only applicable when the report is being run for a specific rep, not all reps.
When the report is showing data for all reps, the numbers in the body of the report show all of the sales information for the company. When a specific rep is chosen however, the numbers that display in the body of the report are only their sales numbers. If you would like to see data for a specific primary rep’s companies, but you would like to see sales information from all reps assigned to the company, check the Show All Company Sales option.

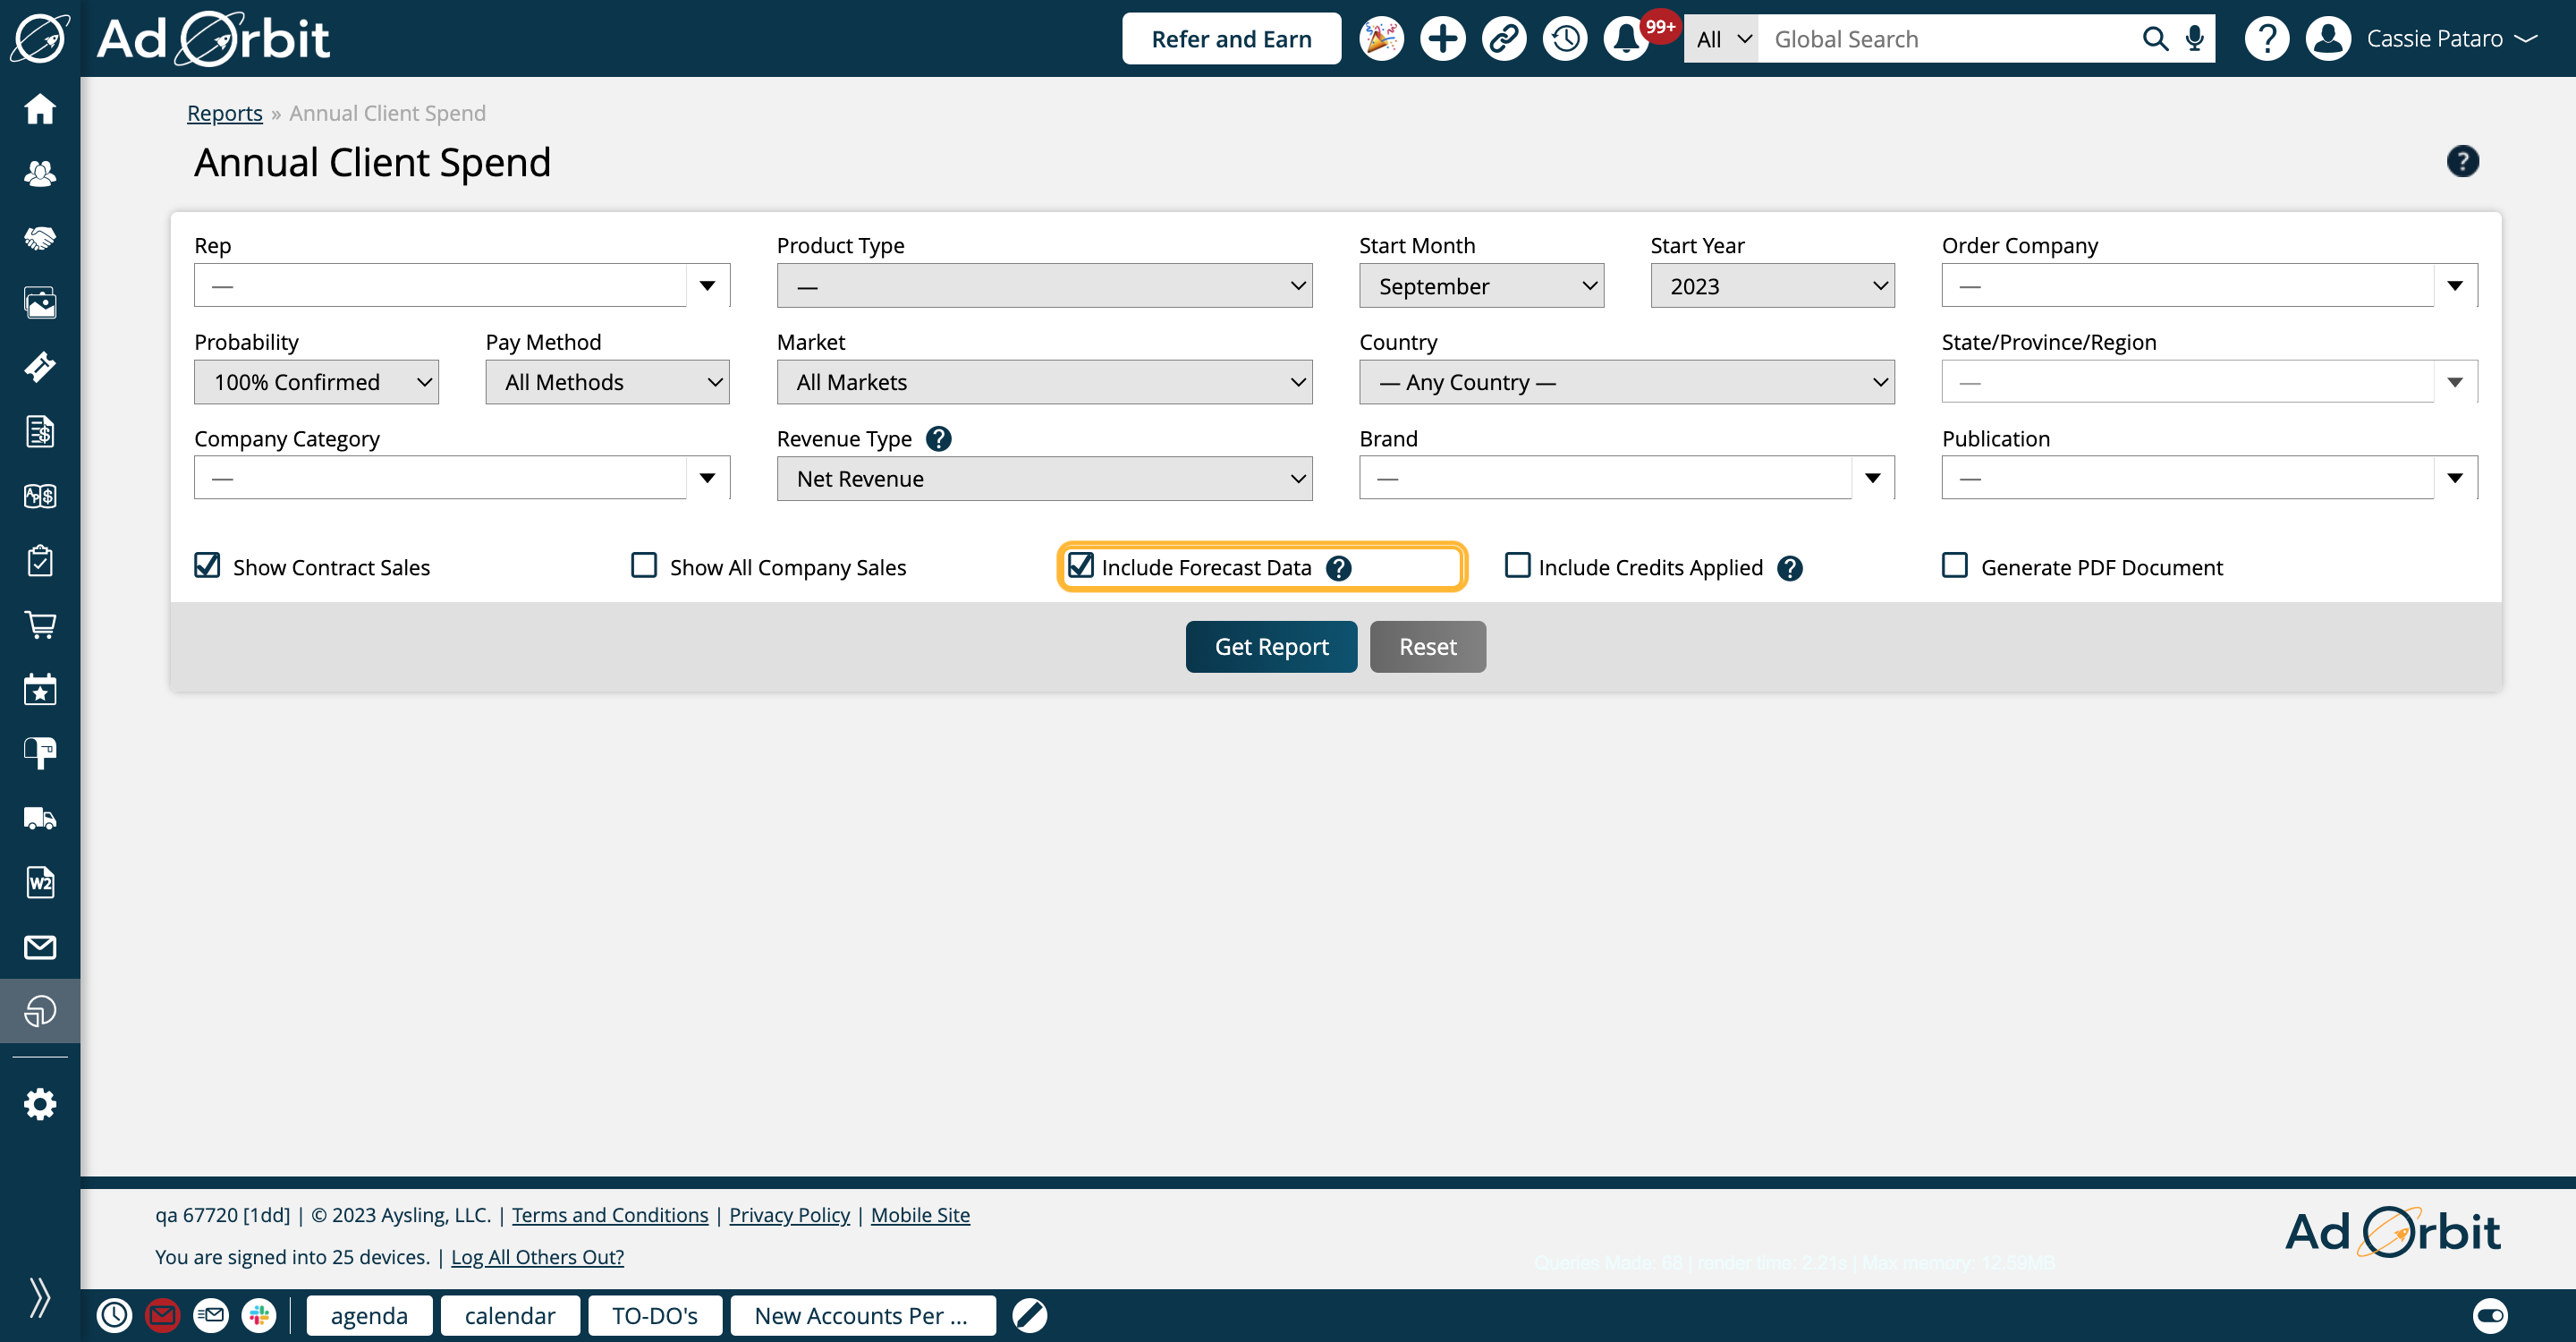
Check the 'Include Forecast Data' option to include current year weighted sales opportunity, proposals, and pending order data.
When forecast data is included in the report, users can view the differences between pending or proposed sales and completed sales per month. If the user has permission to create forecast opportunities, they can also create a new opportunity directly from the report body.
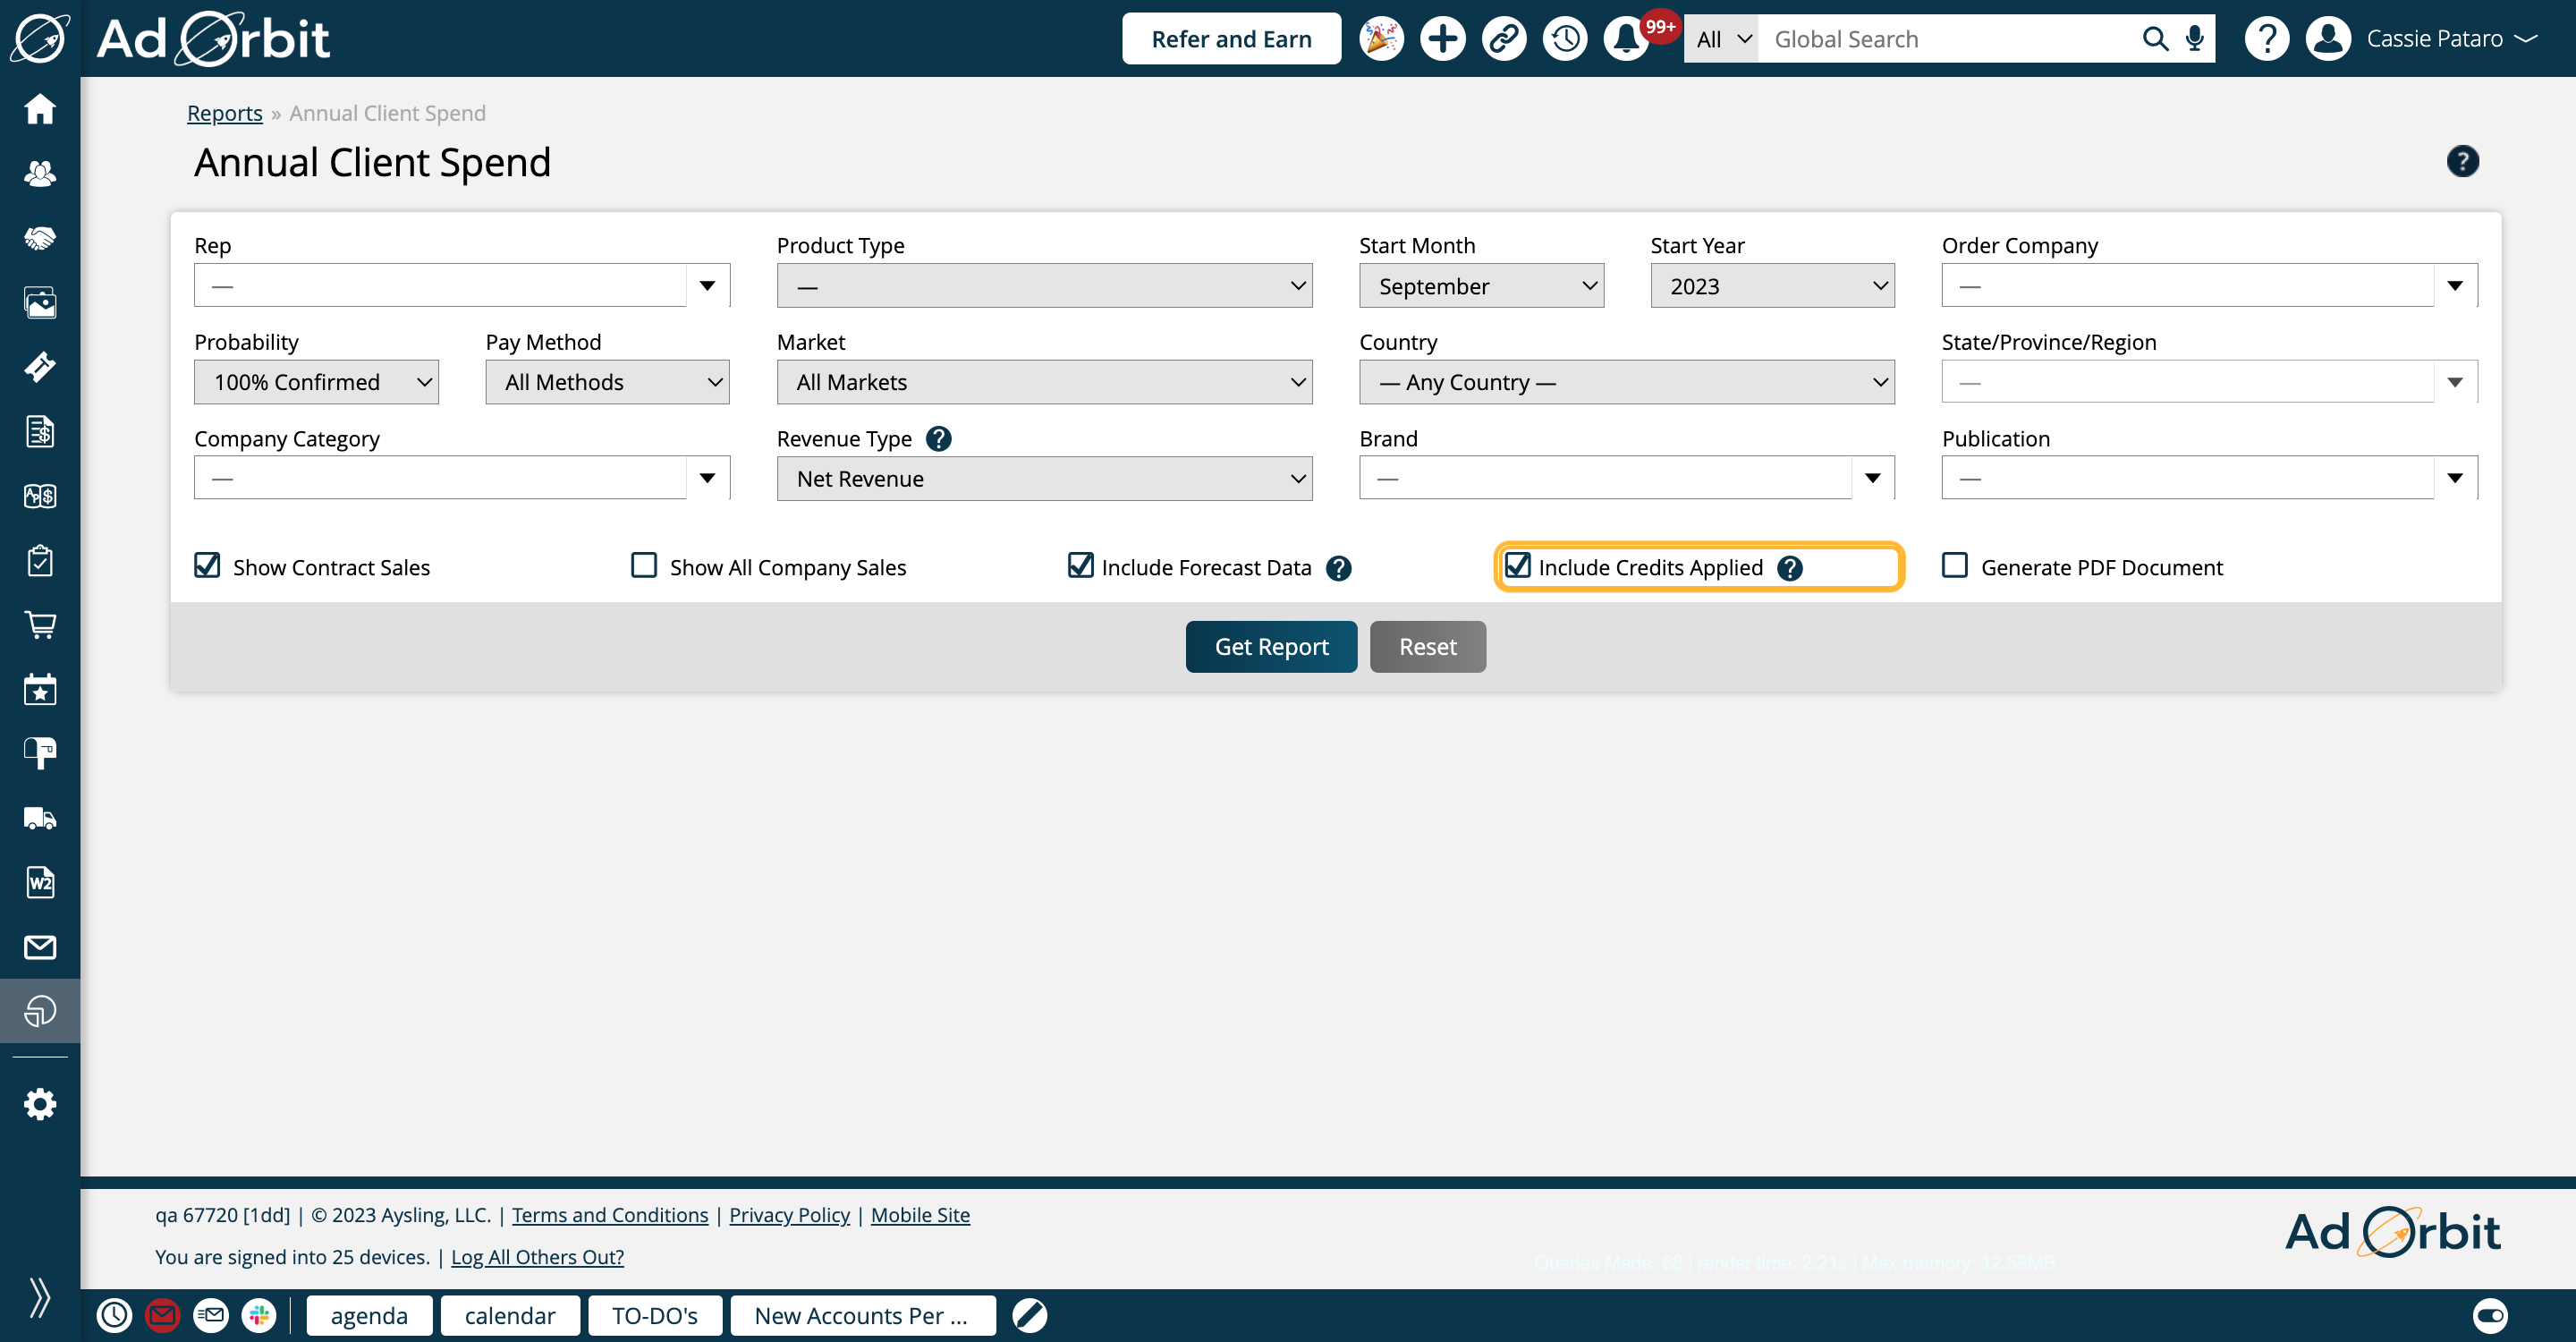
Check Include Credits Applied to adjust the client spend amount by any credits applied to a line item.
Click on Get Report when you are ready to view your results.
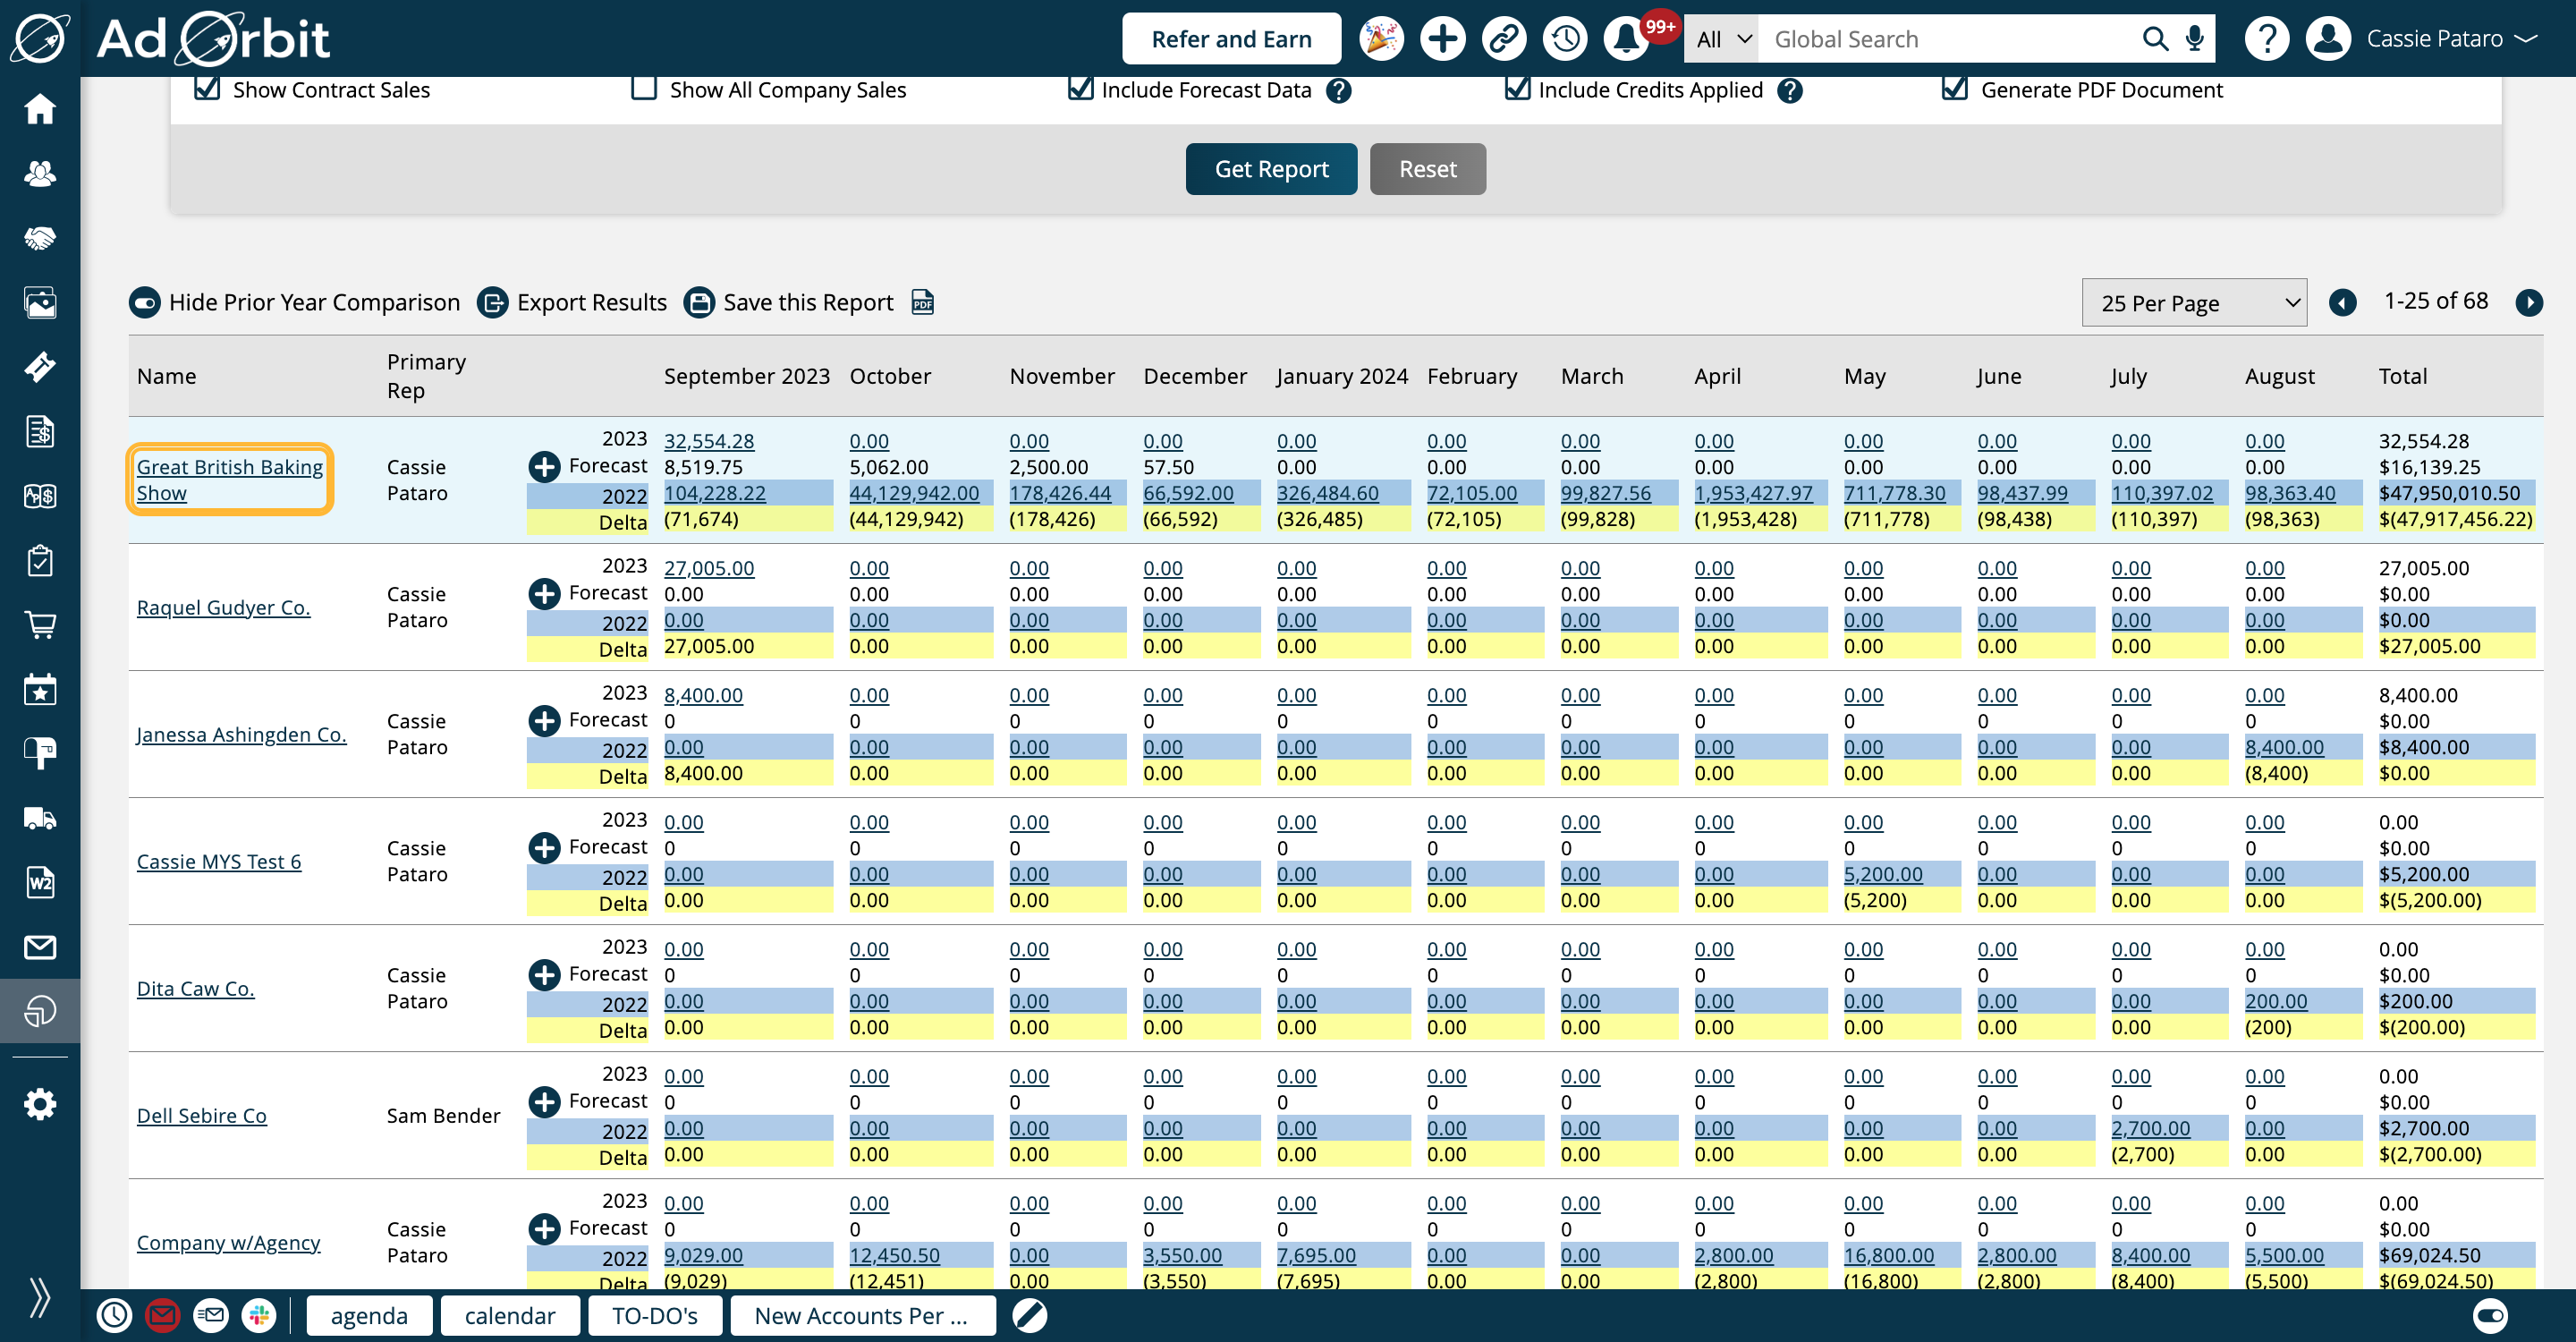
The results are shown in a table format, but how the table looks will be different based on the search options you choose. There are various actions you can take from the table. You can click on the company's name to open their Overview page in a new tab.
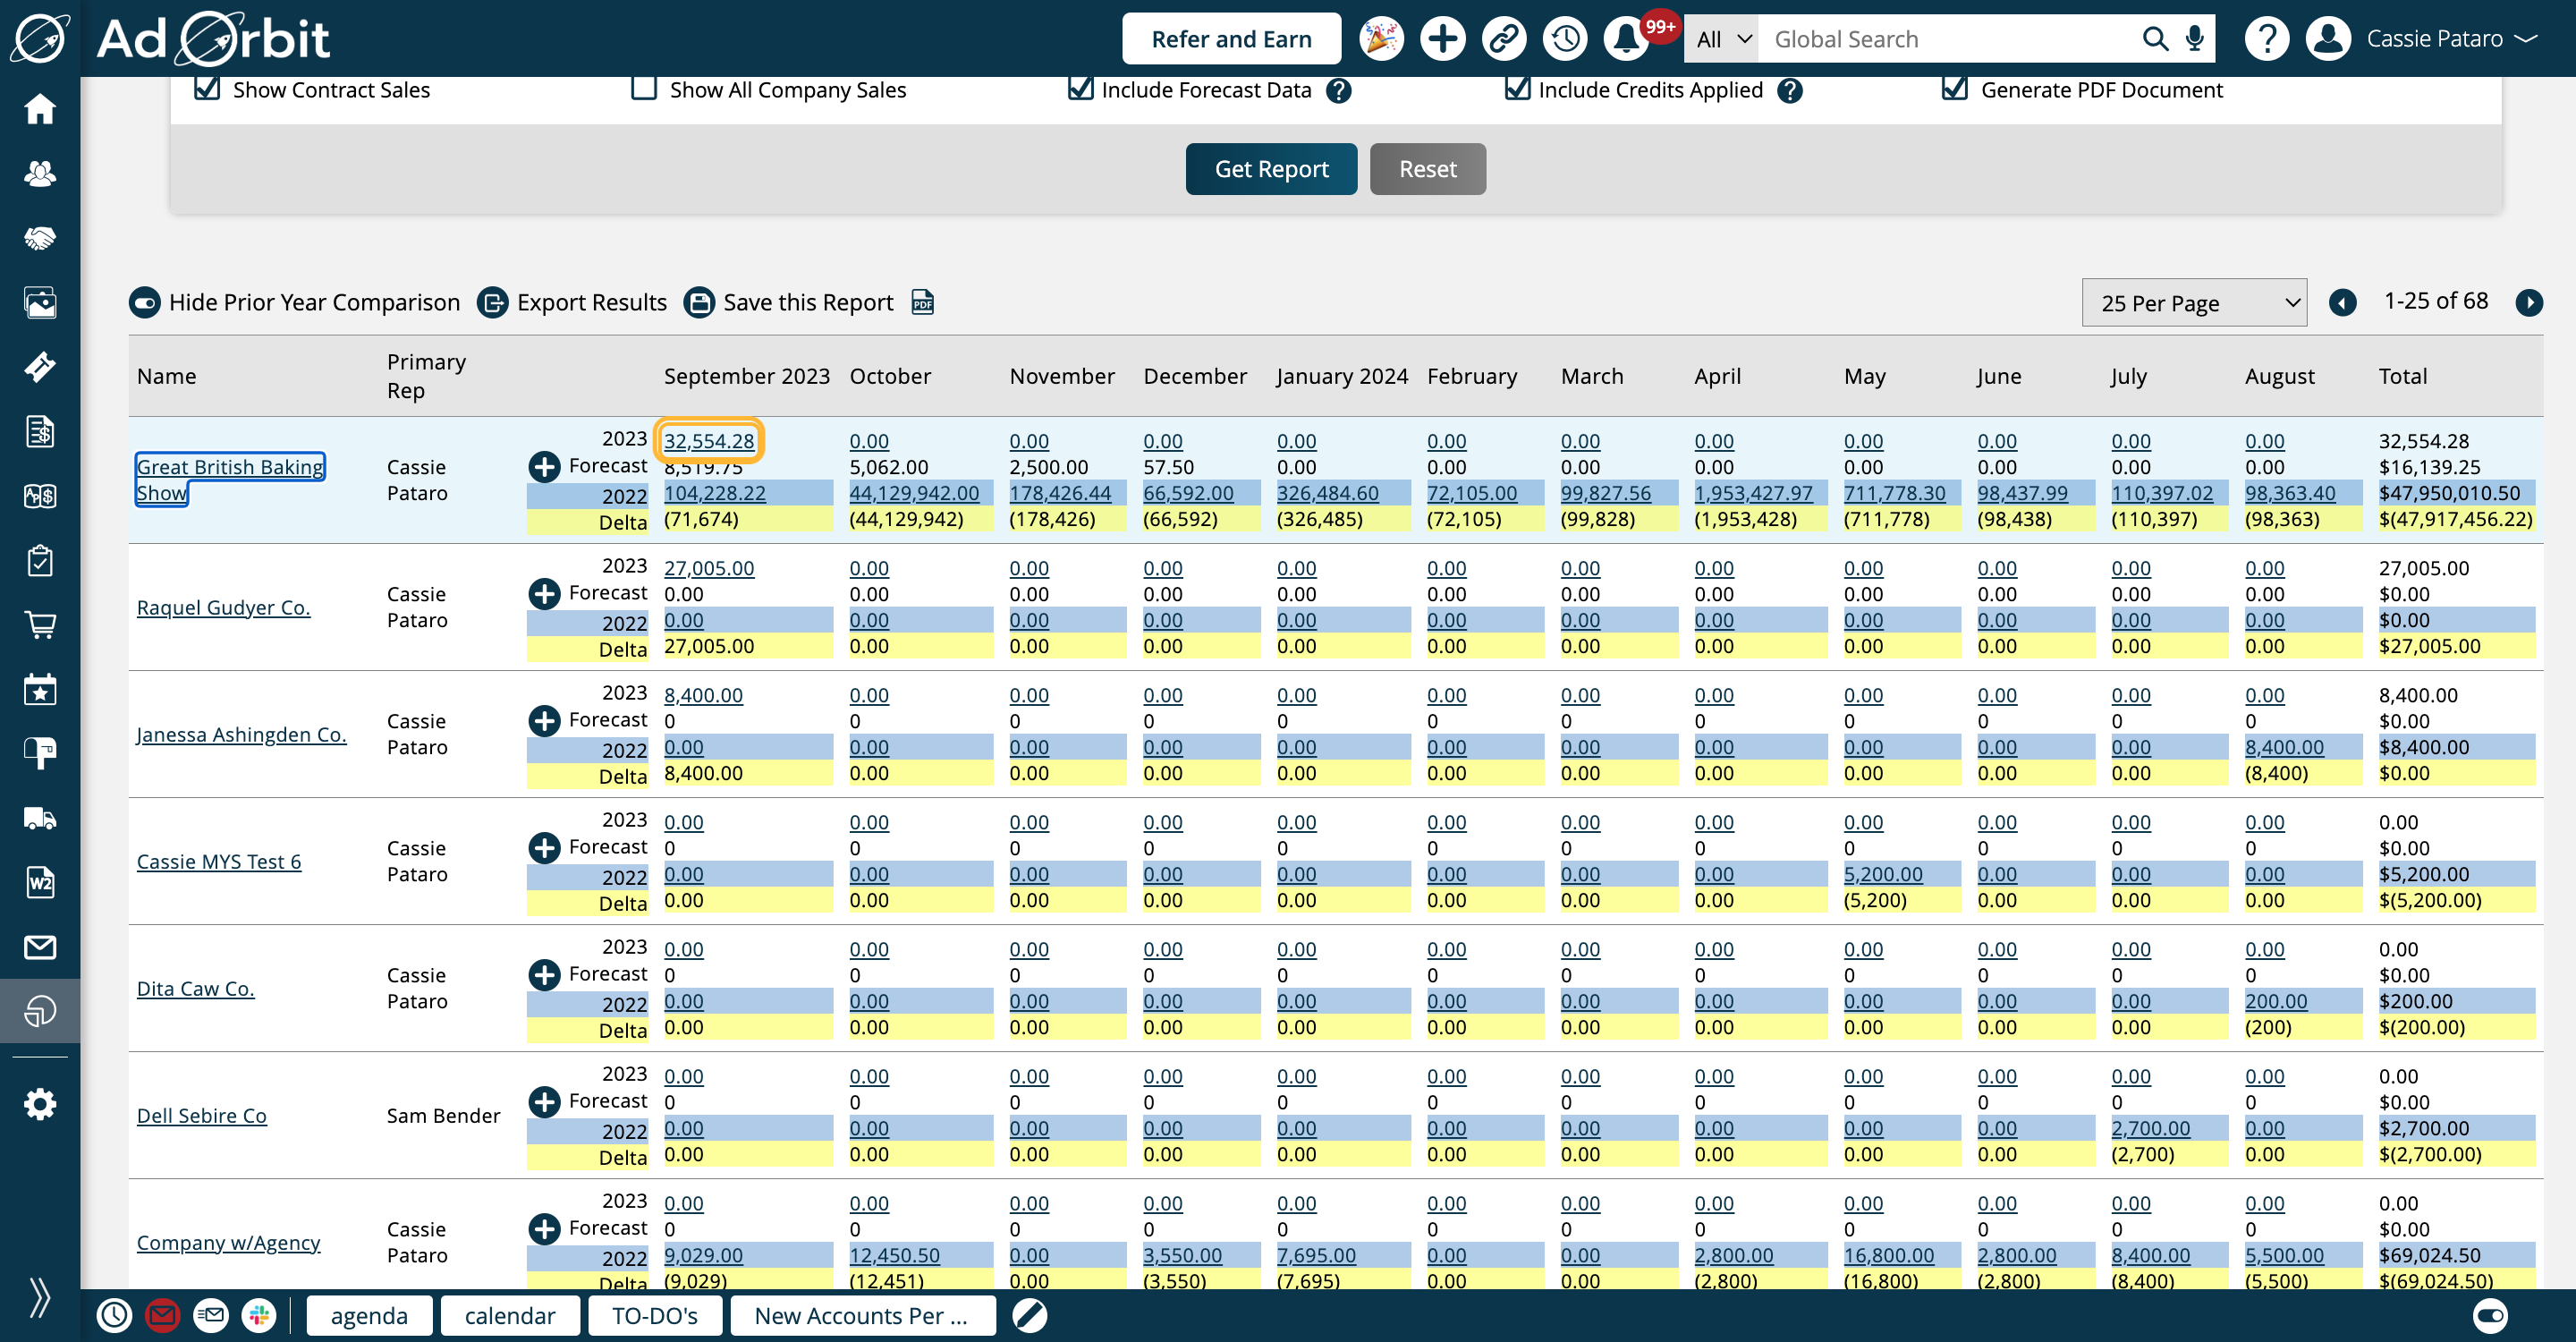
By clicking on a number value in the table body, you'll be brought to the Consolidated Sales report, with search fields pre-populated, which allows you to view the details of where the data is coming from.
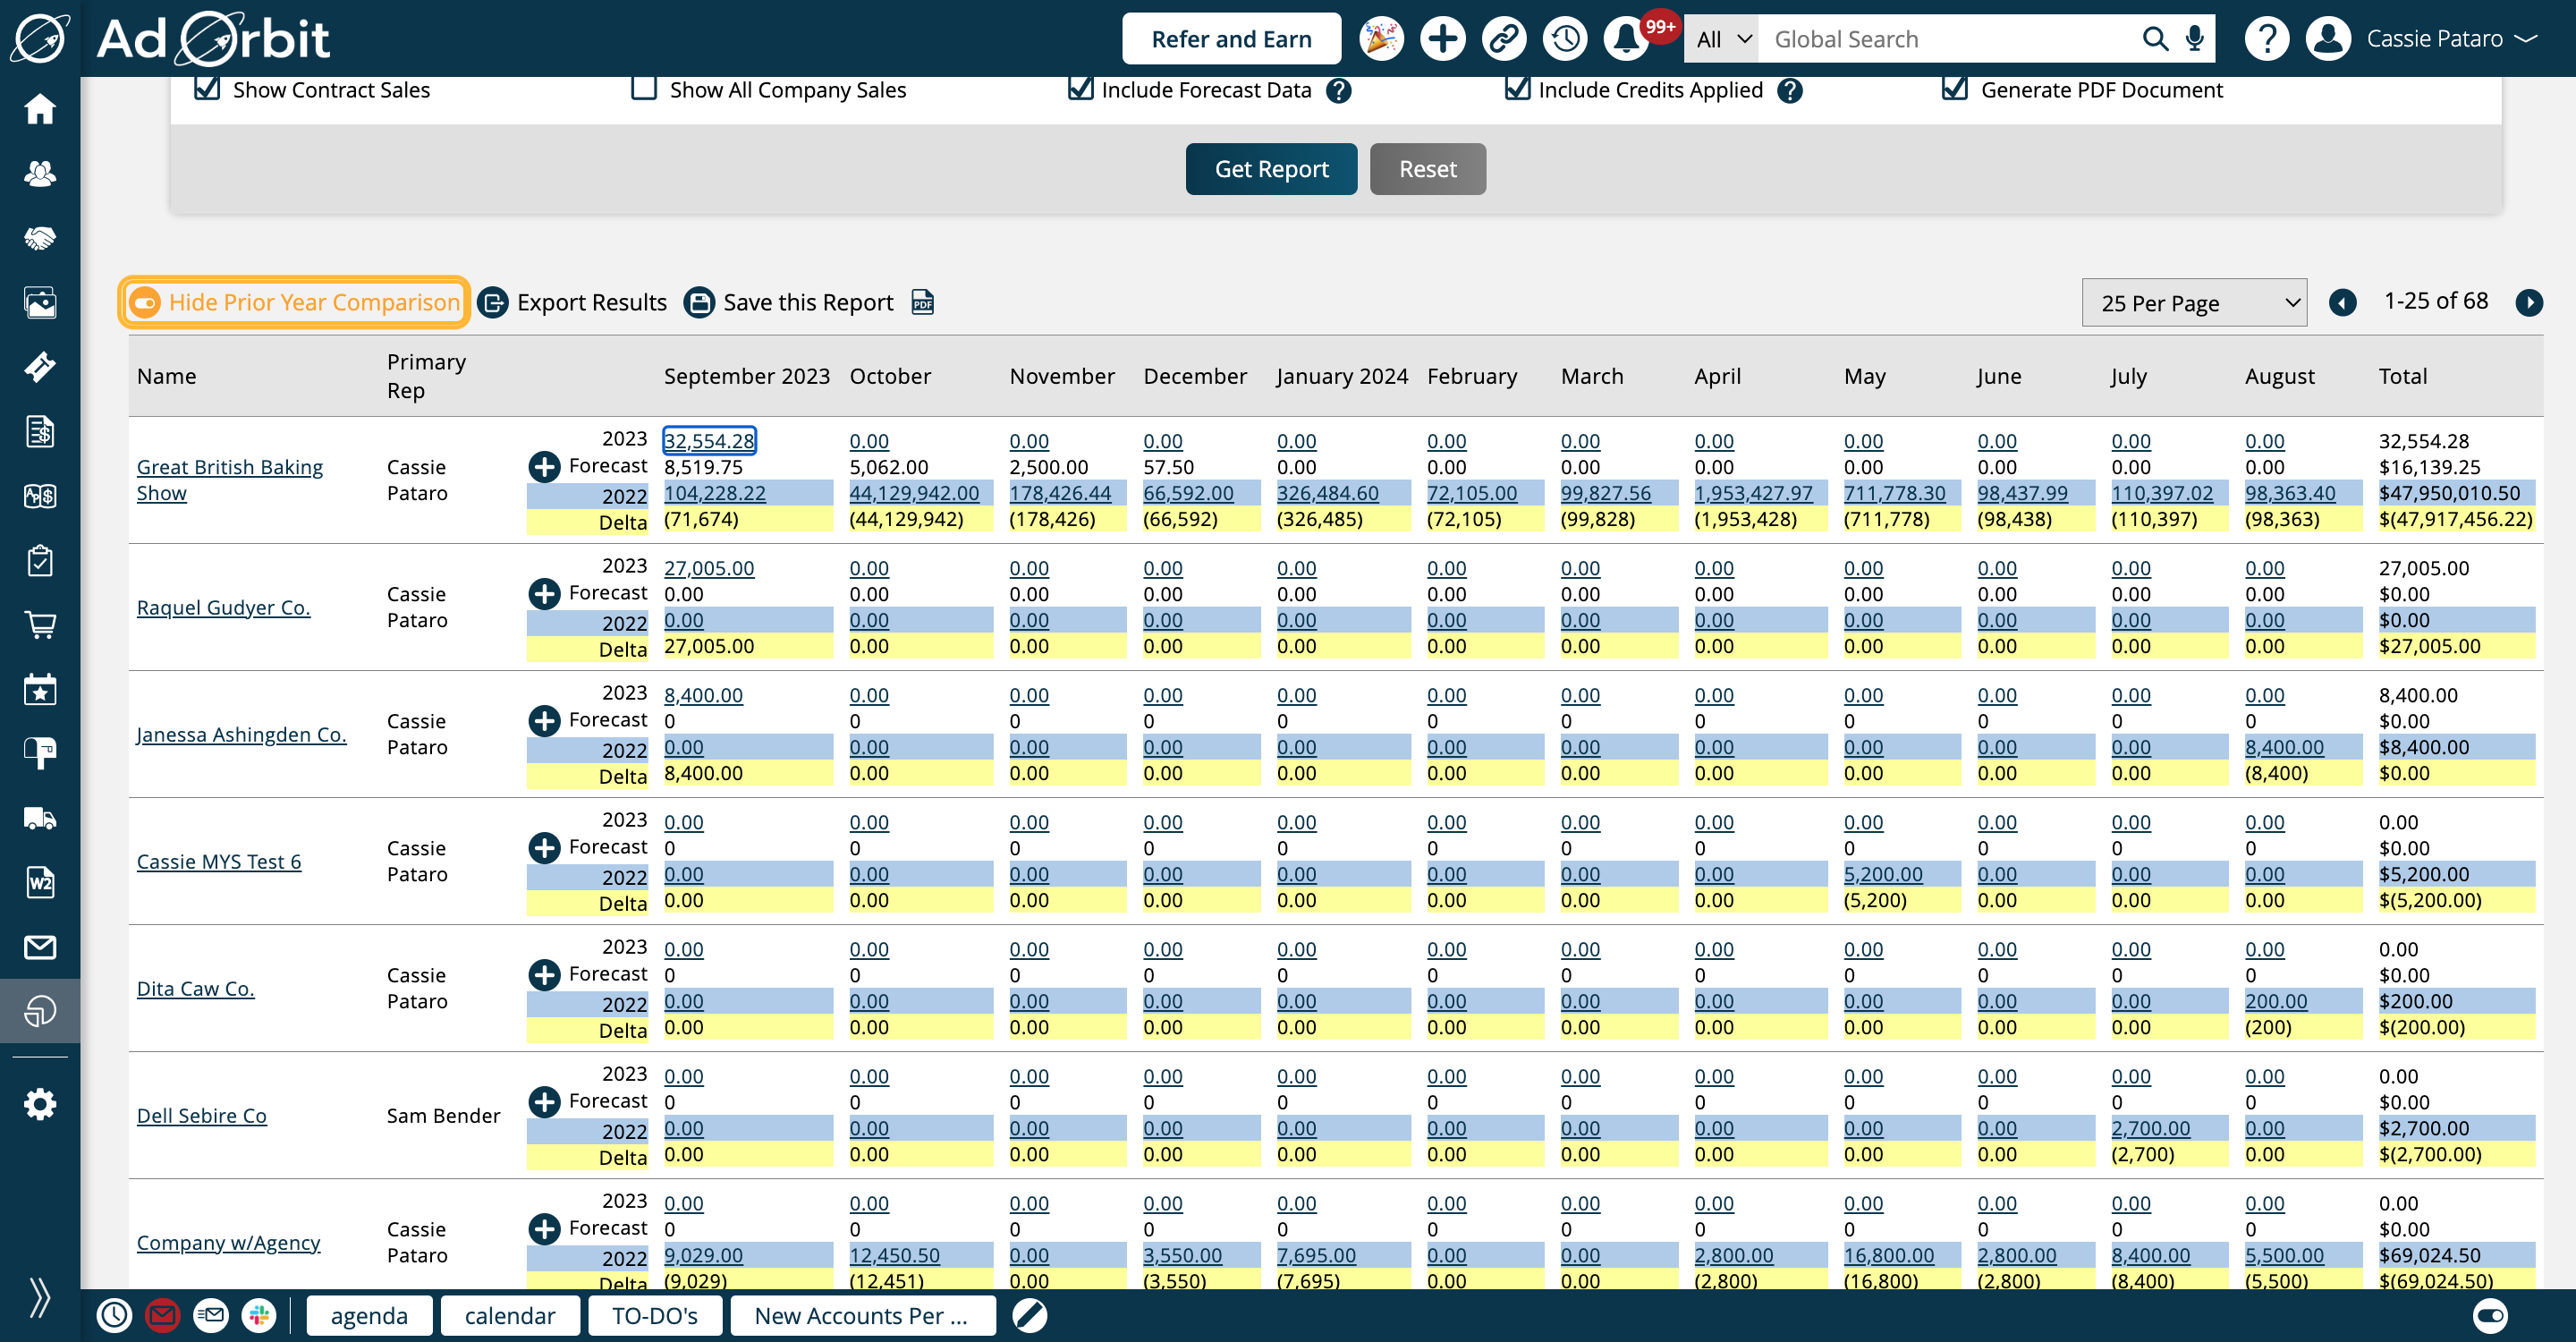
You can choose to either show or hide the comparison from the previous year's sales by clicking the 'Hide/Show Prior Year Comparison' button at the top of the table. When prior year sales are included, the prior year will be highlighted in blue, and you'll see a 'Delta' value which is the difference between the two years, highlighted in yellow.
If you checked the 'Include Forecast Data' search option, there will also be a Forecast row for each record. If you have permission to create opportunities, you'll also see a plus icon that allows you to quickly create opportunities for the company directly from this report.
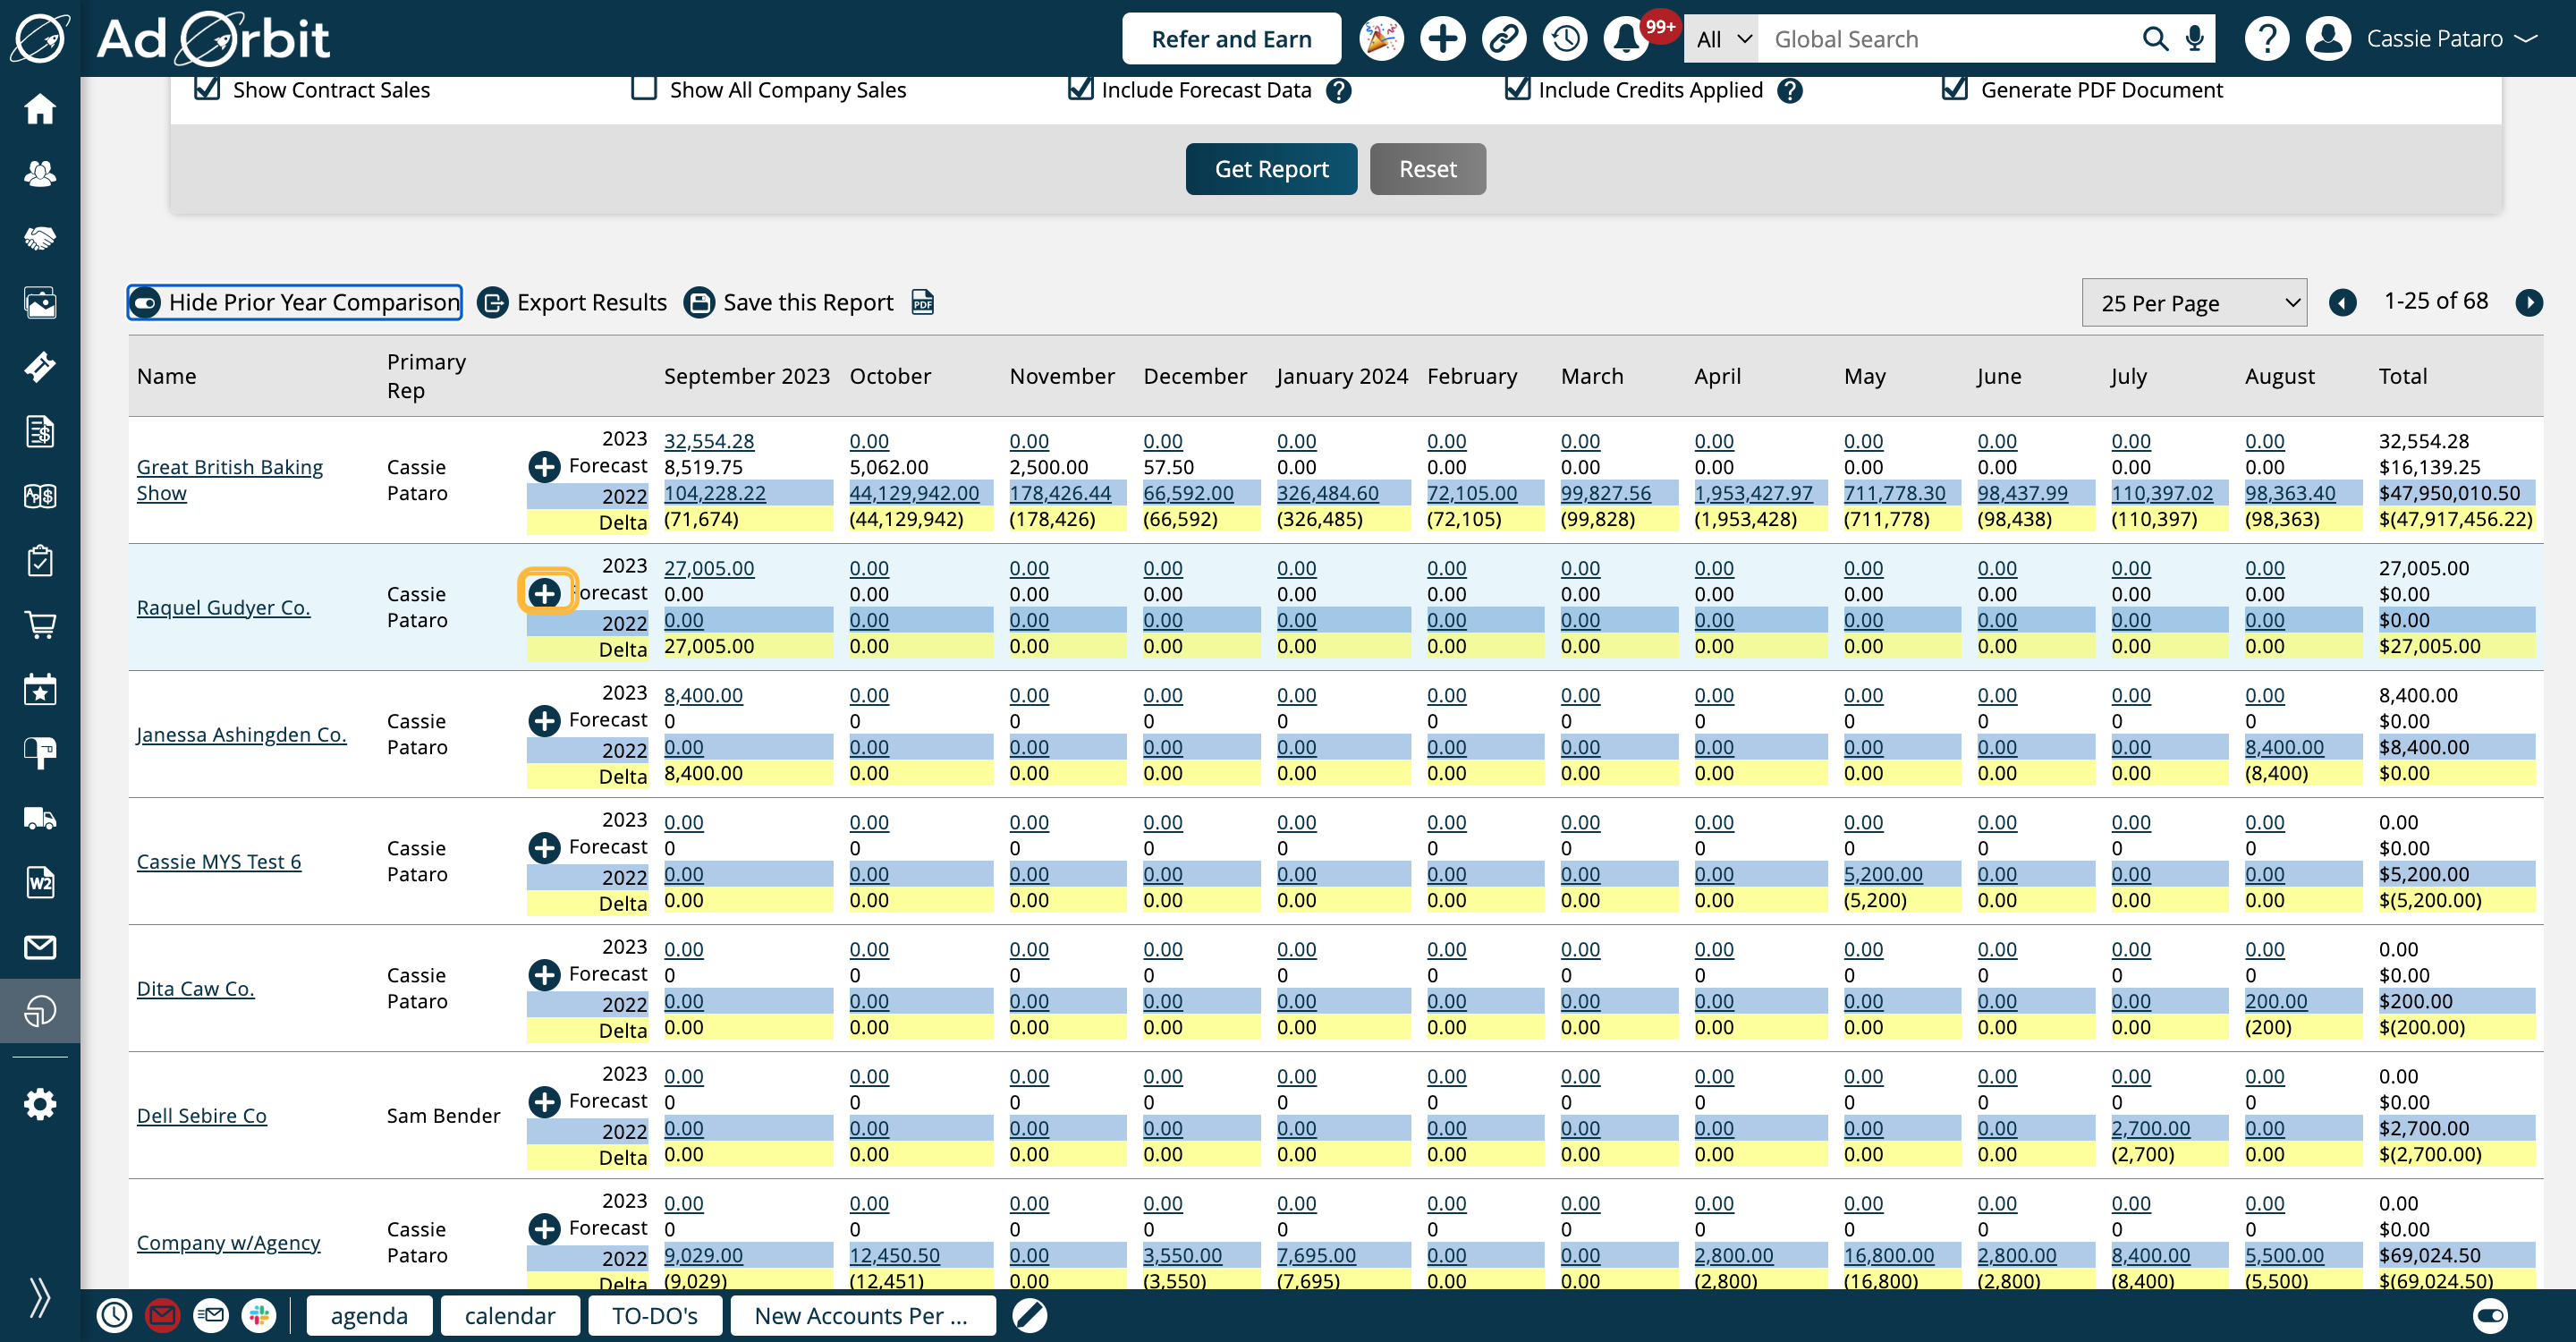
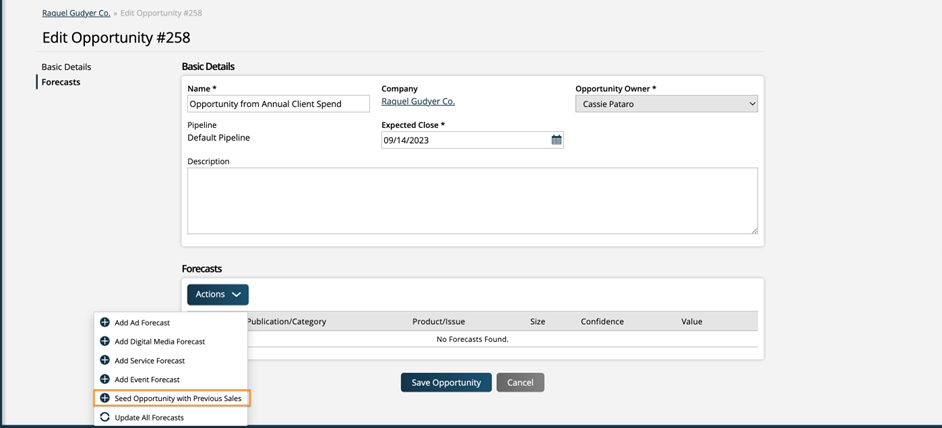
When creating opportunities from the Annual Client Spend report, you can use the ‘Seed Opportunity with Previous Sales’ option.When creating opportunities from the Annual Client Spend report, you can use the ‘Seed Opportunity with Previous Sales’ option.
This option is intended to allow you to quickly create forecasts based on the company's previous Year To Date sales. If the option is used, when you save the opportunity, you'll get a forecast item automatically created for every sold line item on the company from the selected date range.
The date range is automatically filled out based on the date range you searched on the Annual Client Spend. For instance, if you ran the report starting in September 2023, your date range will be automatically set to 9/1/23 through 8/31/24. This can be edited as needed.
Some items may not be eligible to have an opportunity created for them. Some examples include any print items that don't have future issues created yet, or any line items that had no cash value ($0).
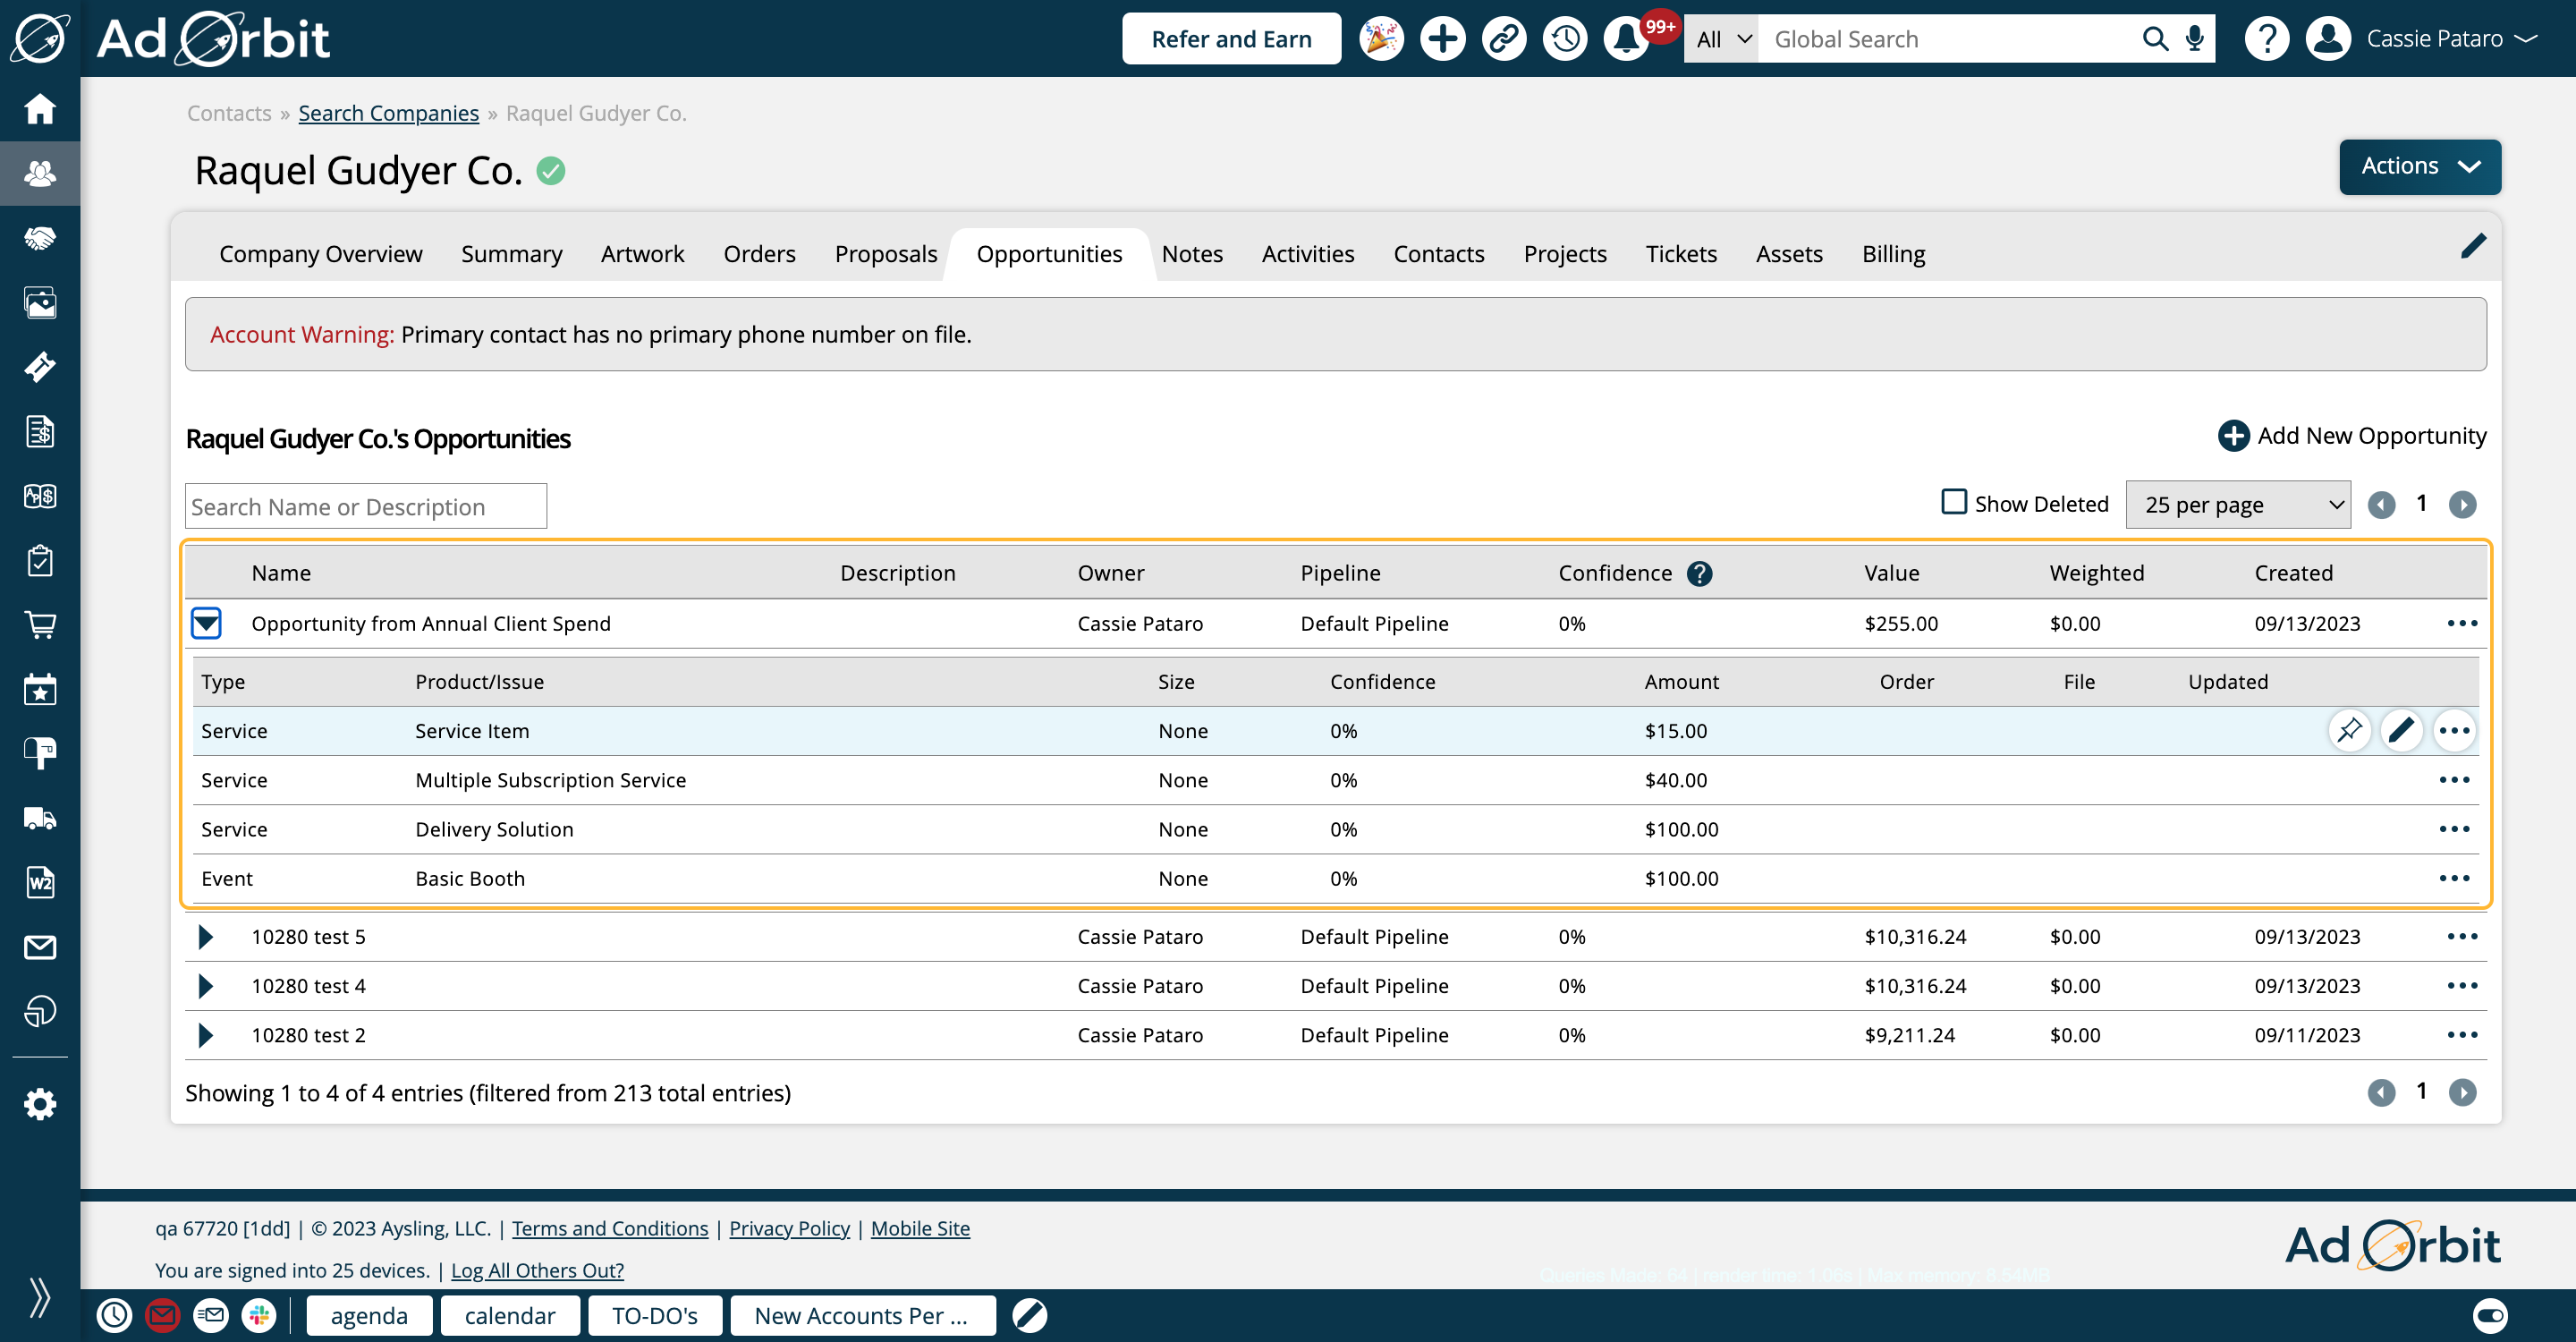
Here is an example of an opportunity created using this option. Raquel Gudyer Co. had a handful of sales items between 9/1/23 and 8/31/24. When I used the Pre-populate Forecasts Using Sales in Period option, this is the opportunity that was automatically created.
Updated 2/9/2024