Annual Issue Sales
The report shows the sales number by issue month for reps. You can use this report to see how much your reps have sold for upcoming months for a publication(s) and compare it to the previous year to track your trends. You can also drill down to a snapshot report or the issue comparisons report.
To access the report, you need the User Permission 'Annual Issue Sales Report'.
To view data for all users, not just yourself, you also need the sub-permission 'View All Users'.
You can change the results that are returned by using the search fields, including year, page type, pay method, and publication. If you do not select a publication, then the report will show results for all publications. The data that will display varies depending on which Report Type you select.
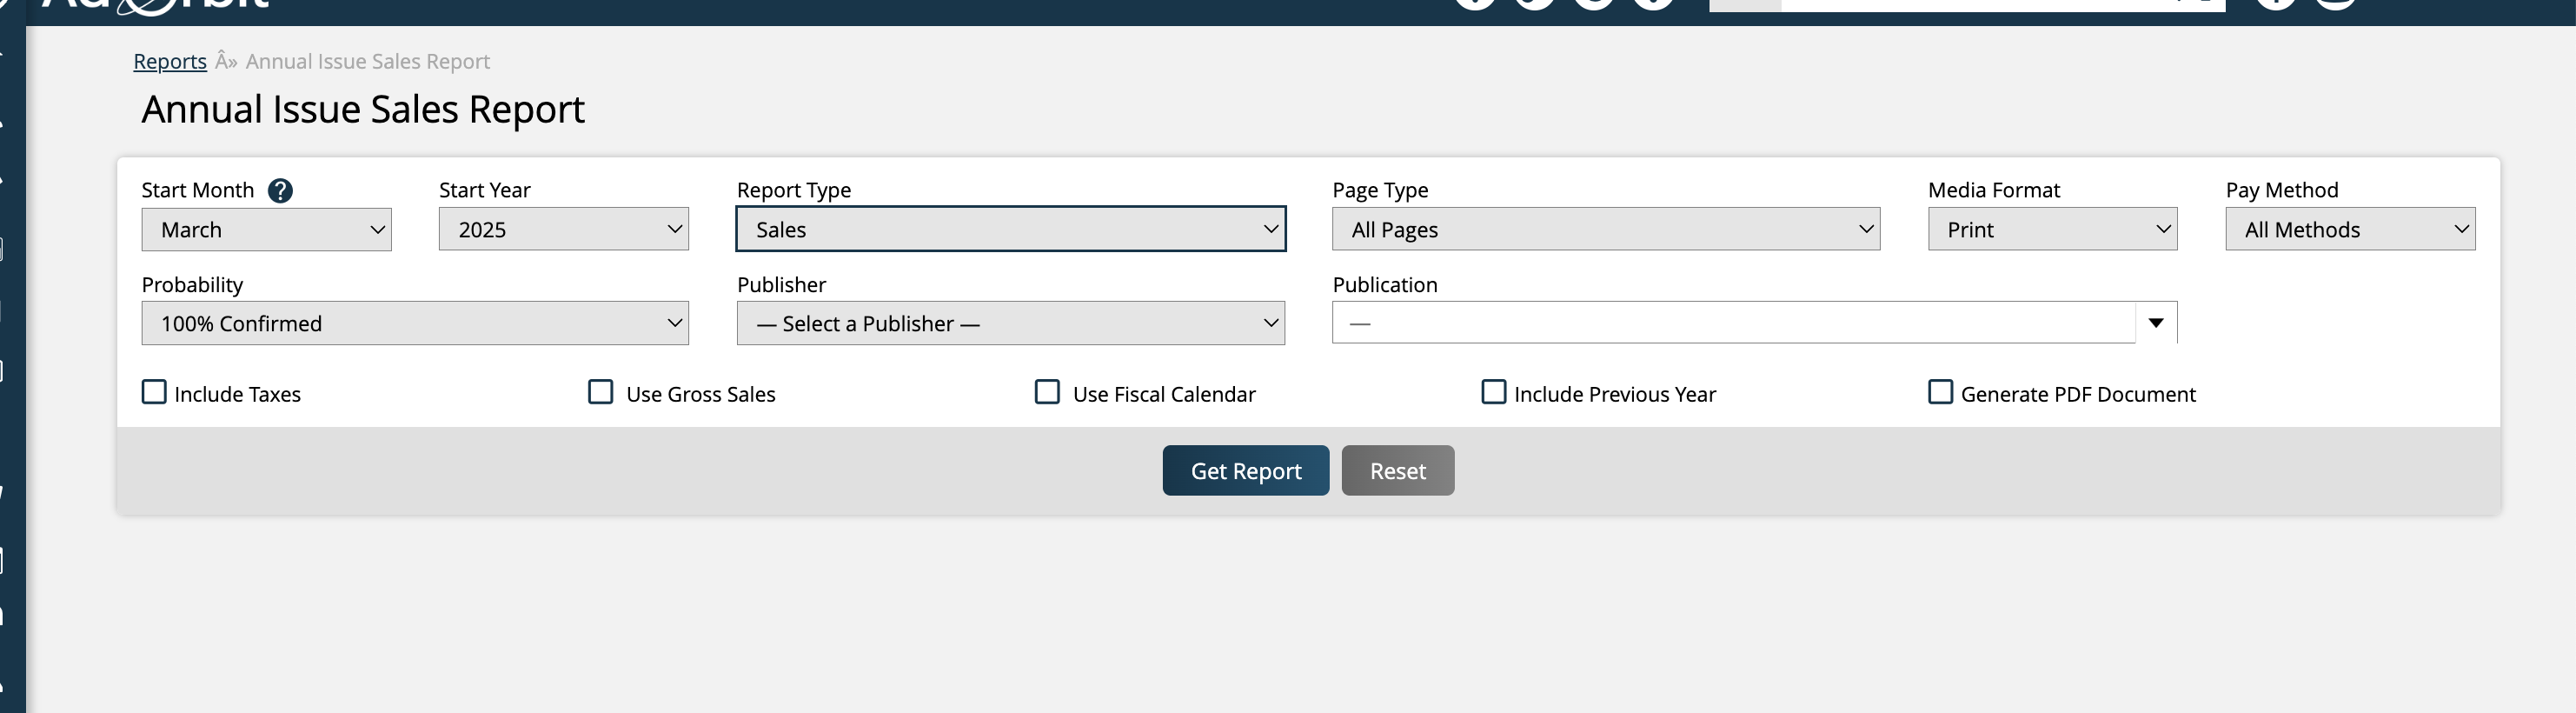
Sales: The report will break down the total cash sales made by rep.
Pages Sold: The total pages sold by rep for each month, calculated using the ad size calculations. For instance, if a rep sells 2 half page ads in one month, their total pages will be 1 for that month.
Avg Price Per Page: The average price per page is calculated by dividing the cash sales by the number of pages. As an example, let’s say that you have both a ½ page horizontal ad size, and a ½ page vertical ad size, with sales for both sizes in the month of June. The system will take your cash sales value in June for your ½ horizontal size, and divide it by the number of pages sold for your ½ horizontal size in June. The system will perform the same calculation for your ½ vertical ad size. These numbers are what will show up in the data table when using the Avg Price Per Page report type for June.
Avg % Rate Card: The report will break down the rate card price, versus the actual prices items get sold for. For example, if an item on your rate card is worth $1000, and two of those items get sold, one for $700 and one for $900, then the average selling price would be $800. In the report, you would see 80%, because the item is getting sold on average at 80% of its rate card price.
Paid vs Comped: When filtered this way, the report will show a percentage for each month of how many sales were paid, as compared to how many were comped. For example, if no sales were comped, then you will see a 100% show up.
Unpaid Invoices: The report will show the total unpaid invoice cash amount per month.
% New Clients: This report type breaks down how much of a rep's sales for the month went to clients denoted as 'new' in your site, vs. sales to existing, established clients.
# New Clients: Similar to the % New Clients report type, this report type simply shows the actual number of new clients that sales were made to, rather than breaking it into a percentage compared to existing clients.
Barter: The report will display any barter amounts recorded based on rep and month.
Regardless of the Report Type you select, the results for this report will always be broken down by month and rep. There will be a full year of monthly results included in the table, starting with the month you selected as your Start Month. Each column will be a rep who has results for the selected report type.
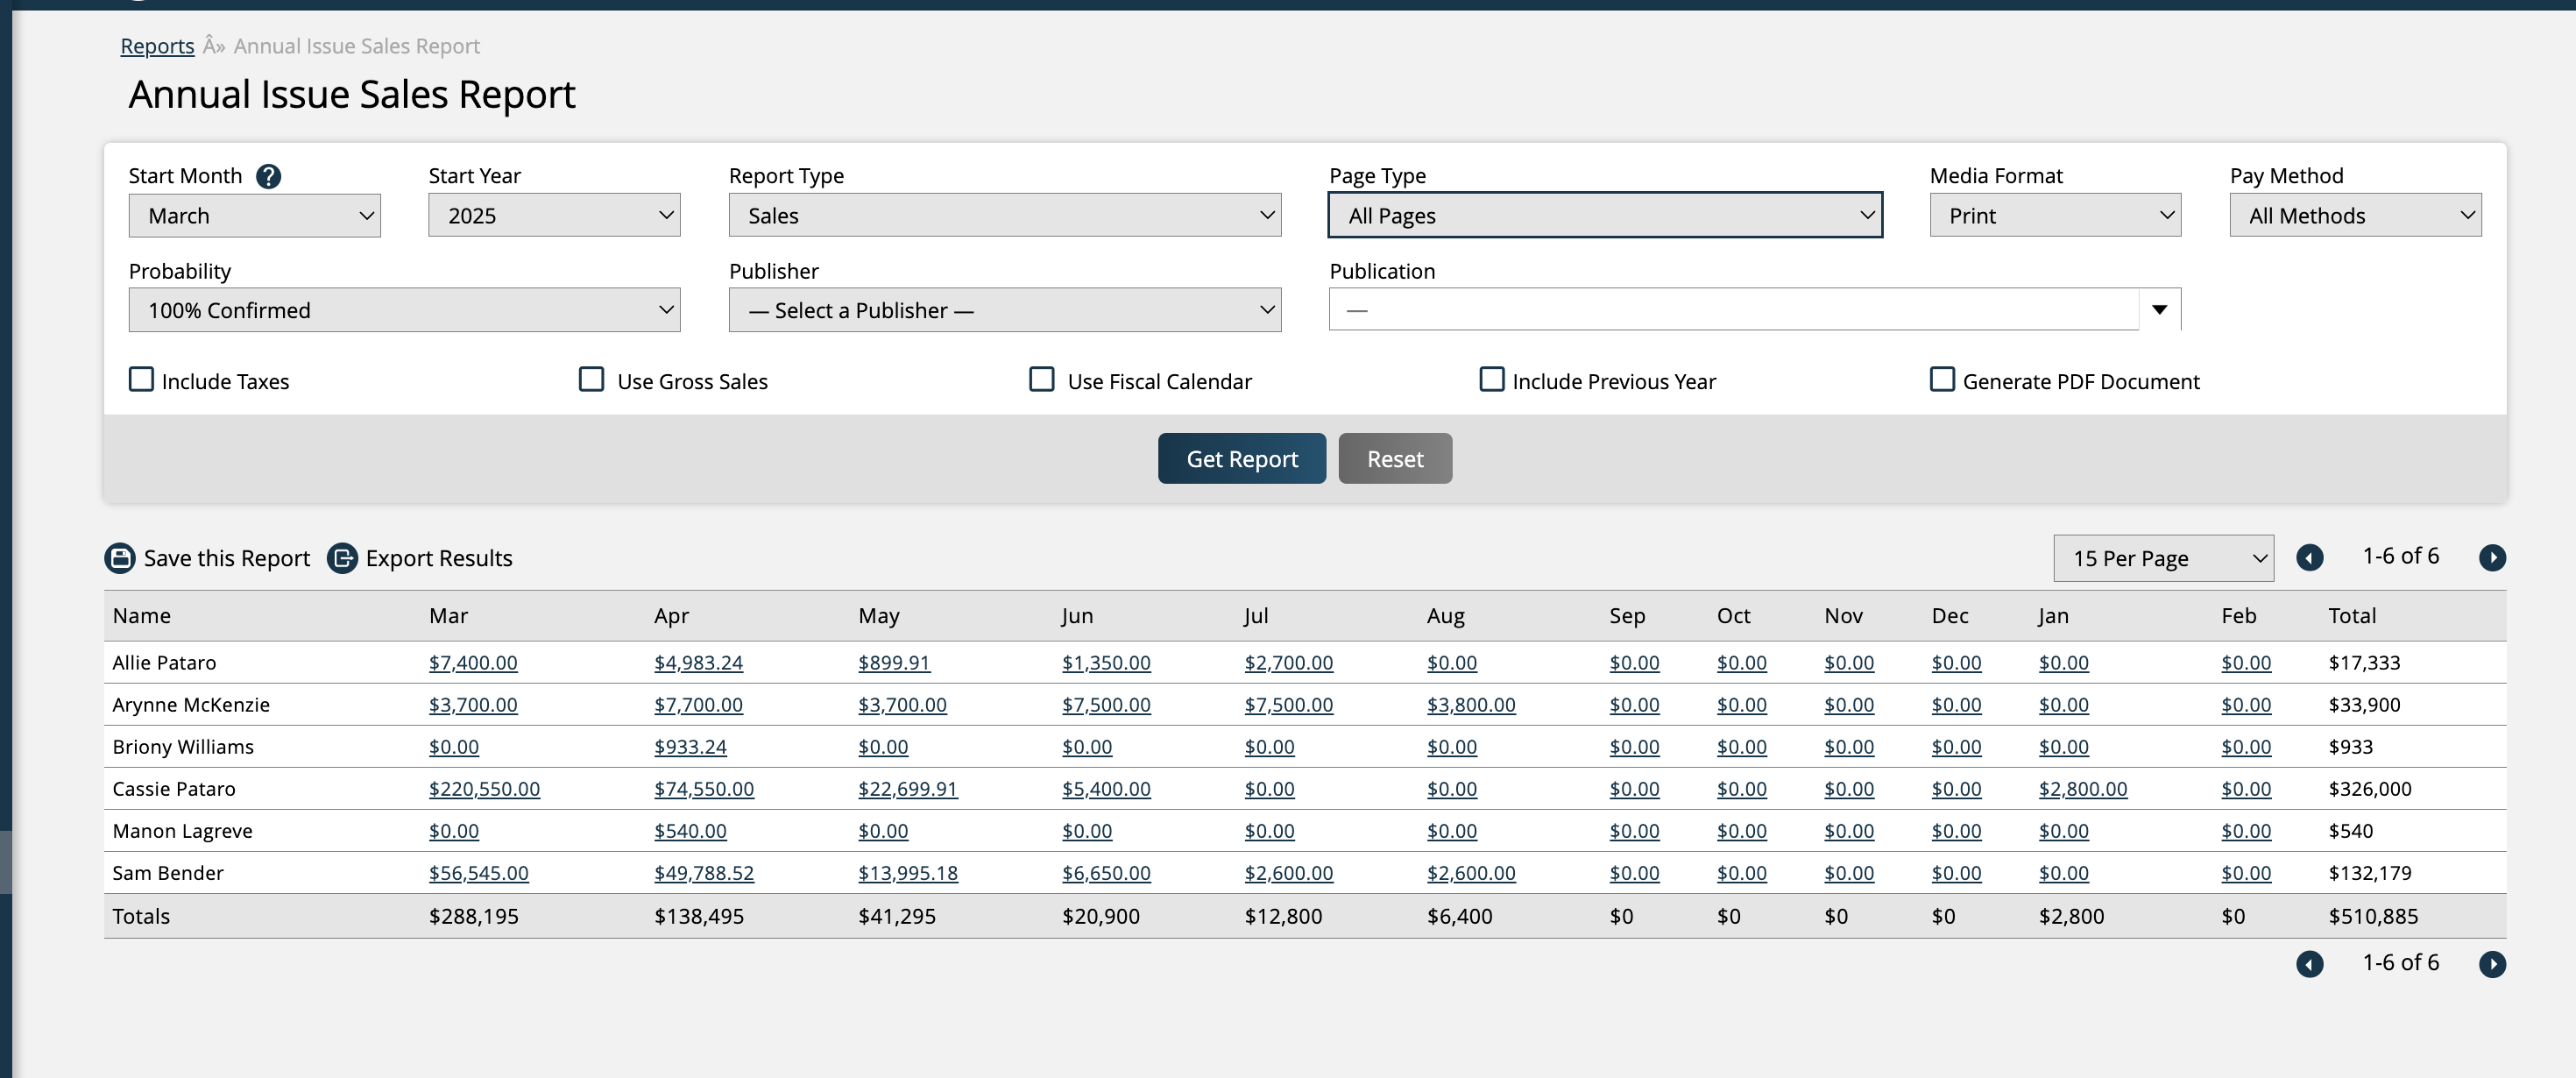
Depending on the Report Type, your results will either be shown in a basic number format, as a cash value, or as a percentage. Most of the Report Types also allow you to link to the Consolidated Sales Report, with certain fields automatically filled in, when you click on the value in the table.
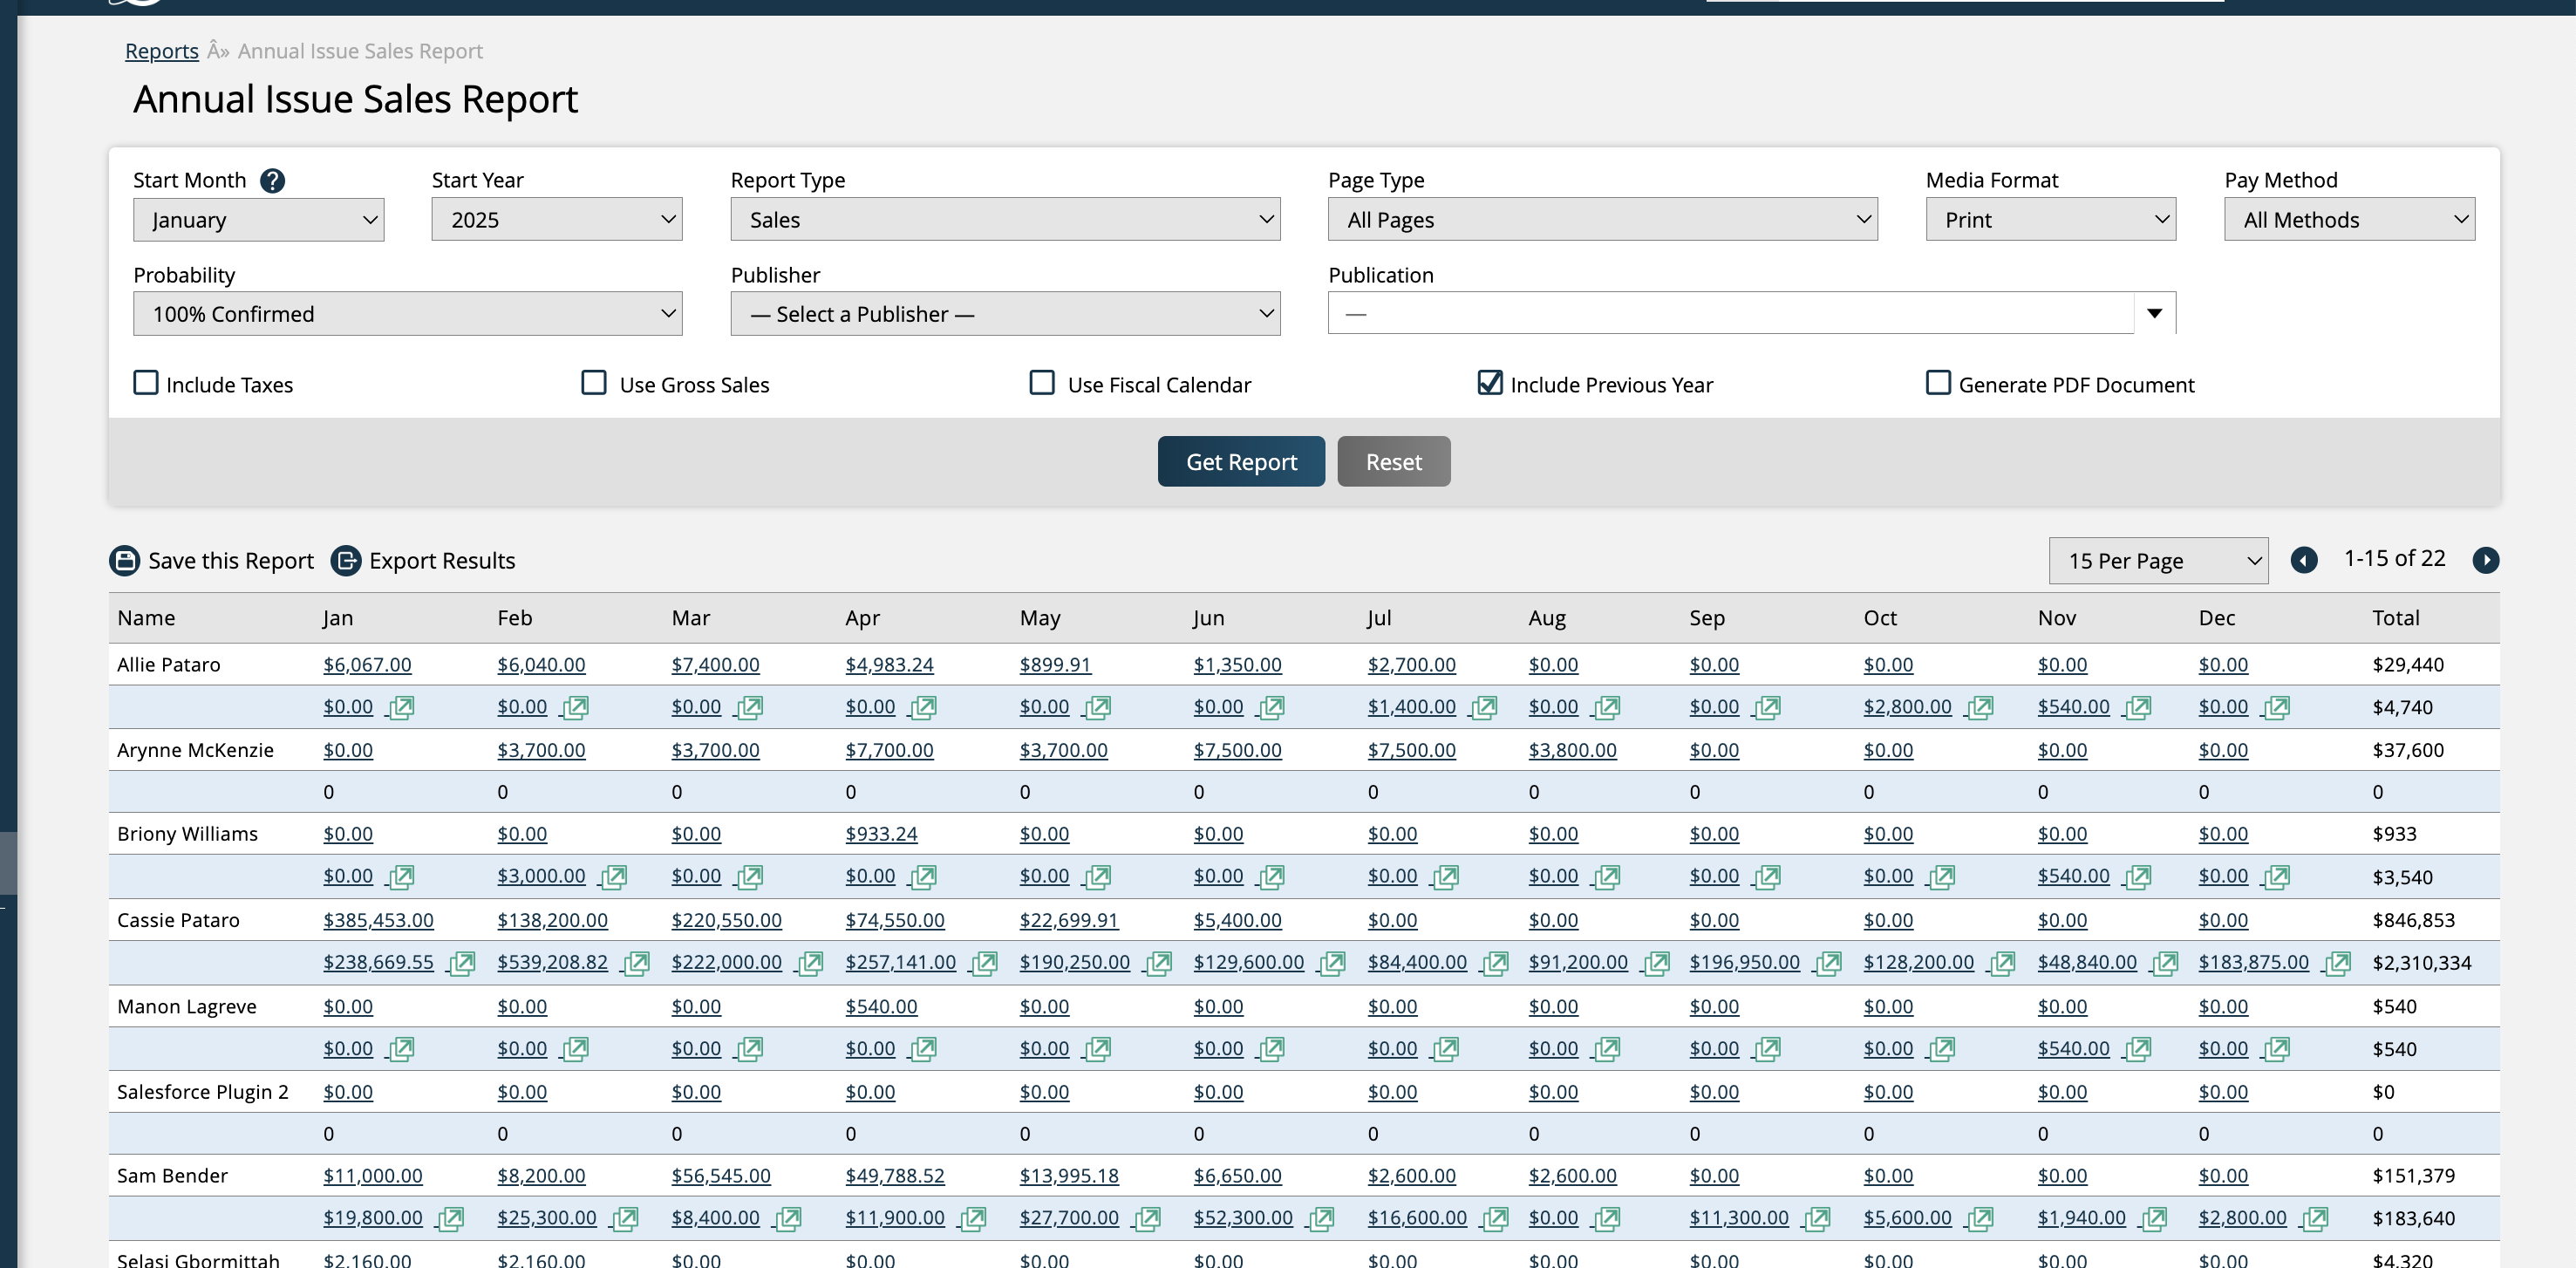
If you run the report with the 'Include Previous Year' option checked, then underneath each rep will be a second row, which displays results for the same rep for the previous year. If you click on the arrow icon next to the previous year's numbers, the system will open the Issue Comparison Report, where you can drill into the details of the yearly differences.
Updated 3/26/2025