Advertising Contract Sales
The report shows the number of sales based on the ad frequency and quarter. Use this report if you want to know how much sales were made based on frequency and want to know how many pages your reps have sold in the current and previous quarter.
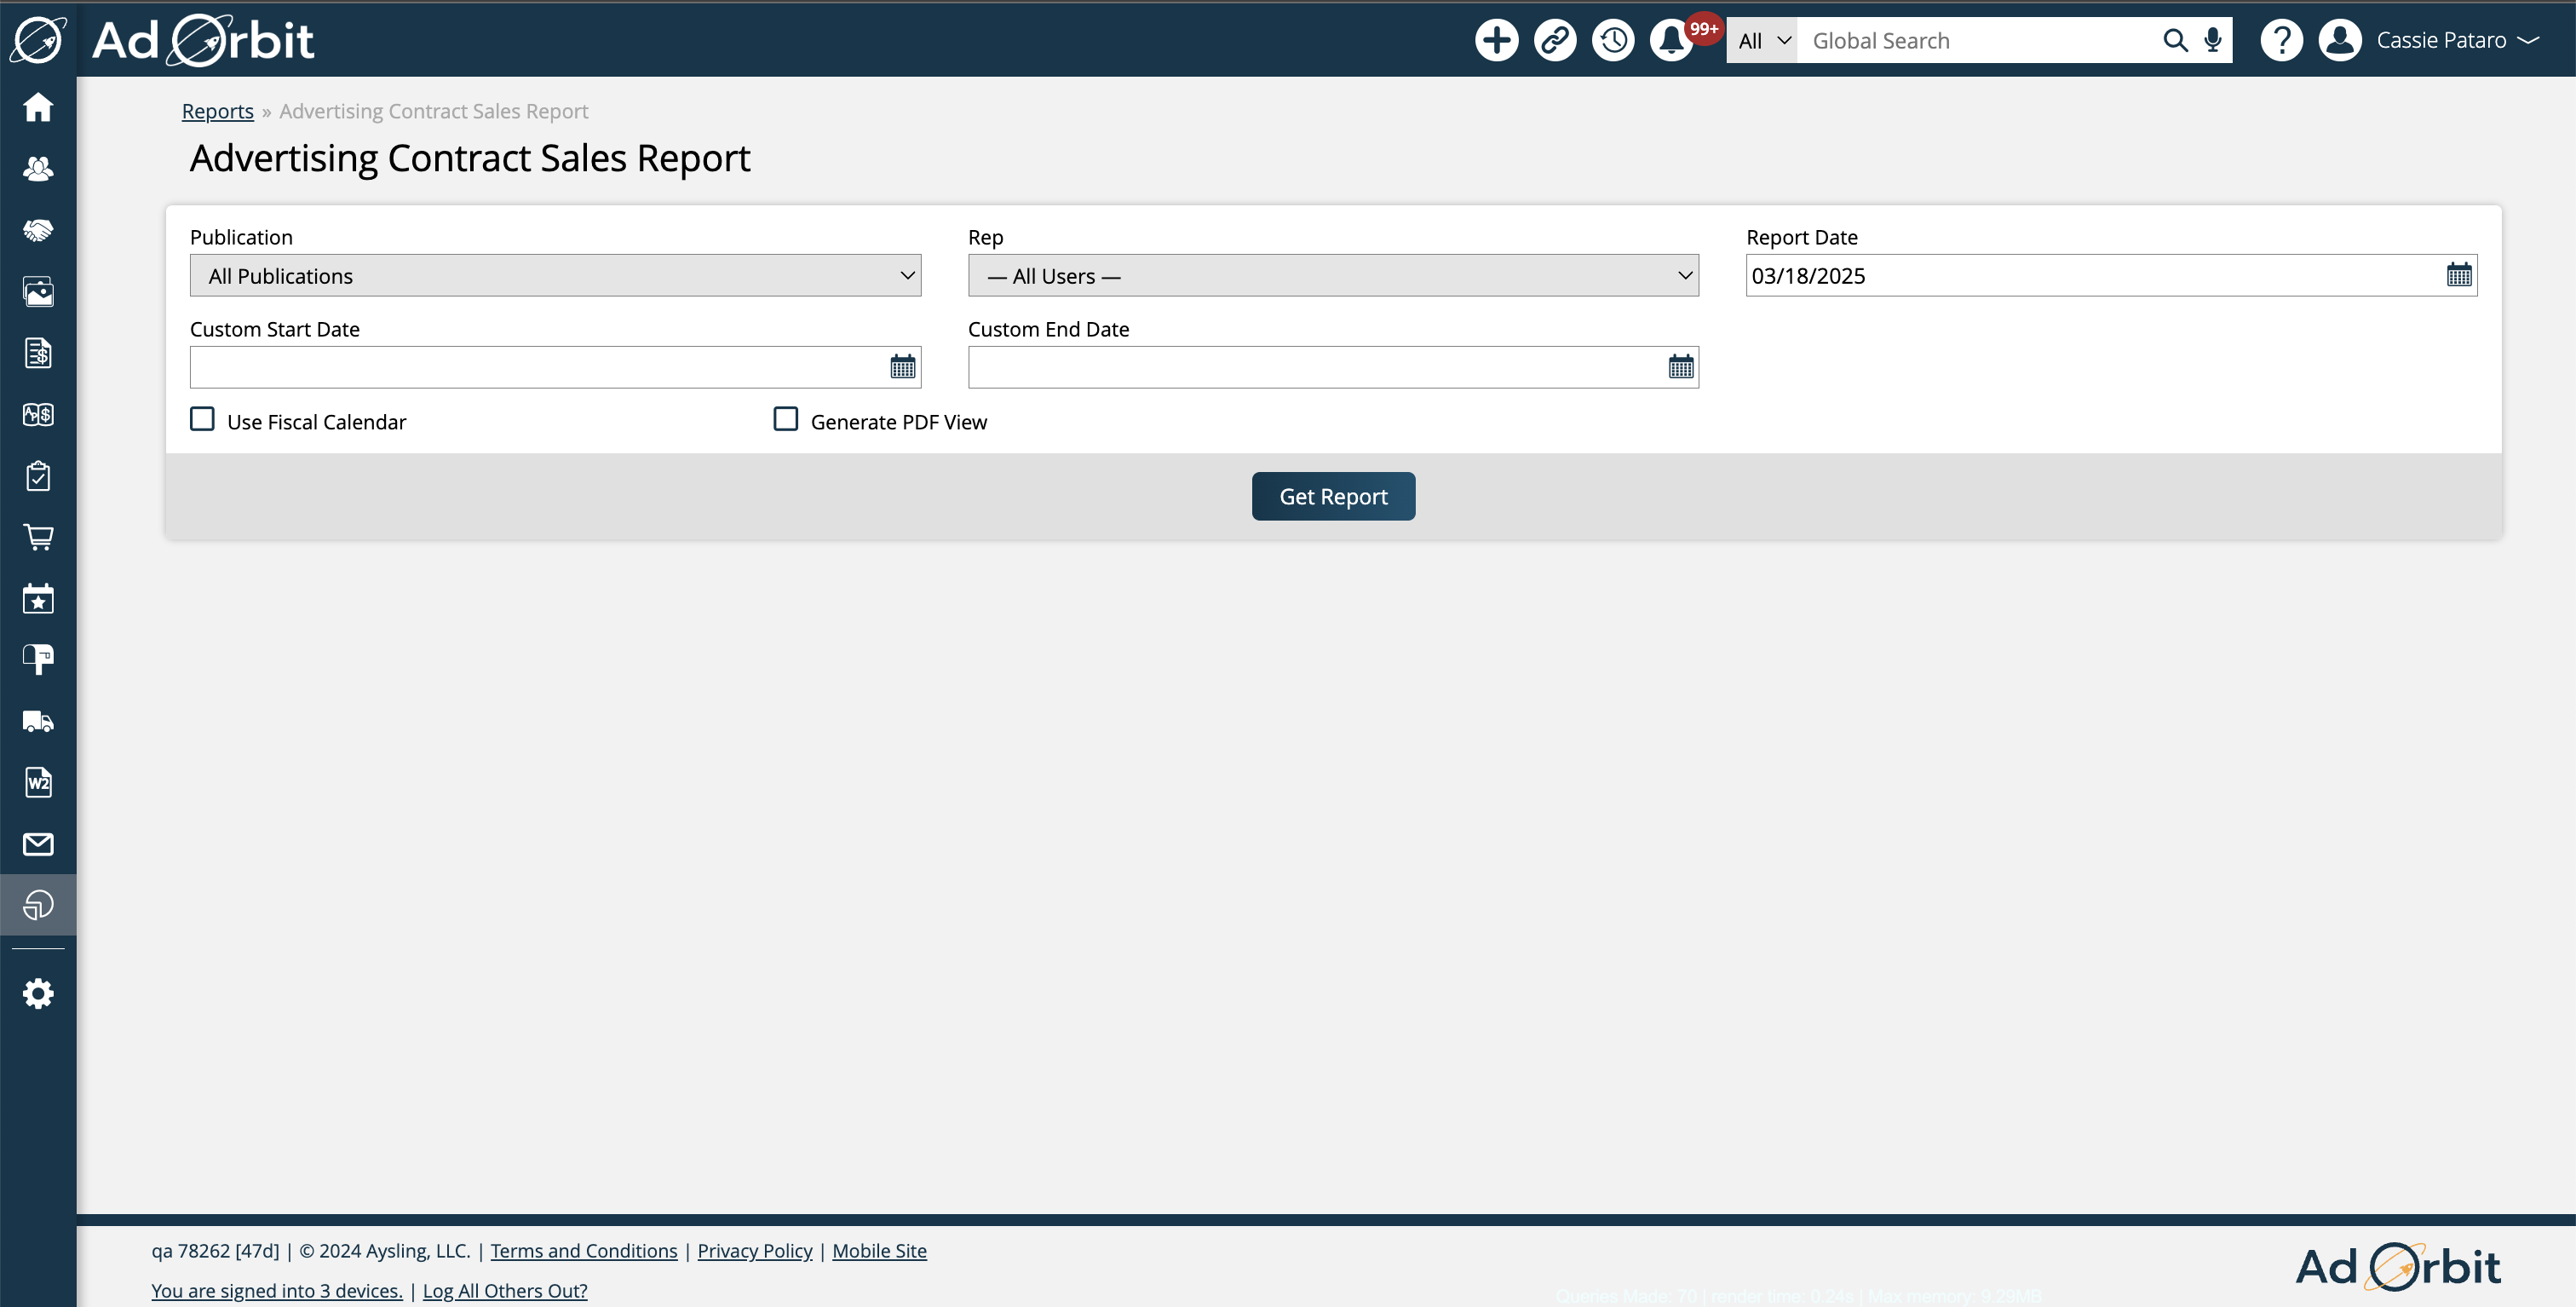
To run the report, you must enter a Report Date, which by default is set to the current date. You are also able to search by Publication and Rep. If you do not select a specific Publication or Rep, then the report will show results for all Publications and Reps. You can also enter a custom date range, and choose to use the fiscal calendar.
Custom Start and End Dates: When there are no custom dates entered, the report will display two tables: Current Quarter Frequencies and Month/Quarter Totals. When values are entered in the custom start and end date fields, there will be a third table showing frequency data for the date range entered. This allows you to easily compare a desired date range to the current quarter or month, such as data from the previous quarter.
Use fiscal calendar: If your fiscal year is not that same as the calendar year, when this option is checked, the report will group your sales and goals number based on your fiscal periods. For example, if your first fiscal period is from 11/01 - 1/31, the fiscal quarter will include all issues with reporting dates between 11/01 - 1/31 and not from 1/01 - 3/31.
When the report is run, you will see the Current Quarter Frequencies table and the Month/Quarter Totals table. If custom dates are entered in the search fields, then you will also see the Custom Date Frequencies table.
The Current Quarter Frequencies table shows the total sales and total pages in the current quarter for each rep selected. The table also breaks down the total sales into different buckets based on the frequencies the sales were for. This allows you to see which frequencies are bringing in the most sales.
The Month/Quarter Totals table displays information about both the current month and quarter and the previous month and quarter for each rep selected. Showing data about both the pages sold and the cash amount, this table easily lets you see how a rep’s current month and quarter sales are compared to their previous month and quarter.
The Custom Date Frequencies table displays identical information as the Current Quarter Frequencies table, but for the custom date ranges entered in the report search. The Current Quarter Frequencies table shows frequency data in a simple and convenient way; however, the table will always display the current quarter. The Custom Date Frequencies table gives you a bit more flexibility in seeing your frequency data. The table can be used to compare previous quarters to the current one, or even narrow down your data to show frequency information about a specific month in the current quarter.