Ad Fractionals
The reports show how many ads have sold based on size. You should use this report if you want to know the number of page sizes you have sold, the APR, and how much each ad size is discounted. You can filter the report by year and publication.
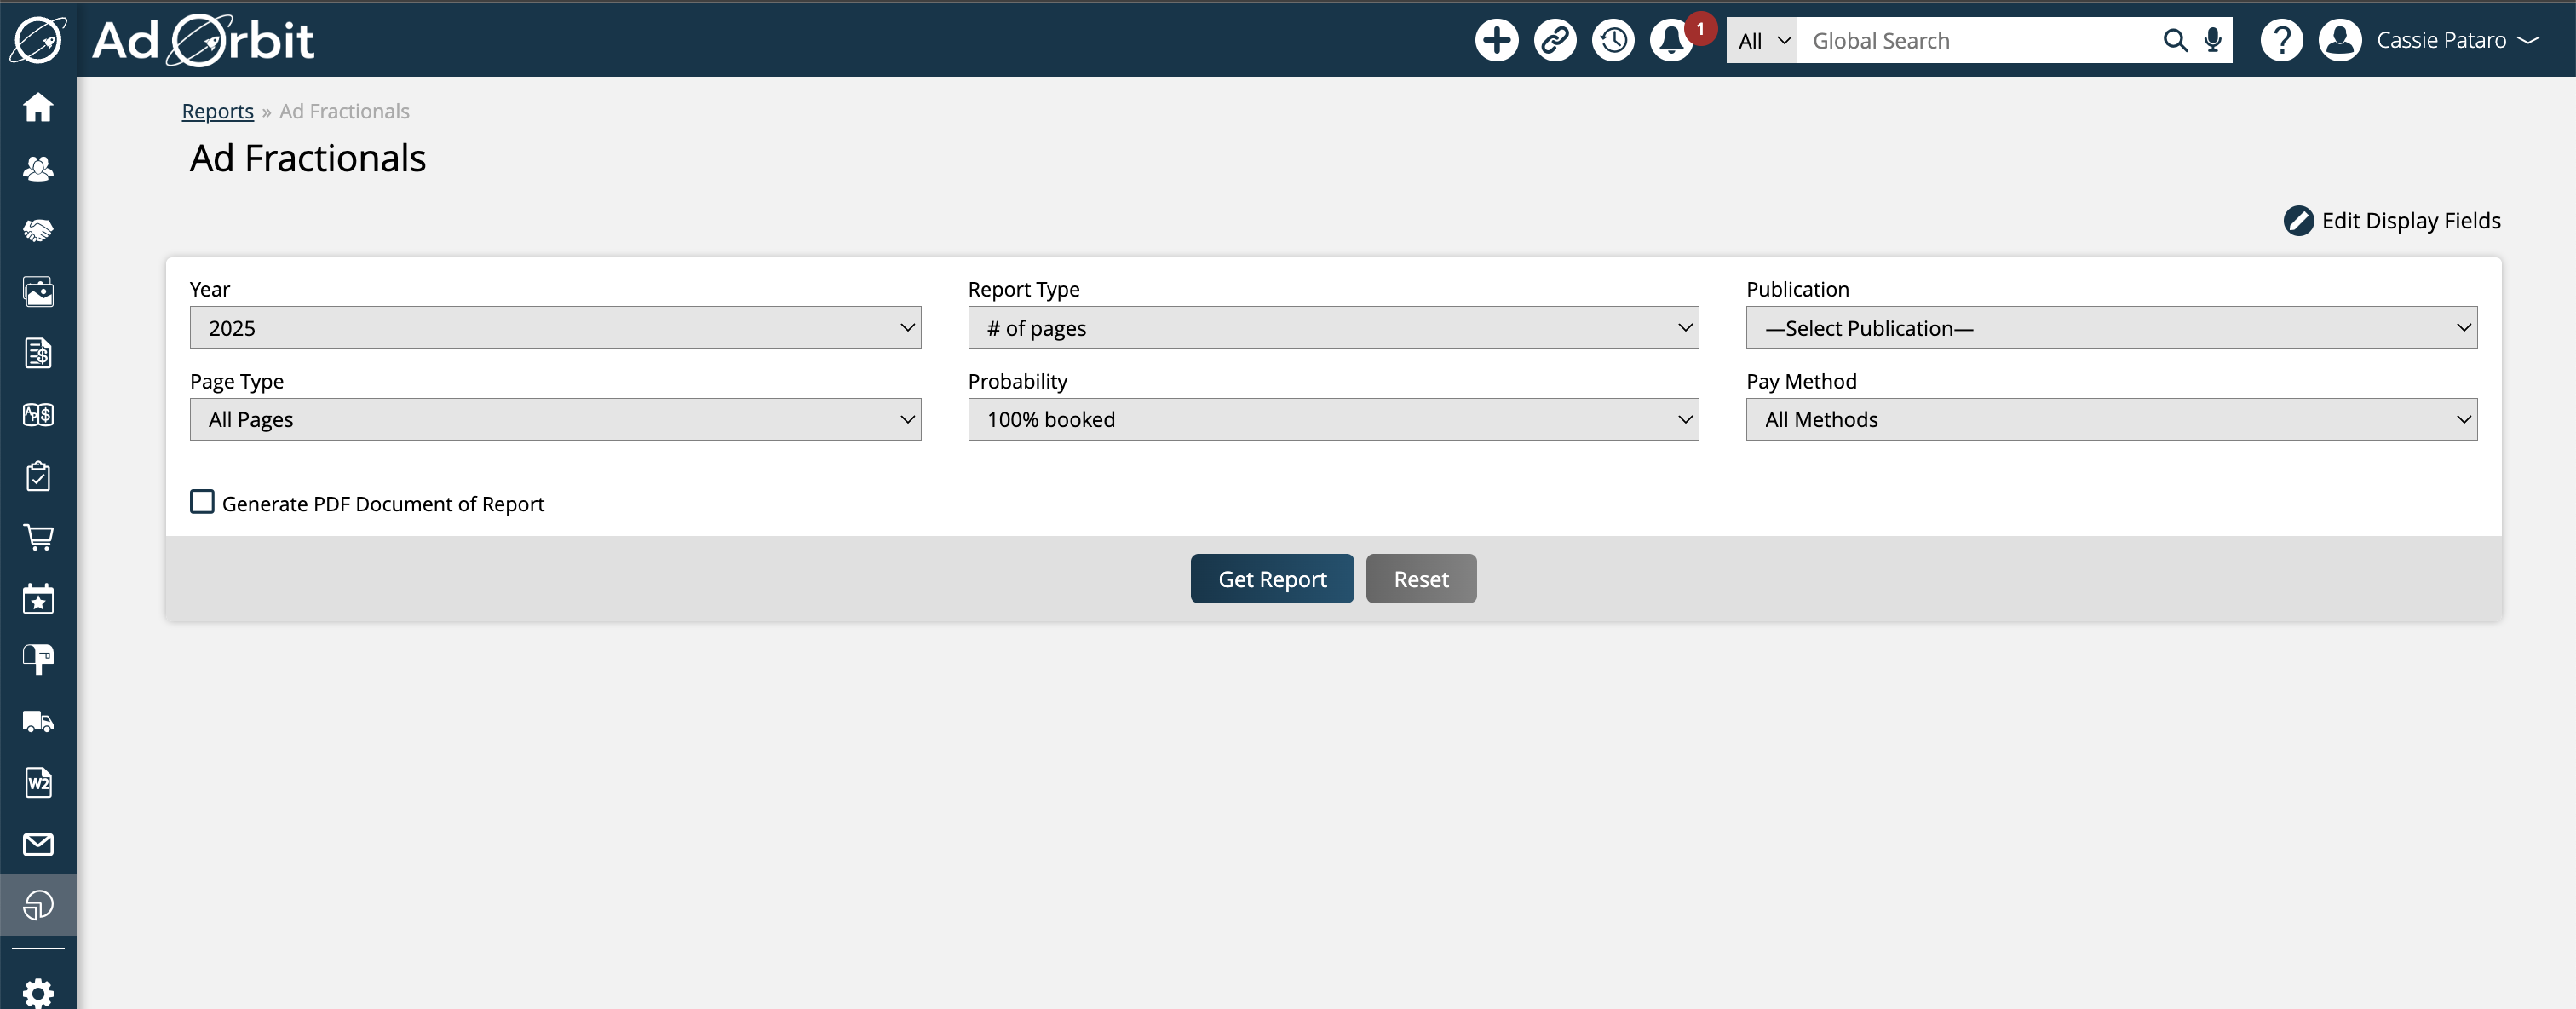
You can change the results that are returned by using the search fields, including year, page type, probability, pay method, and publication. If you do not select a publication, then the report will show results for all publications. The data that will display varies depending on which Report Type you select.

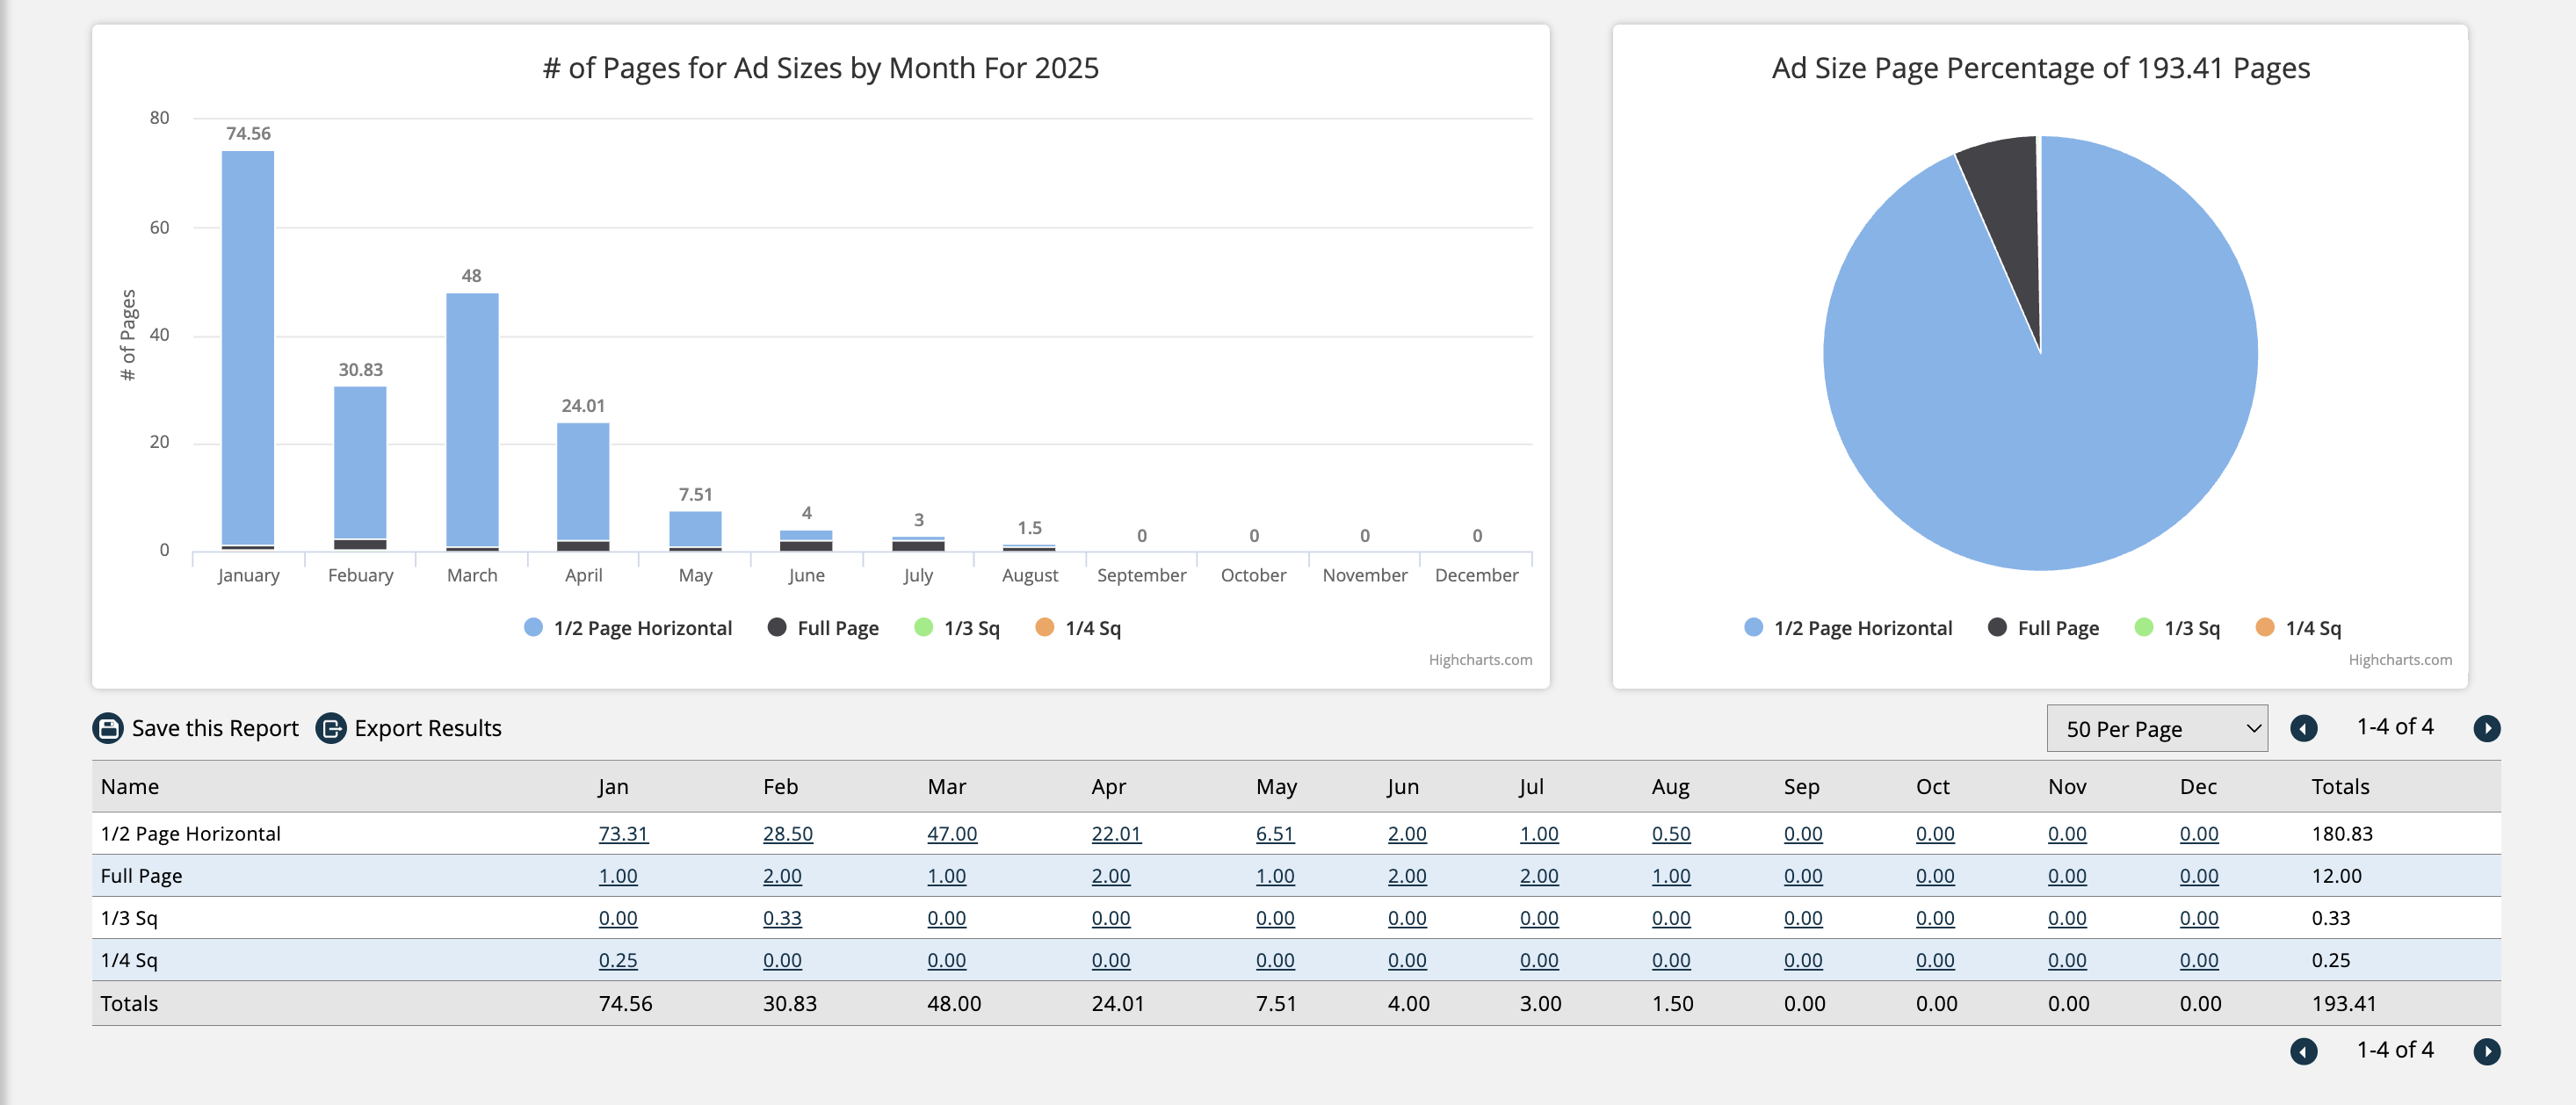
# of Pages: The report will break down the total pages sold by how many pages were sold of each size.
Cash Sales: The report will break down the total cash sales made by ad size.
Avg Price Per Page: The average price per page is calculated by dividing the cash sales by the number of pages. As an example, let’s say that you have both a ½ page horizontal ad size, and a ½ page vertical ad size, with sales for both sizes in the month of June. The system will take your cash sales value in June for your ½ horizontal size, and divide it by the number of pages sold for your ½ horizontal size in June. The system will perform the same calculation for your ½ vertical ad size. These numbers are what will show up in the data table when using the Avg Price Per Page report type for June. The numbers that are displayed in the bar chart for this report type, are calculated by adding together all of the individual ad size averages for that month, and dividing the total by how many averages there are. For example, let’s say your average in June for your ½ horizontal size ended up being $1,000, and your average for the ½ vertical size ended up being $3,000. The overall average for the month of June, then, would be $2000, or (1000 + 3000)/2.
Avg % Rate Card: The report will break down the rate card price, versus the actual prices items get sold for. For example, if an item on your rate card is worth $1000, and two of those items get sold, one for $700 and one for $900, then the average selling price would be $800. In the report, you would see 80%, because the item is getting sold on average at 80% of its rate card price.
Paid vs Comped: When filtered this way, the report will show a percentage for each month of how many sales were paid, as compared to how many were comped. For example, if no sales were comped, then you will see a 100% show up.
Unpaid Invoices: The report will show the total unpaid invoice cash amount per month.
Barter: The report will display any barter amounts recorded based on ad size and month.
Depending on which Report Type you choose, the data will either show up as both a bar chart and a pie chart, or as just a bar chart. No matter which Report Type is run, there will always be a data table at the bottom of your results.

Bar Charts: The bar charts in this report break down the data based on month, allowing you to quickly see how your ad size data has changed or stayed the same over the course of the year. Hovering over any of the bars will provide you with more detailed information, and will show the exact numbers for each ad size in the chosen month.
Pie Charts: In this report, when a pie chart is displayed, it is to show data for the year as a whole, in comparison to the bar chart which breaks the information down by month. The pie charts are great for getting a quick summary of the data. Hovering over one of the pie pieces will show you the specifics of that ad size, as well as its percent of the total.
Data Table: The data table is the most interactive piece of the report results. You can choose how many results display per page, and use any of the table headers to sort by that column. The table displays the same data as the bar chart – the ad size data broken down by month – as well as displaying totals. The main difference between the table and the bar chart, is that the numbers in the table also serve as quick links. By clicking on a number in the table, you will be redirected to the Issue Snapshot Report, which will have specific search fields automatically filled in based on your Ad Fractionals Report. For example, if you clicked on a number in the table for a ½ page horizontal ad, then that ad size would automatically be chosen on the Issue Snapshot Report.
Note
The Unpaid Invoices Report Type does not redirect users to the Issue Snapshot report. Instead, when this report type is chosen, the quick links in the table will bring you to the Invoices Search page.
Updated 3/20/2025