Allocation Report
The Allocation Report shows you how many hours and tasks your team is assigned over a period of time. The report is a good way of find out if you have people available for upcoming projects, who maybe overbooked, or who could is under utilized.
The filters are set up to help find the people you need for a project. You can filter by name, department, position, and user groups.
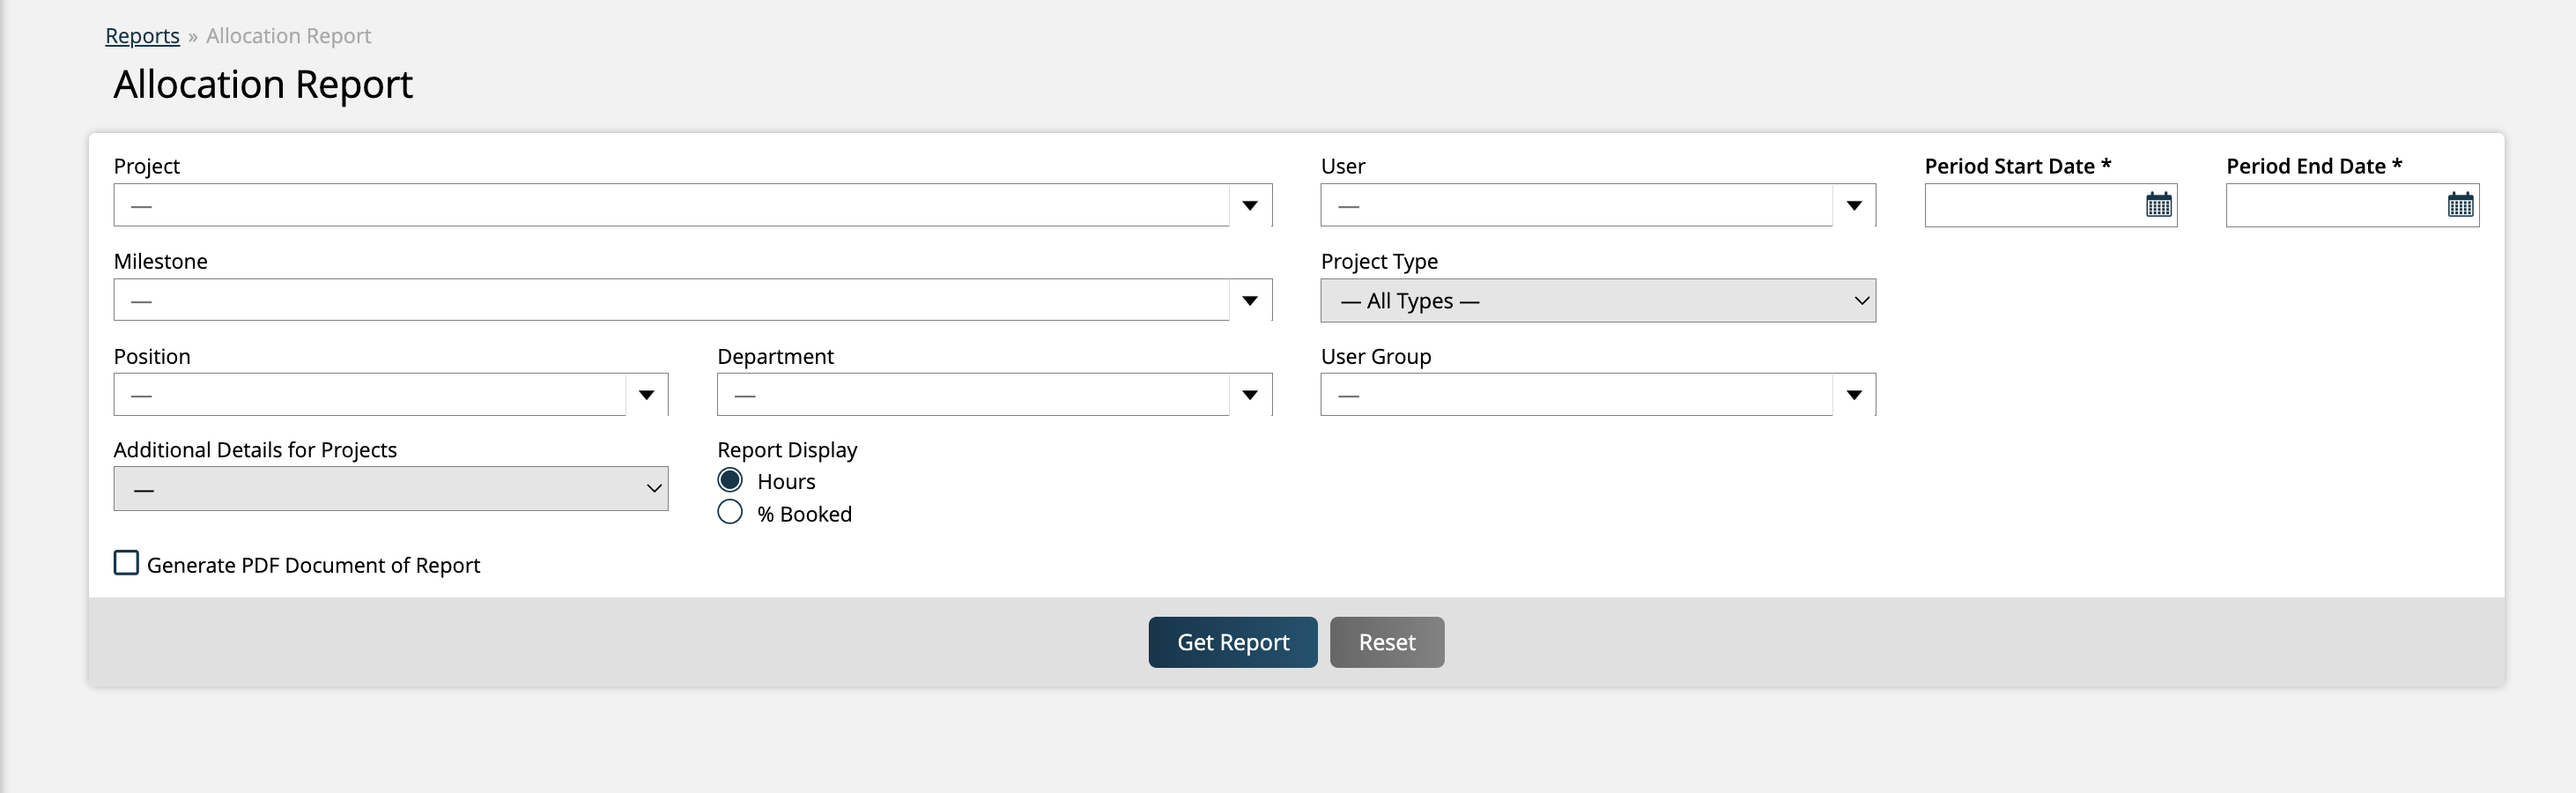
The period filter is the only required filter on the report. You need to specify a range for the system to find all tasks where users are currently assigned and the hours assigned. The results will display differently depending on the length of a range you select.
If the date range is less than 21 days, days are displayed.
If the date range is more than 21 days, weeks are displayed.
If the date range is more than 182 days, then months are displayed.
If the start or end period is partial (starts after the 1st of a month and ends before last day of the month), different ranges will display and the start/end so the rest of the date periods are even.
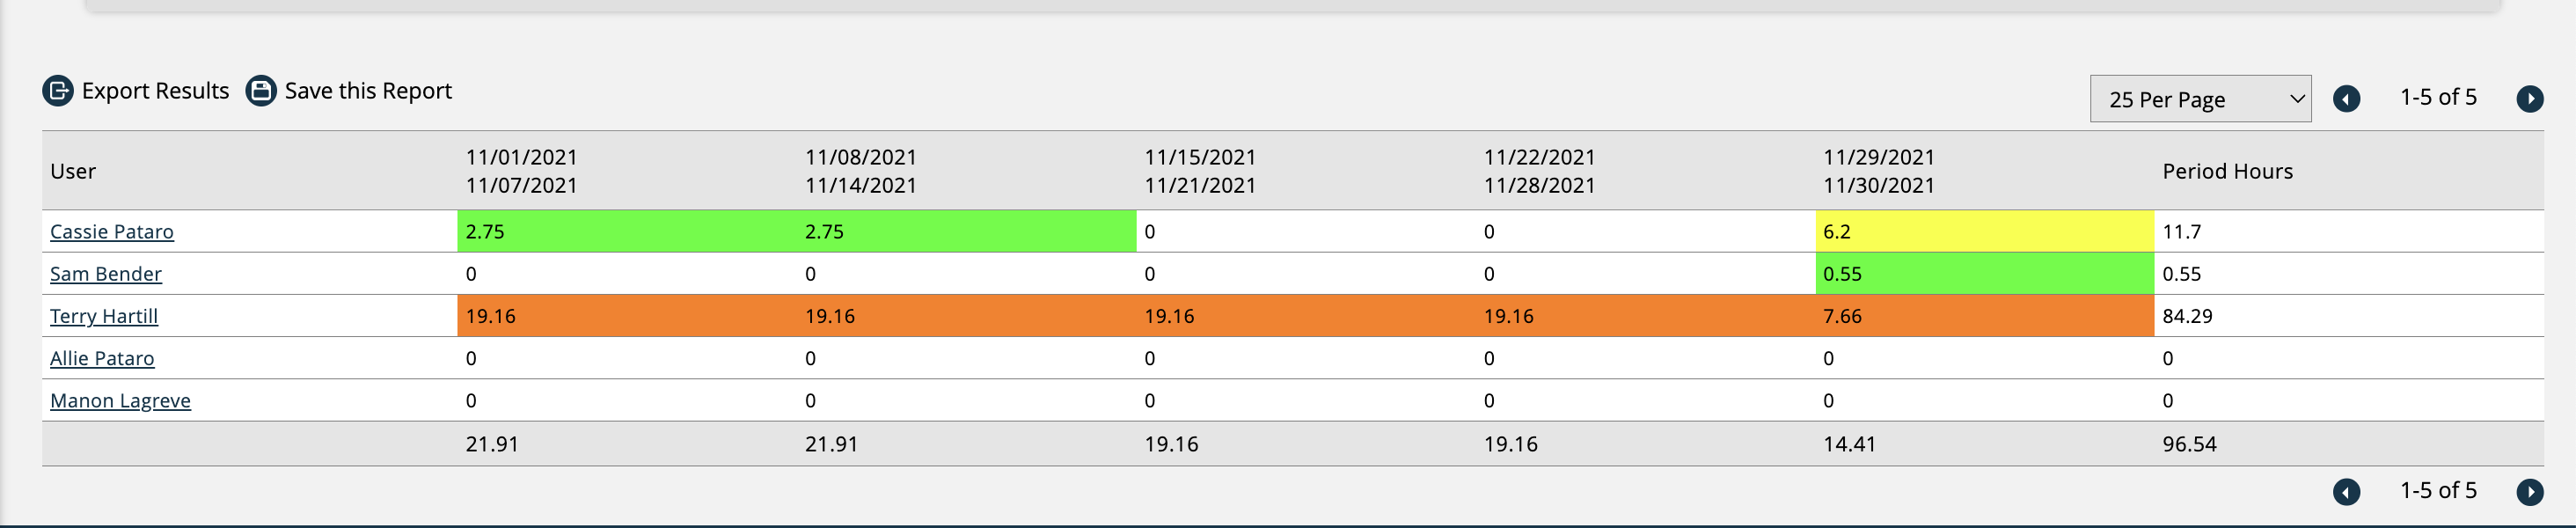
There are two display options for the report: Hours or % Booked.
When you use the Hour display option, the table will show the number of hours each user is booked on each date. If the time range is large enough, these hours will be for a weekly or monthly total.
When the % Booked display is used, instead of hours, you will see percentages each user is booked for, rather than the number of hours they are scheduled to work.
The % Booked view is helpful if not everyone on your team works an 8-hour day. For instance, if you have some staff members who work 6-hour days, you can see how much of their time they are scheduled for, rather than doing mental math, and remembering which employees work which hours.
Each row of the report will show a user if they are assigned a task in the period range. You will not see a user if they are not assigned to any task. The system will break up the assigned hours based on the time bucket.
The report is color-coded to reflect how busy each user is. There are ten colors that show a user’s availability – one color for every 10% booked. Green shades mean a user has a lot of available time, yellow and orange mean they are somewhere in the middle, and red means the user is booked or over-booked.
Tip
You can set up your own color-codes by adjusting your allocation levels.
If you want to see a detailed breakdown by task, click on the user's name and you will see the Allocation Details pop-up with all the projects and tasks the users are assigned in the period.
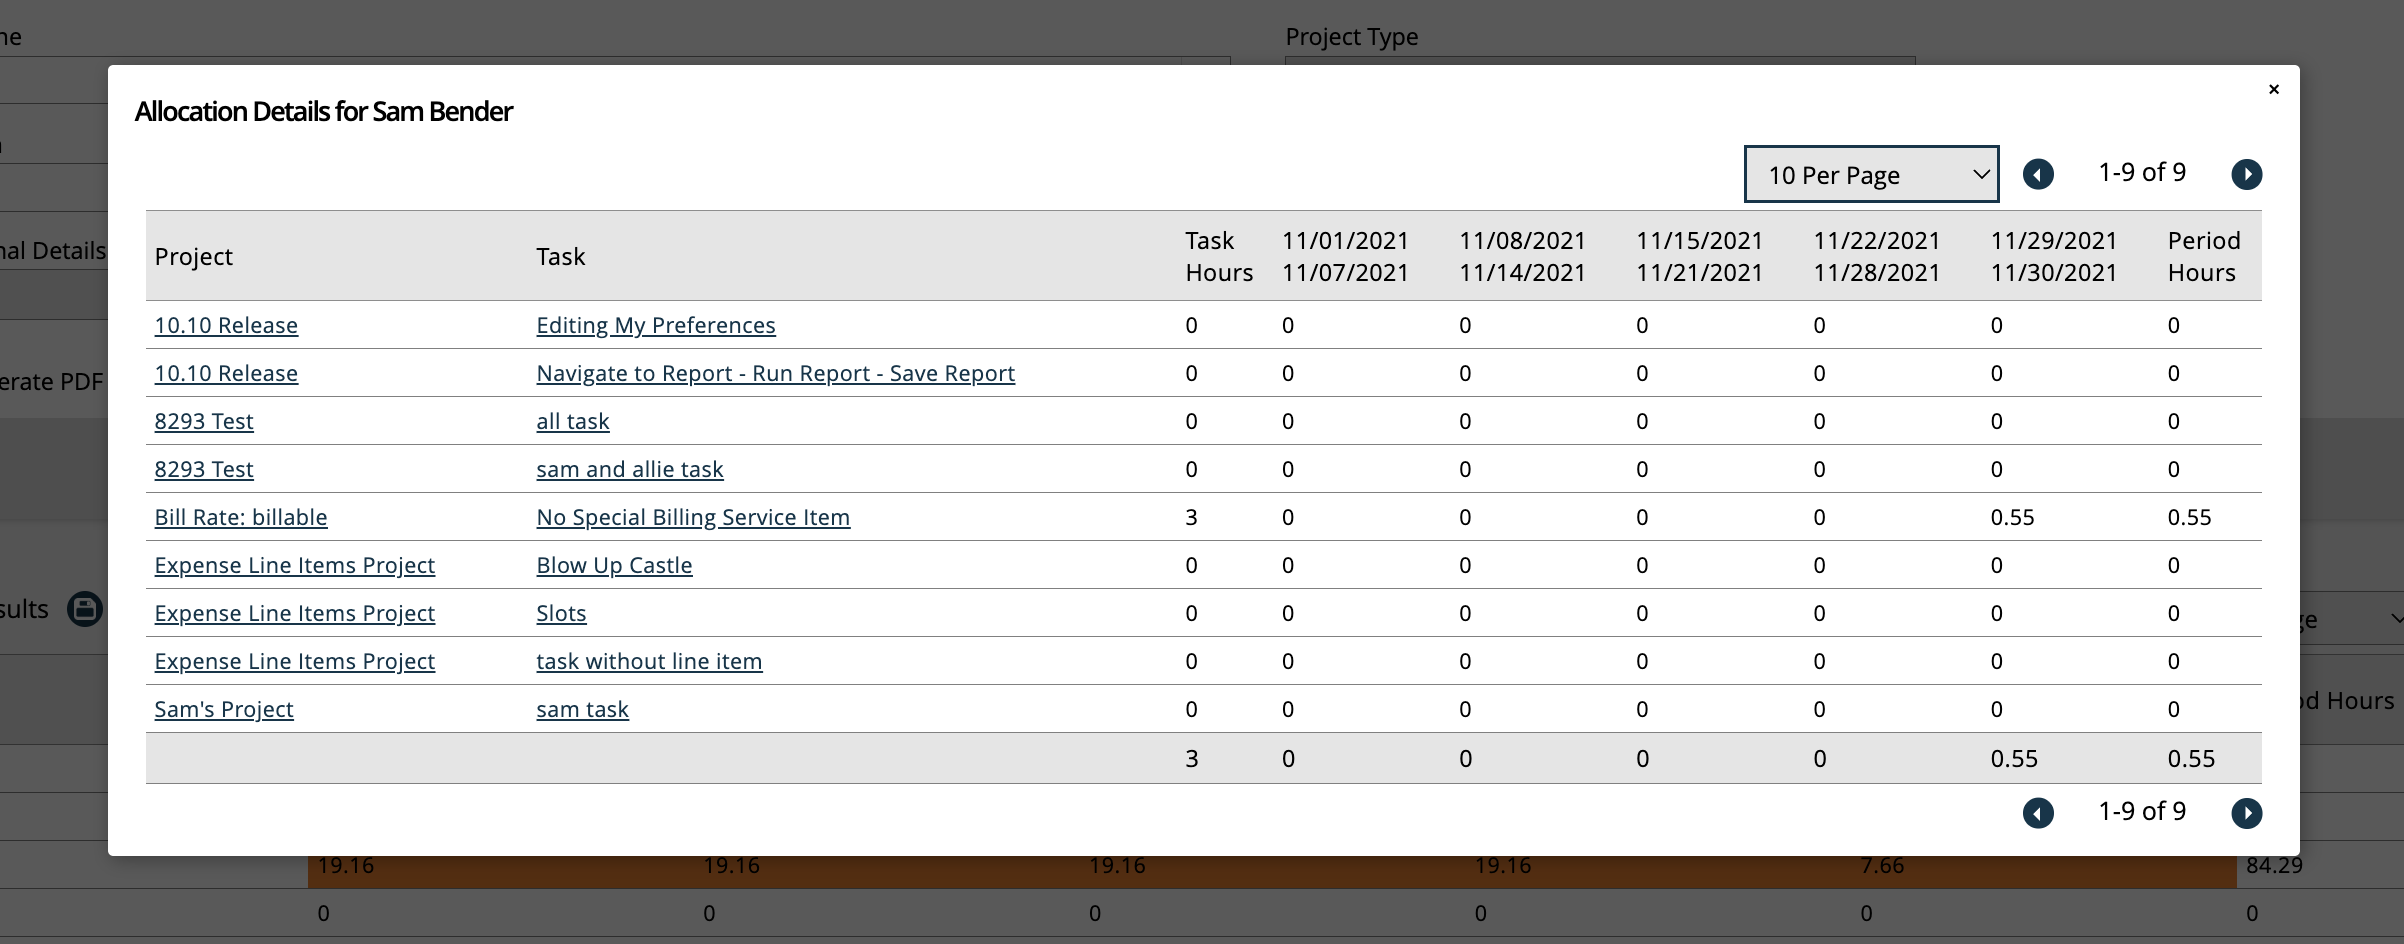
The Task Hours list the total numbers of hours assigned to the task.
Each day will list the number of hours estimated for the day based on the hours assigned to the task and the number of days assigned to the task.
The Period Hours list how many hours are allocated to the user for the task.
Updated 9/29/2025