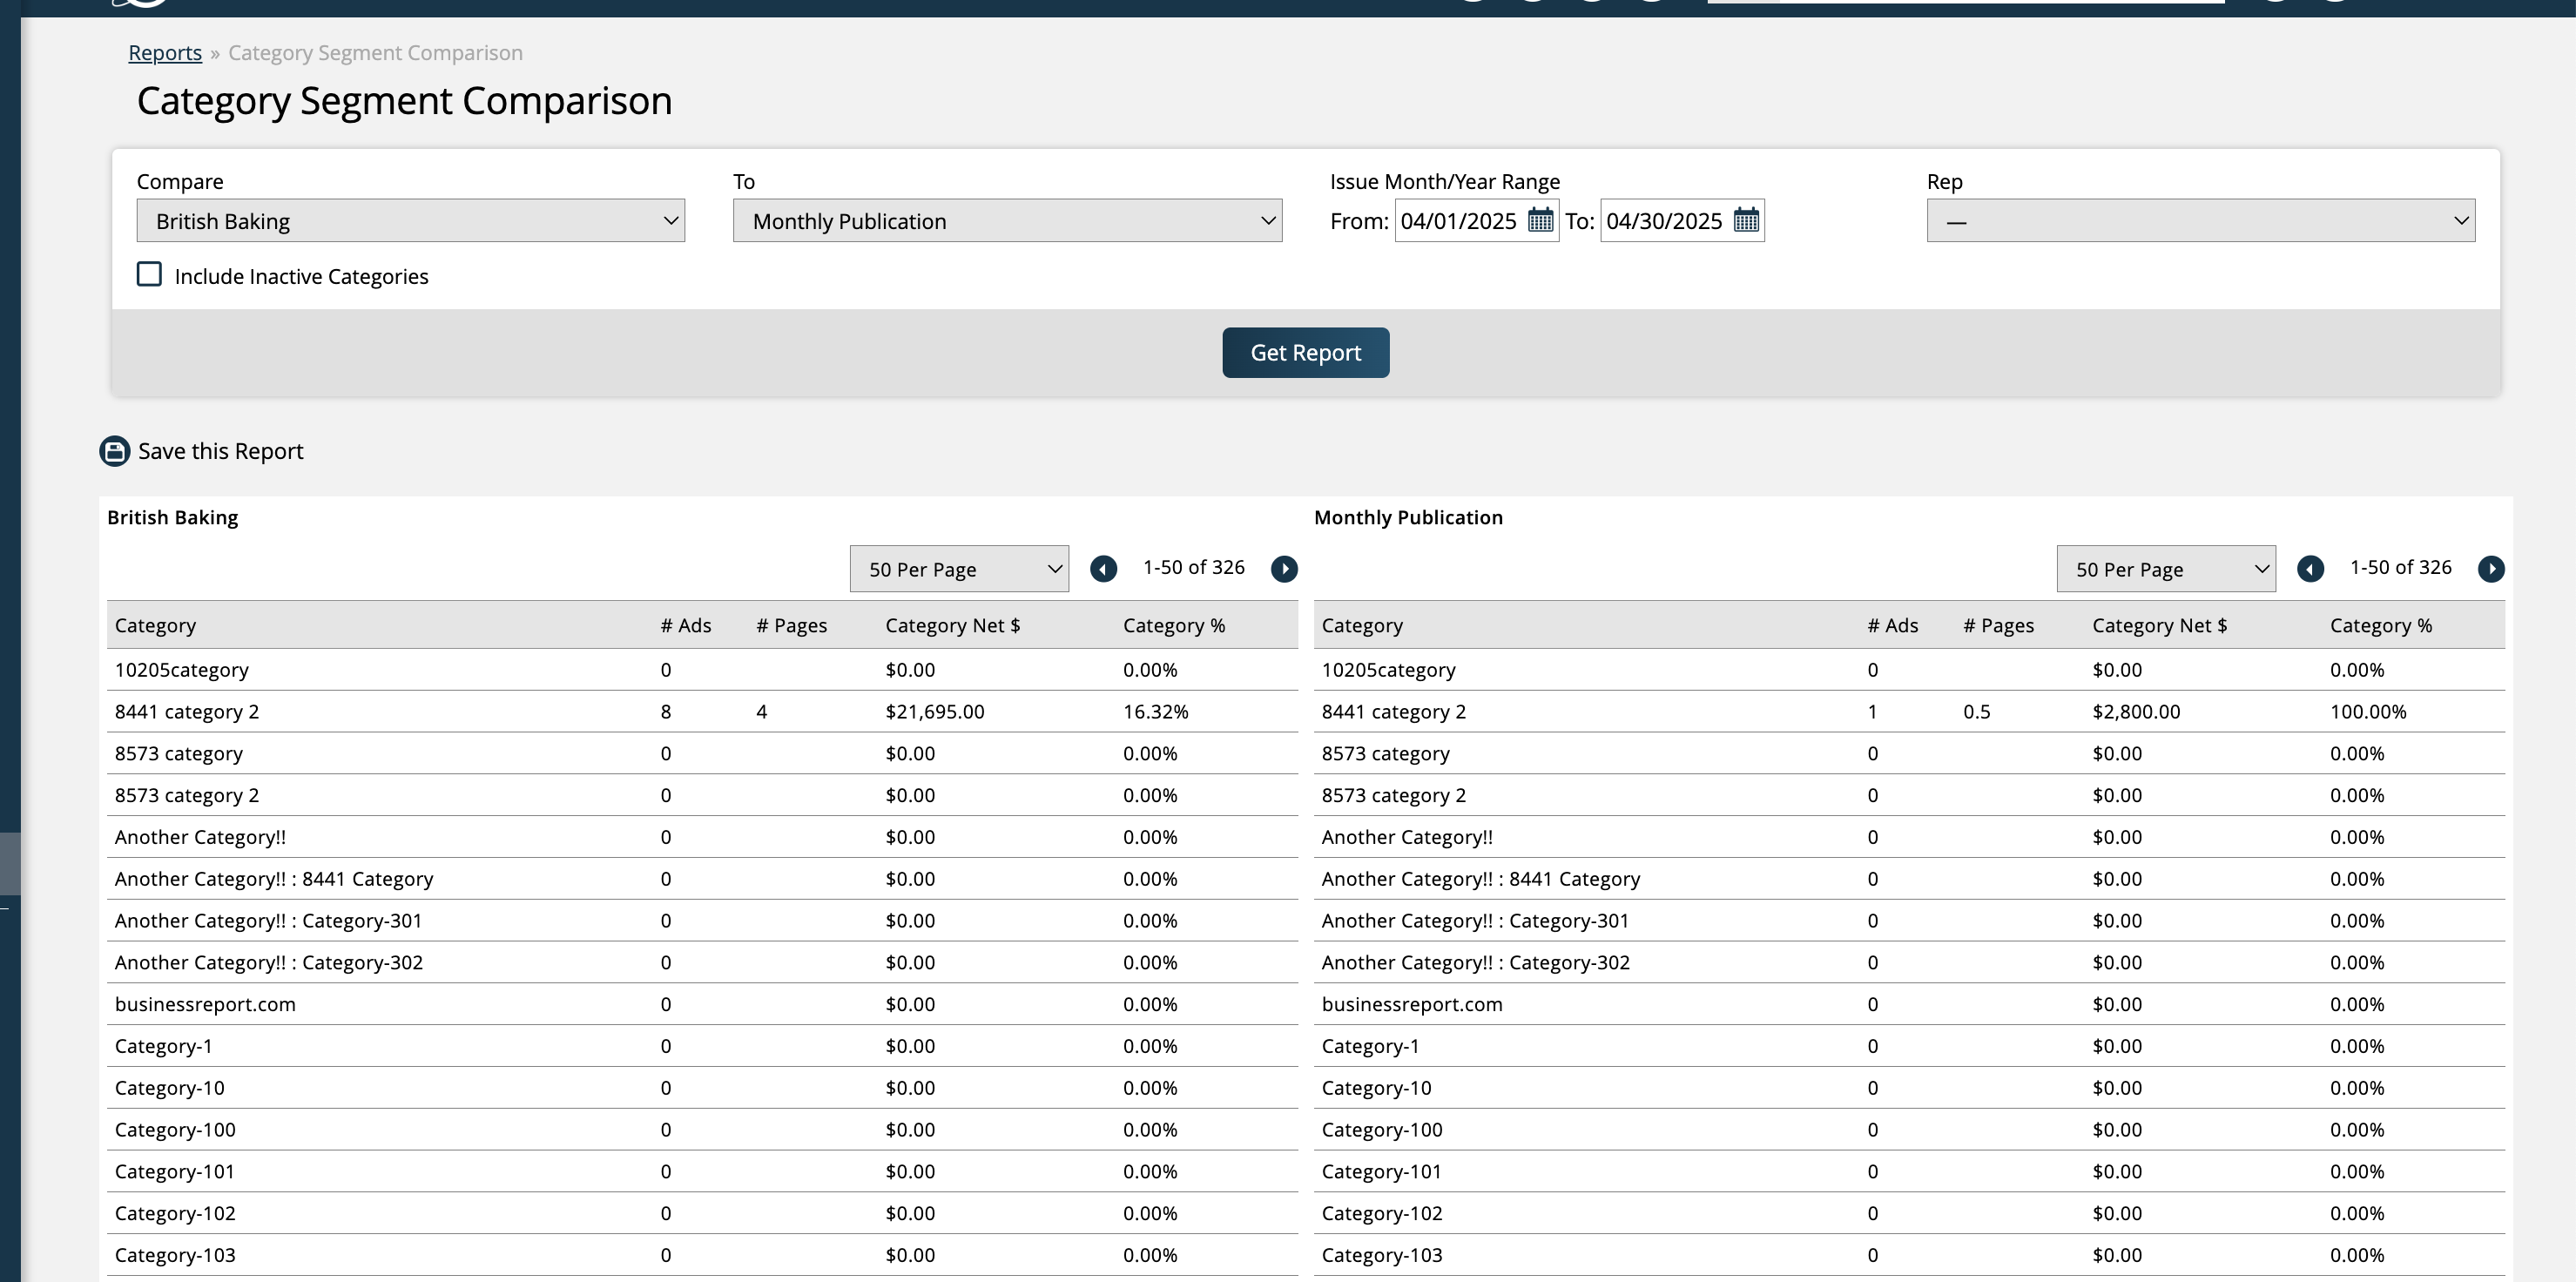
The report shows the total number of pages and value of ads sold by company category. You can compare across publications, timeframe, and rep. Use this report to see how well category sales are doing between publications.
To run the report, you must enter an Issue Month/Year Range, and can select specific publications to compare. If you have the permission to view all users, then you can also search for a specific sales rep. If you do not have the view all users permission, then the rep search field will automatically be filled out with your name. You also have the option to include or exclude inactive categories.
Results
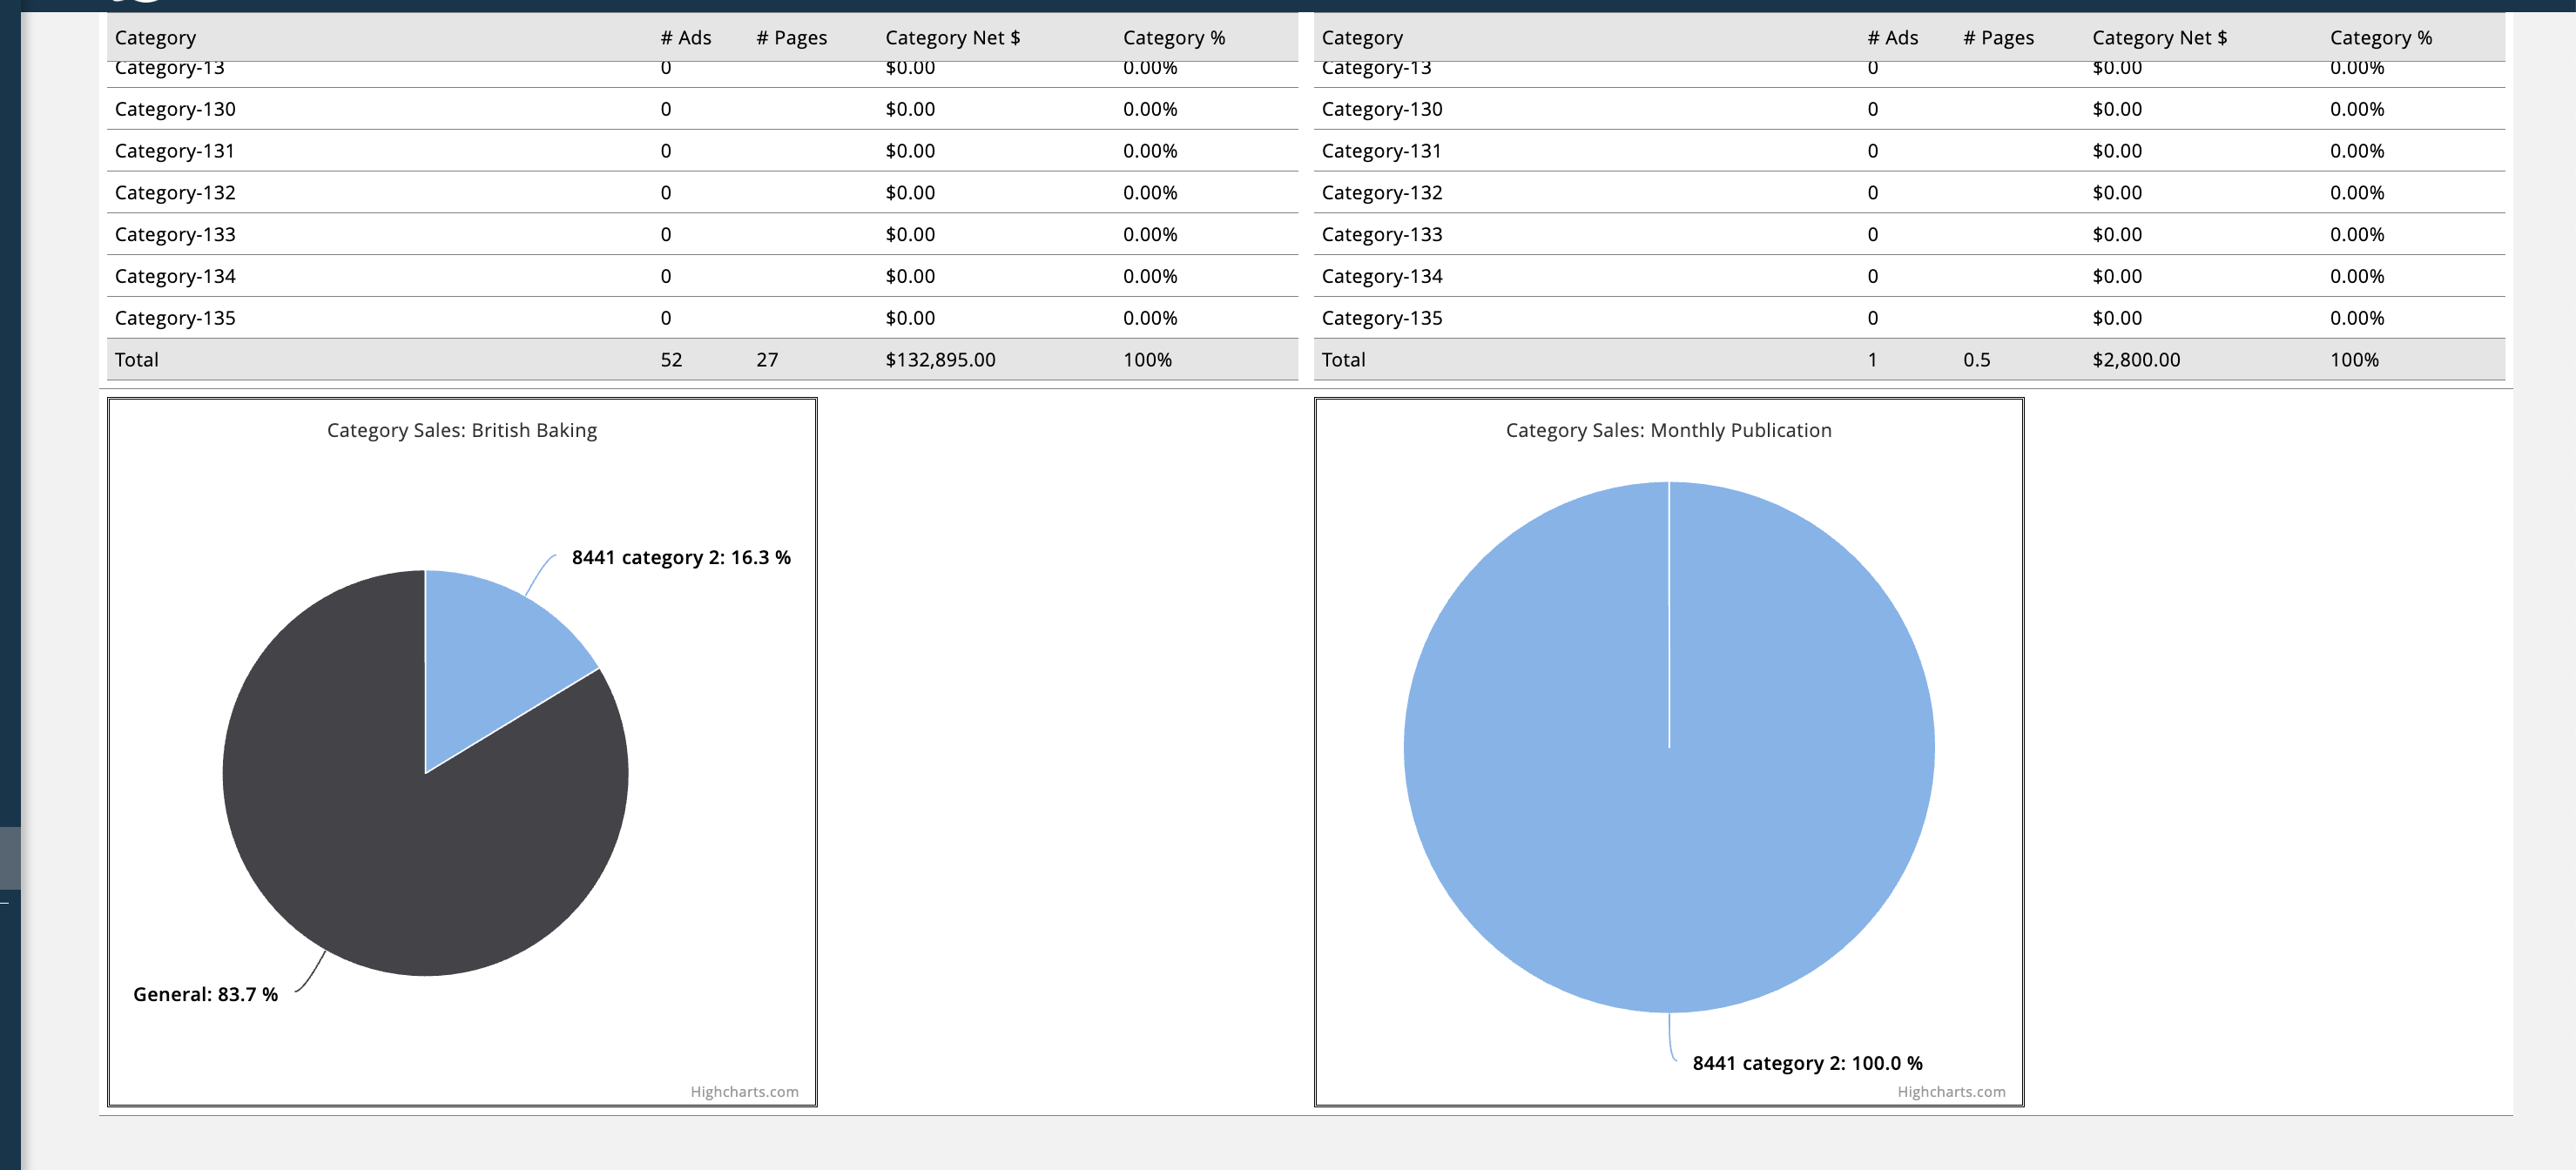
The results will show data for both of the publications you chose to compare, for the selected date range and rep. You will see the number of ads, number of pages, category net and category percent for both publications chosen. The category sales are also presented in a pie chart format, so you can quickly view how your categories are performing from one publication to the next.