Widgets
The Available Ad Spaces & Positions widget shows a list of available ad spaces and positions per publication and issue, in a convenient table format. This widget essentially brings the Open Pages Report right to your Dashboard for better accessibility.
To add the widget to your dashboard, make sure you are in edit mode. Click Add Widget in the upper right corner. You will get a window that shows widget types. View the Production type and select Available Ad Spaces & Positions.
This widget will not display any information until you configure it, by clicking on the gear icon in the upper right corner. Once in edit mode, you can name your widget and add it to the dock for easy access. There are two filters you need to choose – Publication and Type. If you choose a print publication, then you can either choose position or size for the type. If the publication is digital, there will only be a size type. If you do not choose an issue, then the widget will display information for all of the active issues in the selected publication.
The positions and sizes you see are determined by how your publications are set up.
When you have the positions type chosen, the table will display all open, pending, and sold ads for that specific position.
When you have the size type chosen, the table will show all of the available inventory, how many ads have been sold, and how many have been placed. If you use free form pagination, then some of your ads may not have sizes assigned to them. In this case, those pages will display in the ‘No Ad Size’ row.
The data for this widget is pulled from the Open Pages Report, which you can navigate to by clicking on the ‘view details’ icon in the upper right corner of the widget.
Access to this widget is determined by your permissions.
The Contract Sales widget shows the rate between actual contract sales and the total goal. The widget displays the chosen date range, your goal, the current sales, and the remaining sales in order to reach your goal. Contract Sales include sales from all products on orders and uses the sales date. You can find a more detailed version of the data in the Daily Order Sales report.
To add the widget to your dashboard, make sure you are in edit mode. Click Add Widget in the upper right corner. You will get a window that shows widget types. View the Sales type and select Contract Sales.
Once you have added the widget, you can name it, add it to your dock, and change the date range by clicking on the gear icon in the upper right corner. You can either use the current month, or you can customize the results by choosing your own date range based on the month and year. Once you are done editing, click save.
The data for this widget is pulled from the Daily Order Sales report, which you can navigate to by clicking on the ‘view details’ icon in the upper right corner of the widget.
Access to this widget is determined by your permissions.
The Current Issue’s Contract Sales widget is a gauge for the current issue’s total ad contract goal. The widget displays the chosen date range, the current issue sales goal, the current sales, and the amount remaining to reach the goal.
To add the widget to your dashboard, make sure you are in edit mode. Click Add Widget in the upper right corner. You will get a window that shows widget types. View the Sales type and select Current Issue’s Contract Sales.
By clicking on the gear icon in the upper right corner, you can name your widget and choose whether or not to include orders that are at 95% and 100% in the results. You can also change the date range by choosing either ‘Use Current Month’ or by creating a custom date range. From the edit pop-up, you can also add this widget to your dock for easy access. Once you are done editing, click Save.
Access to this widget is determined by your permissions.
The Forecast widget allows you to see both a detail and summary view of opportunities by month and rep. This can be helpful to see how your sales reps are performing. The forecasts and opportunities in your system are determined by the pipelines and confidence levels you have configured, and are dependent on your company. Forecasts and confidence levels can vary dramatically by how each company operates.
To add the widget to your dashboard, make sure you are in edit mode. Click Add Widget in the upper right corner. You will get a window that shows widget types. View the Sales type and select Forecast.
By clicking on the gear icon in the upper right corner of the widget, you can name it and filter results by a user, depending on your permissions. You can also change the date range by choosing ‘Use Current Month’ or you can create a custom date range. From the Edit pop-up, you are also able to add this widget to your dock for easy access. Click save once you are done editing.
There are two different views for the widget, depending on how large you make it in your dashboard.
The smaller, summary view displays the date range and the user filter, total number of opportunities, total forecast amount, and total weighted forecast amount.
The larger, detail view displays the company name, opportunity name, forecast owner, primary rep, item, and when the forecast was created, in addition to all of the summary information. In the detail view, you can navigate to a company page by clicking on the company name. You can also edit the forecast opportunity from the widget by clicking on the ellipsis.
The Future Sales widget displays future sales based on the delivery date of the product. The delivery date is based on the product type and your system configurations. The widget will show a total future sales amount and further break it down by month in an easy to read bar chart. By hovering over each bar, you can see the total sales for that month.
To add the widget to your dashboard, make sure you are in edit mode. Click Add Widget in the upper right corner. You will get a window that shows widget types. View the Sales type and select Future Sales.
By clicking on the gear icon in the upper right corner of the widget, you can edit the widget name and filter the results by the number of upcoming months. Depending on your permissions, you will either see your future sales or be able to filter by user. You are also able to add this widget to your dock for easy access. Click Save once you are done editing.
The Impression Inventory widget brings the Impression Inventory Report directly to your dashboard. The widget can display your non-GAM impression inventory in either table or pivot format, depending on how you want to view the data.
To begin, go to your Dashboard. The dashboard is your home page when you log in, or you can click on the Ad Orbit icon in the upper left corner of your page to navigate there.
If your System Configuration 'Enable User Widget Permissions' is turned on, you will need the User Permission 'Impression Inventory' in order to access the widget.
To add the widget, your dashboard needs to be in edit mode. Click on Edit Dashboard.
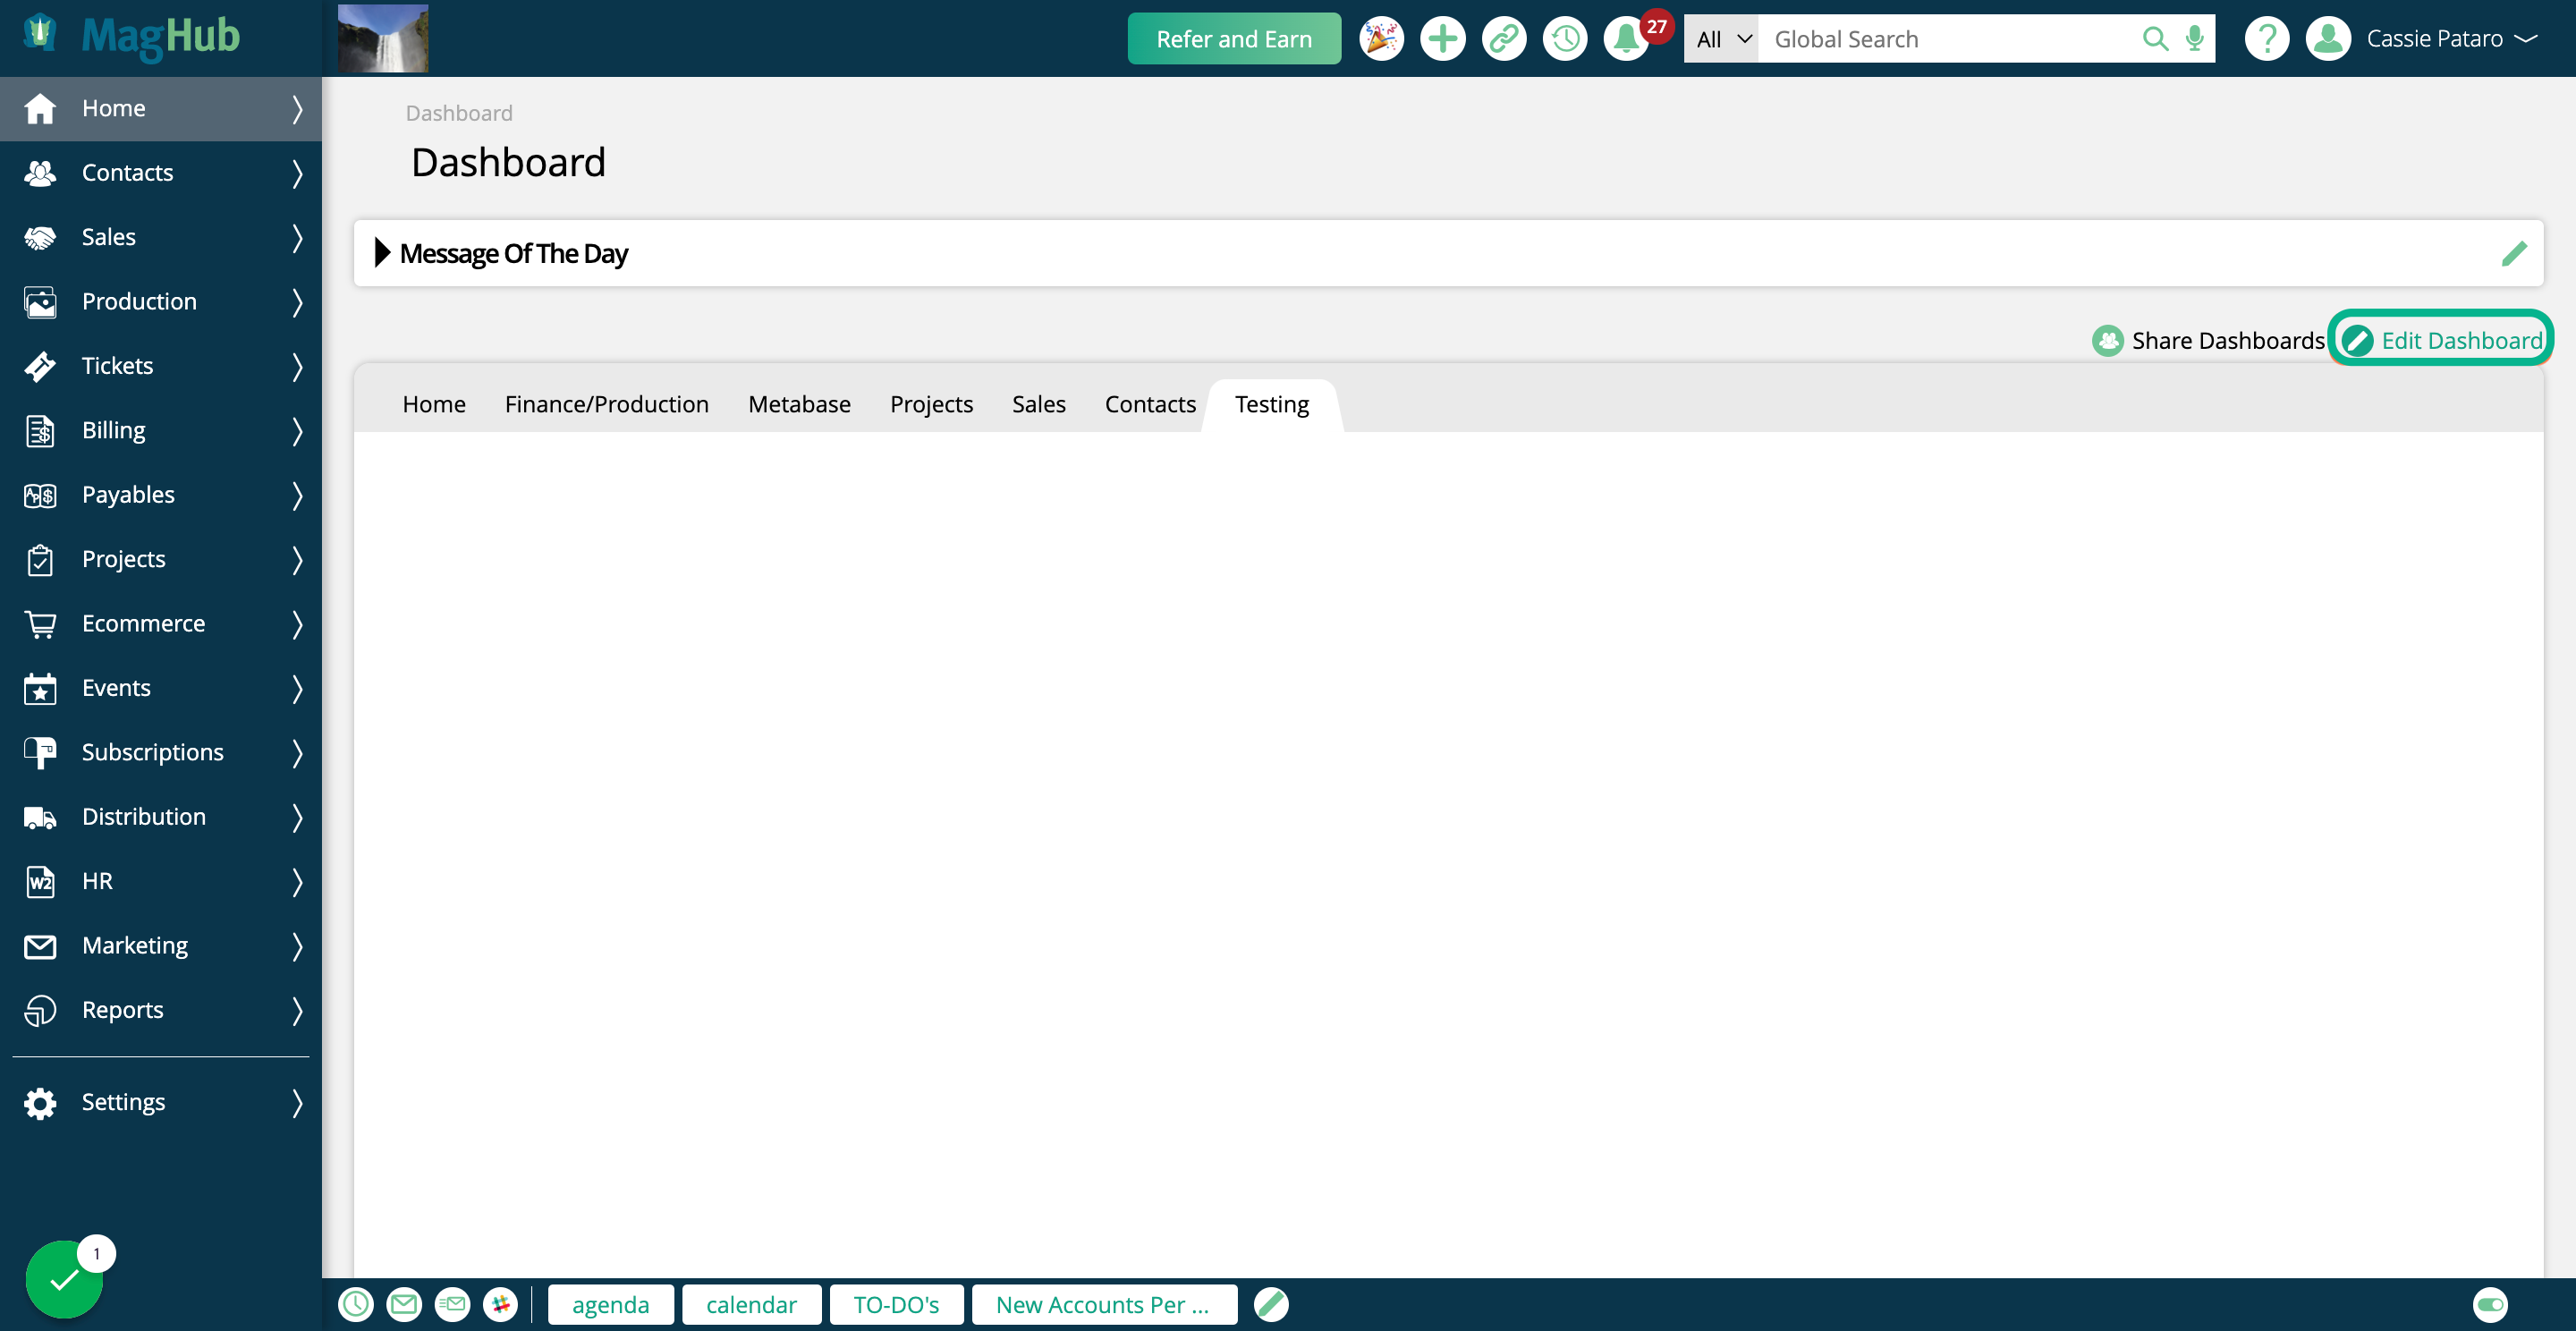
Click on Add Widget
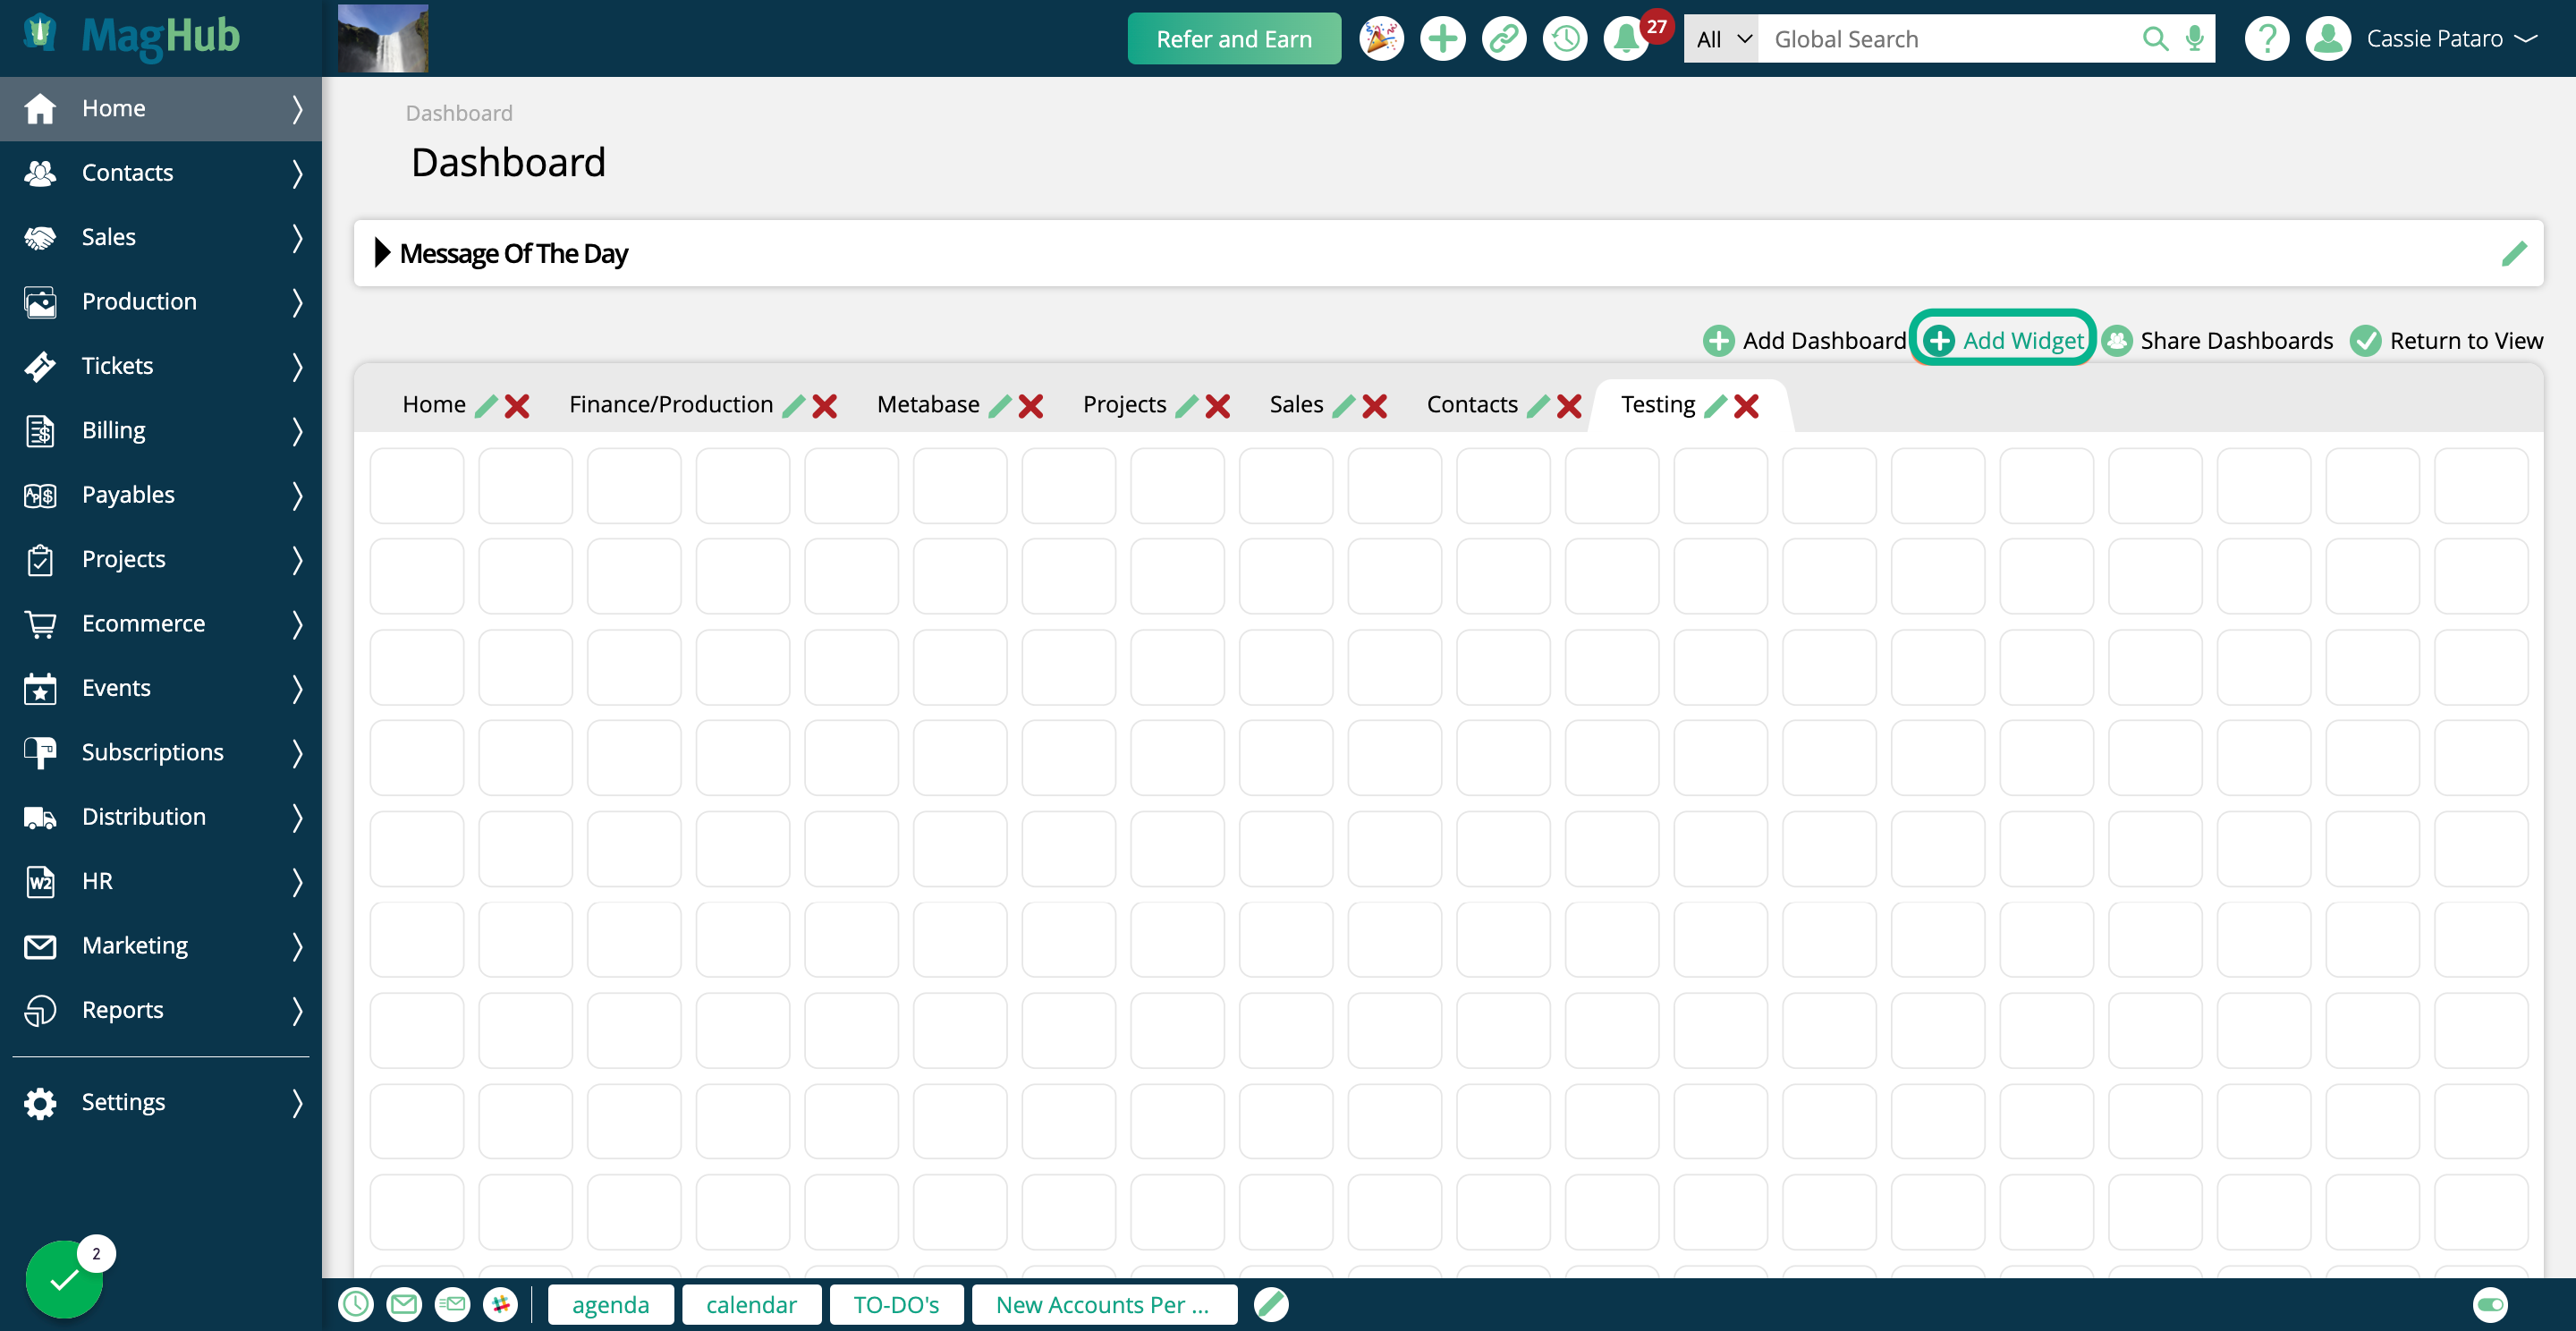
In the popup, click on Sales
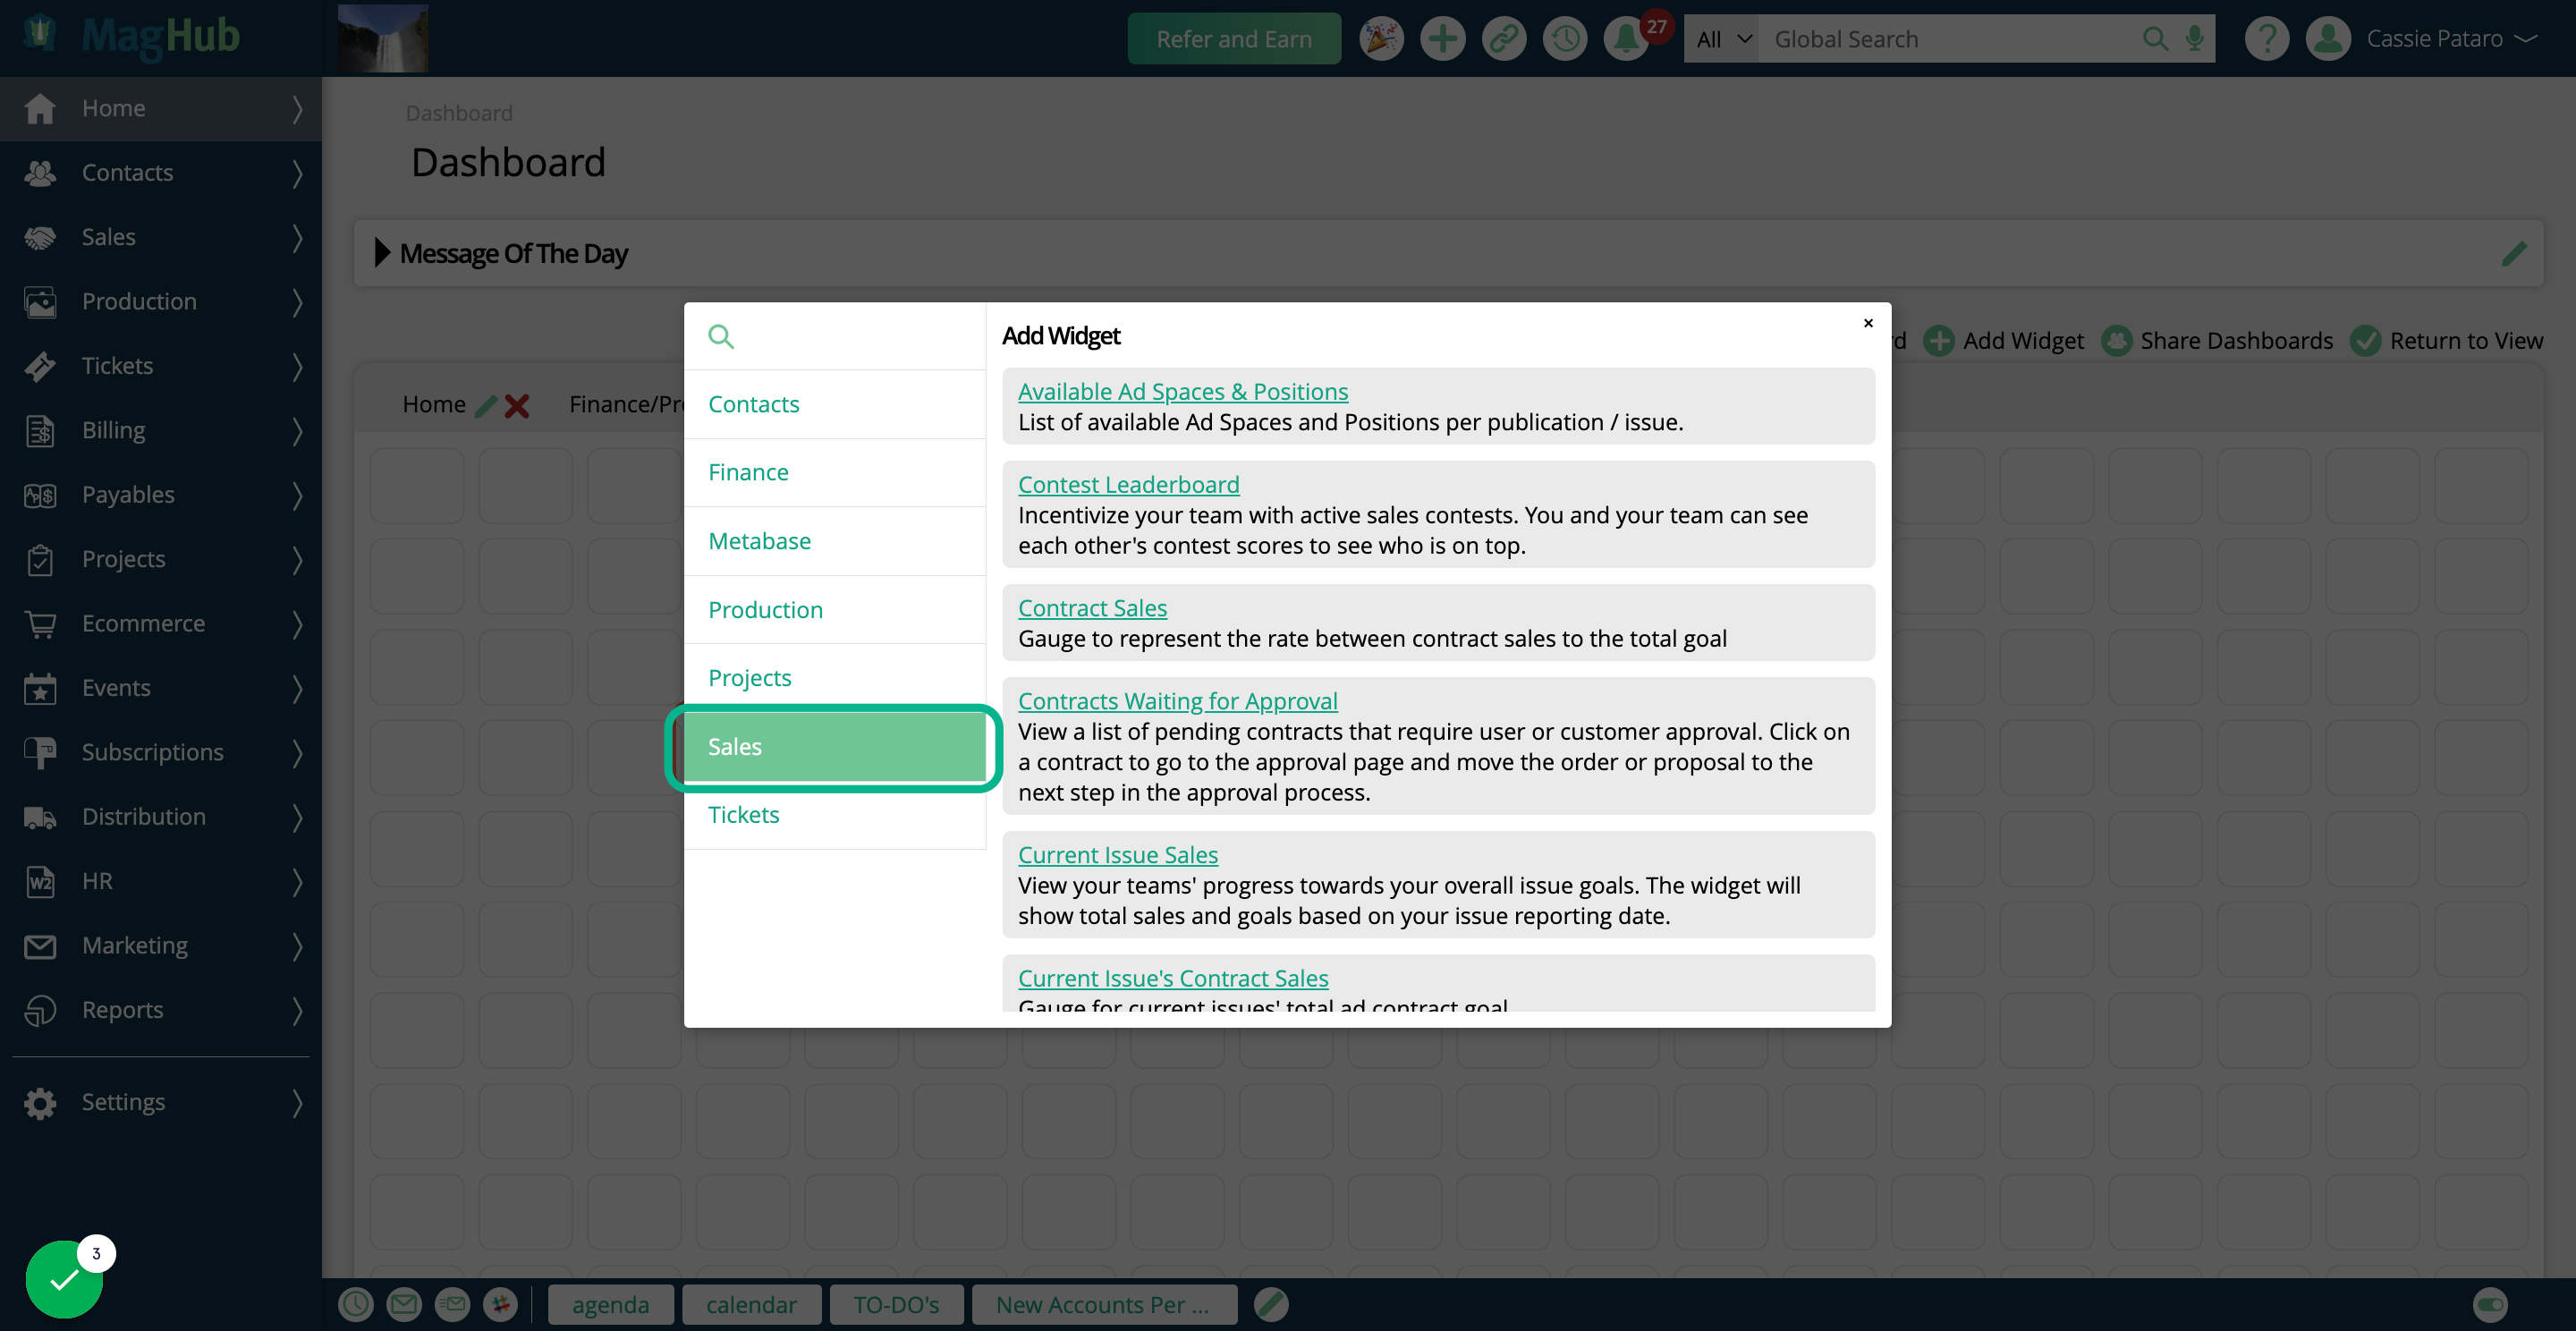
Then click on Impression Inventory
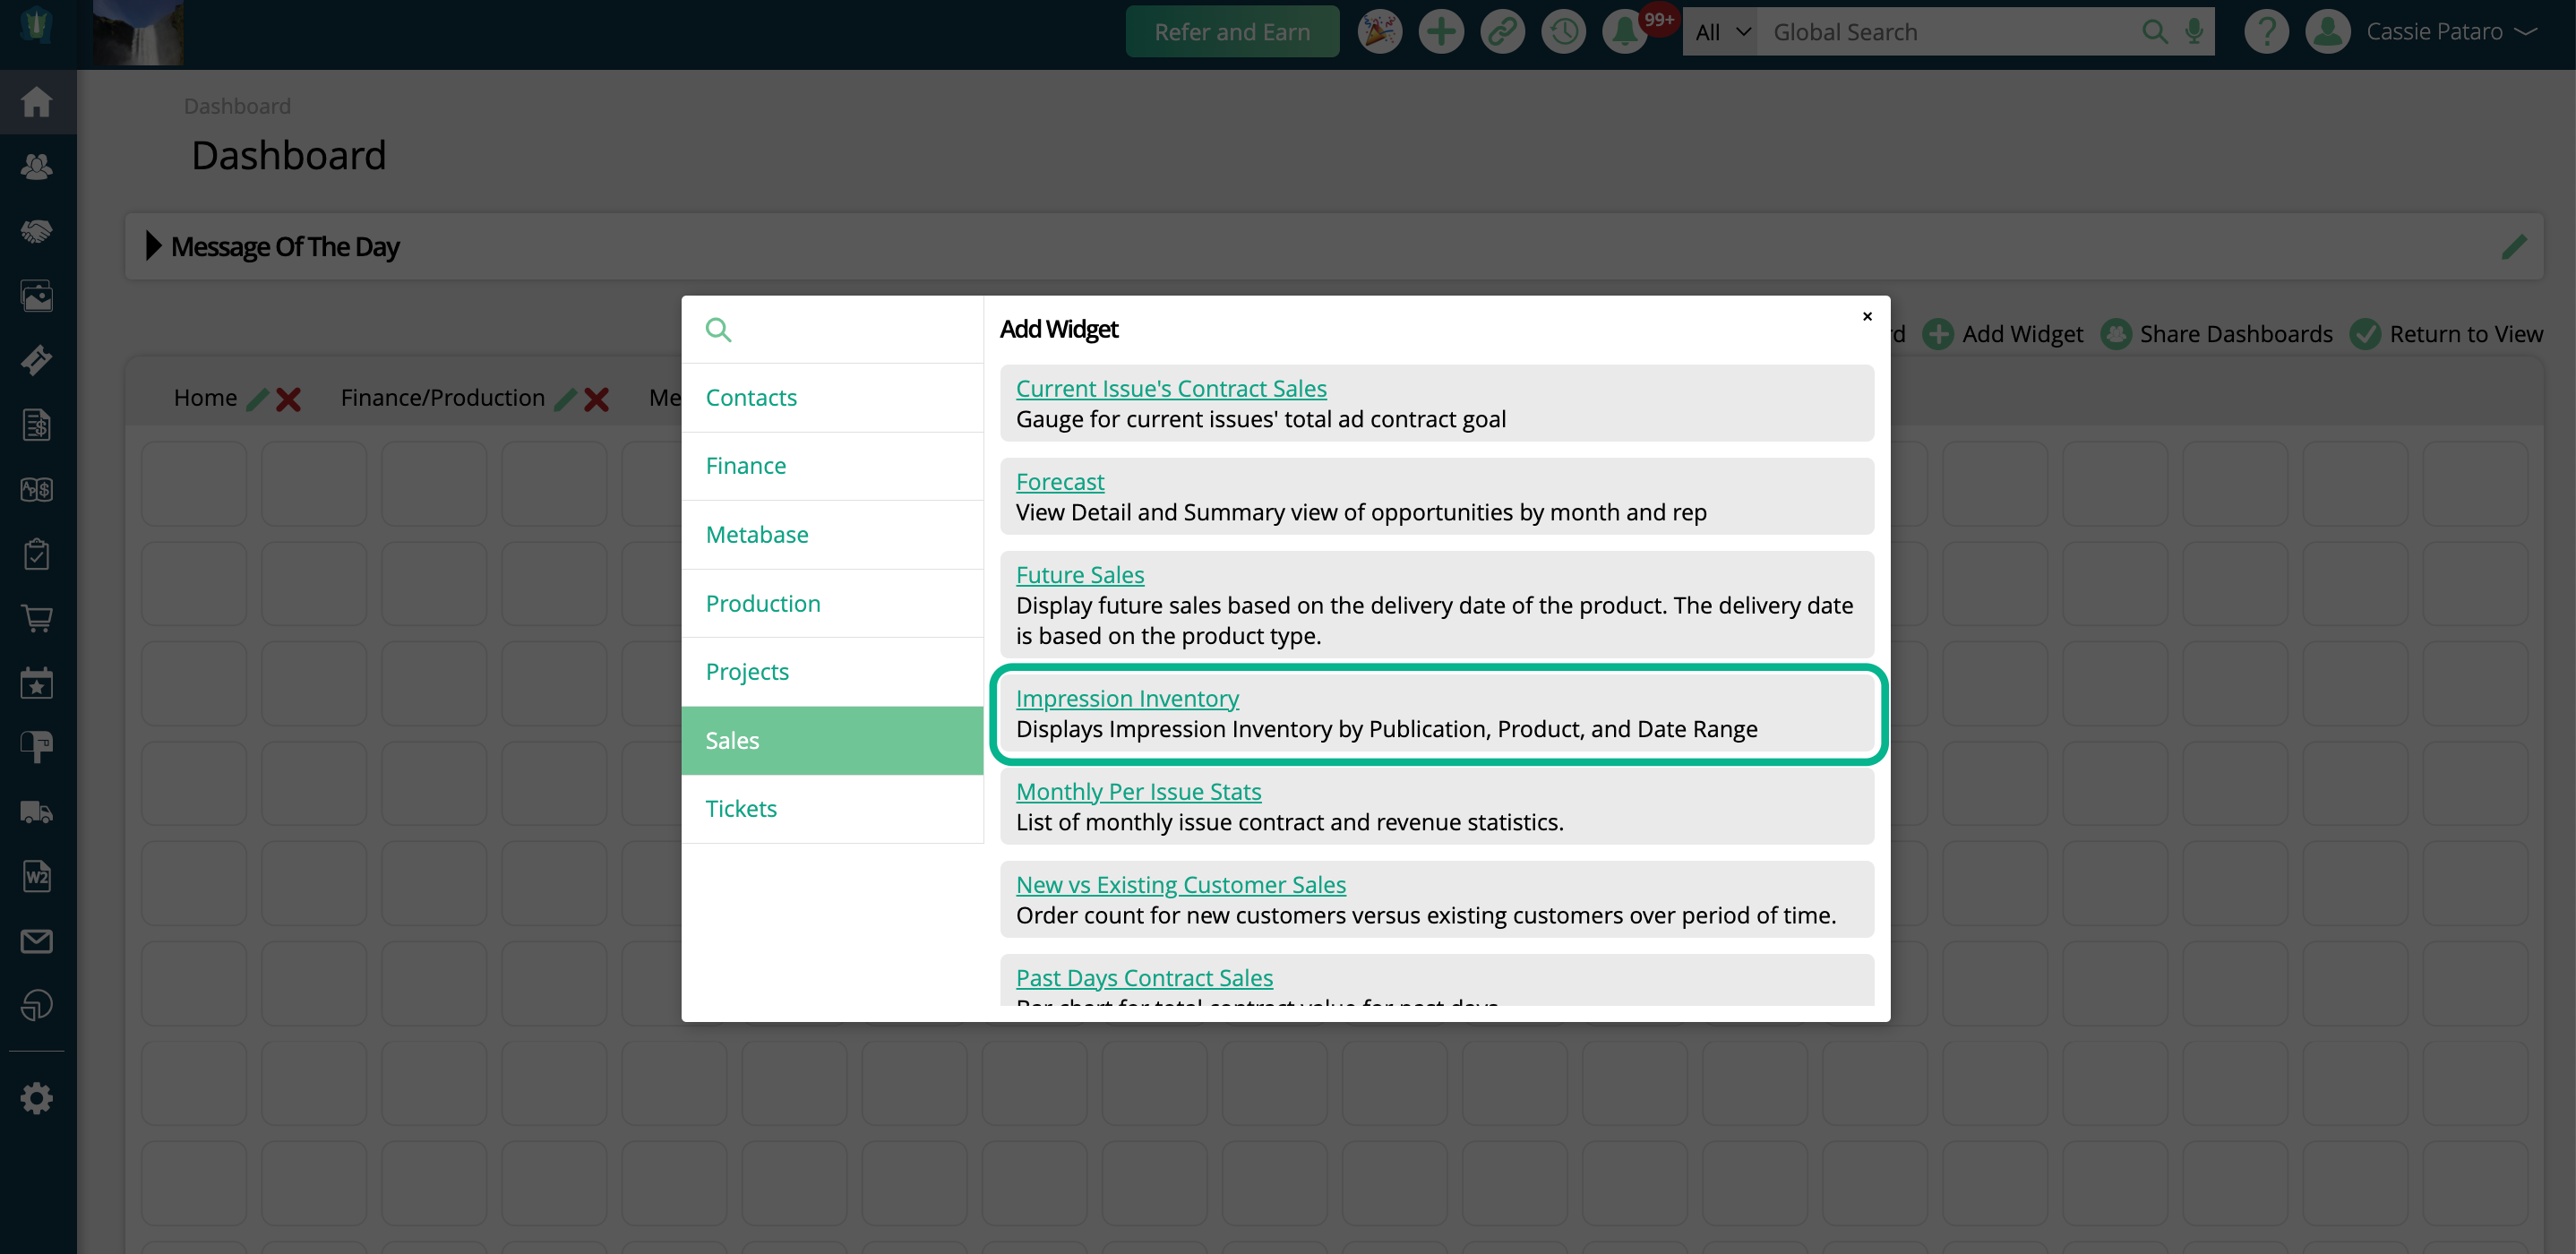
The widget will not display any information until you configure it, by clicking on the gear icon in the upper right corner.
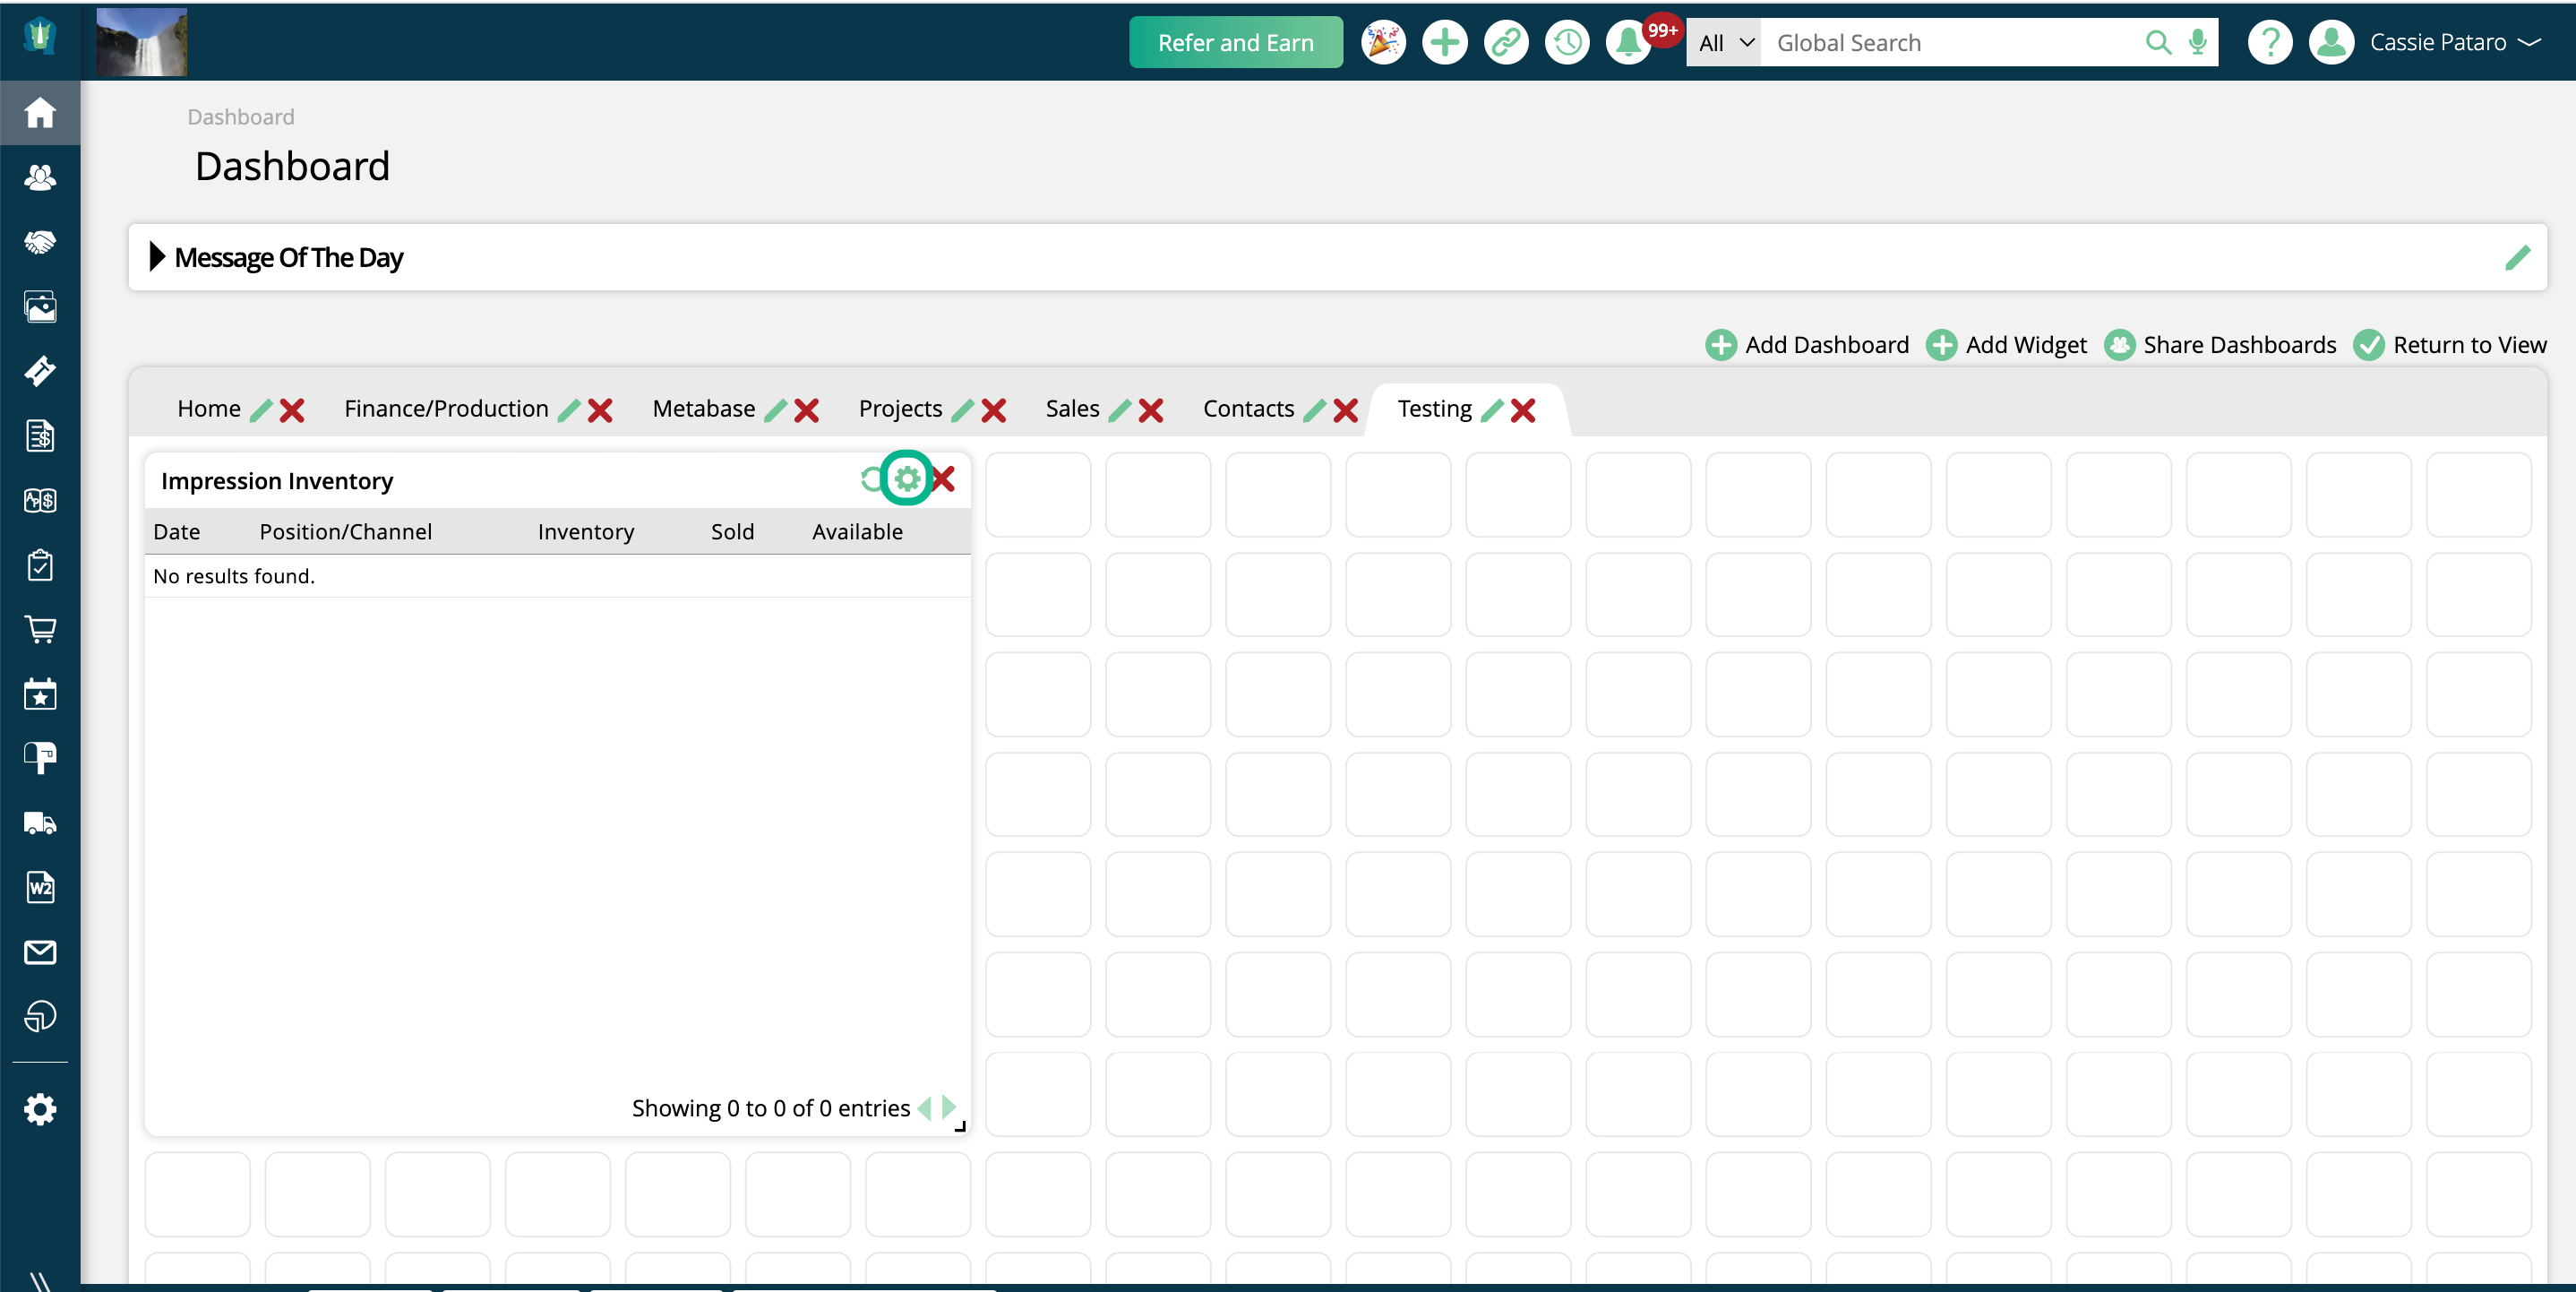
In the edit popup, you can name your widget, and add it to the dock for easy access.
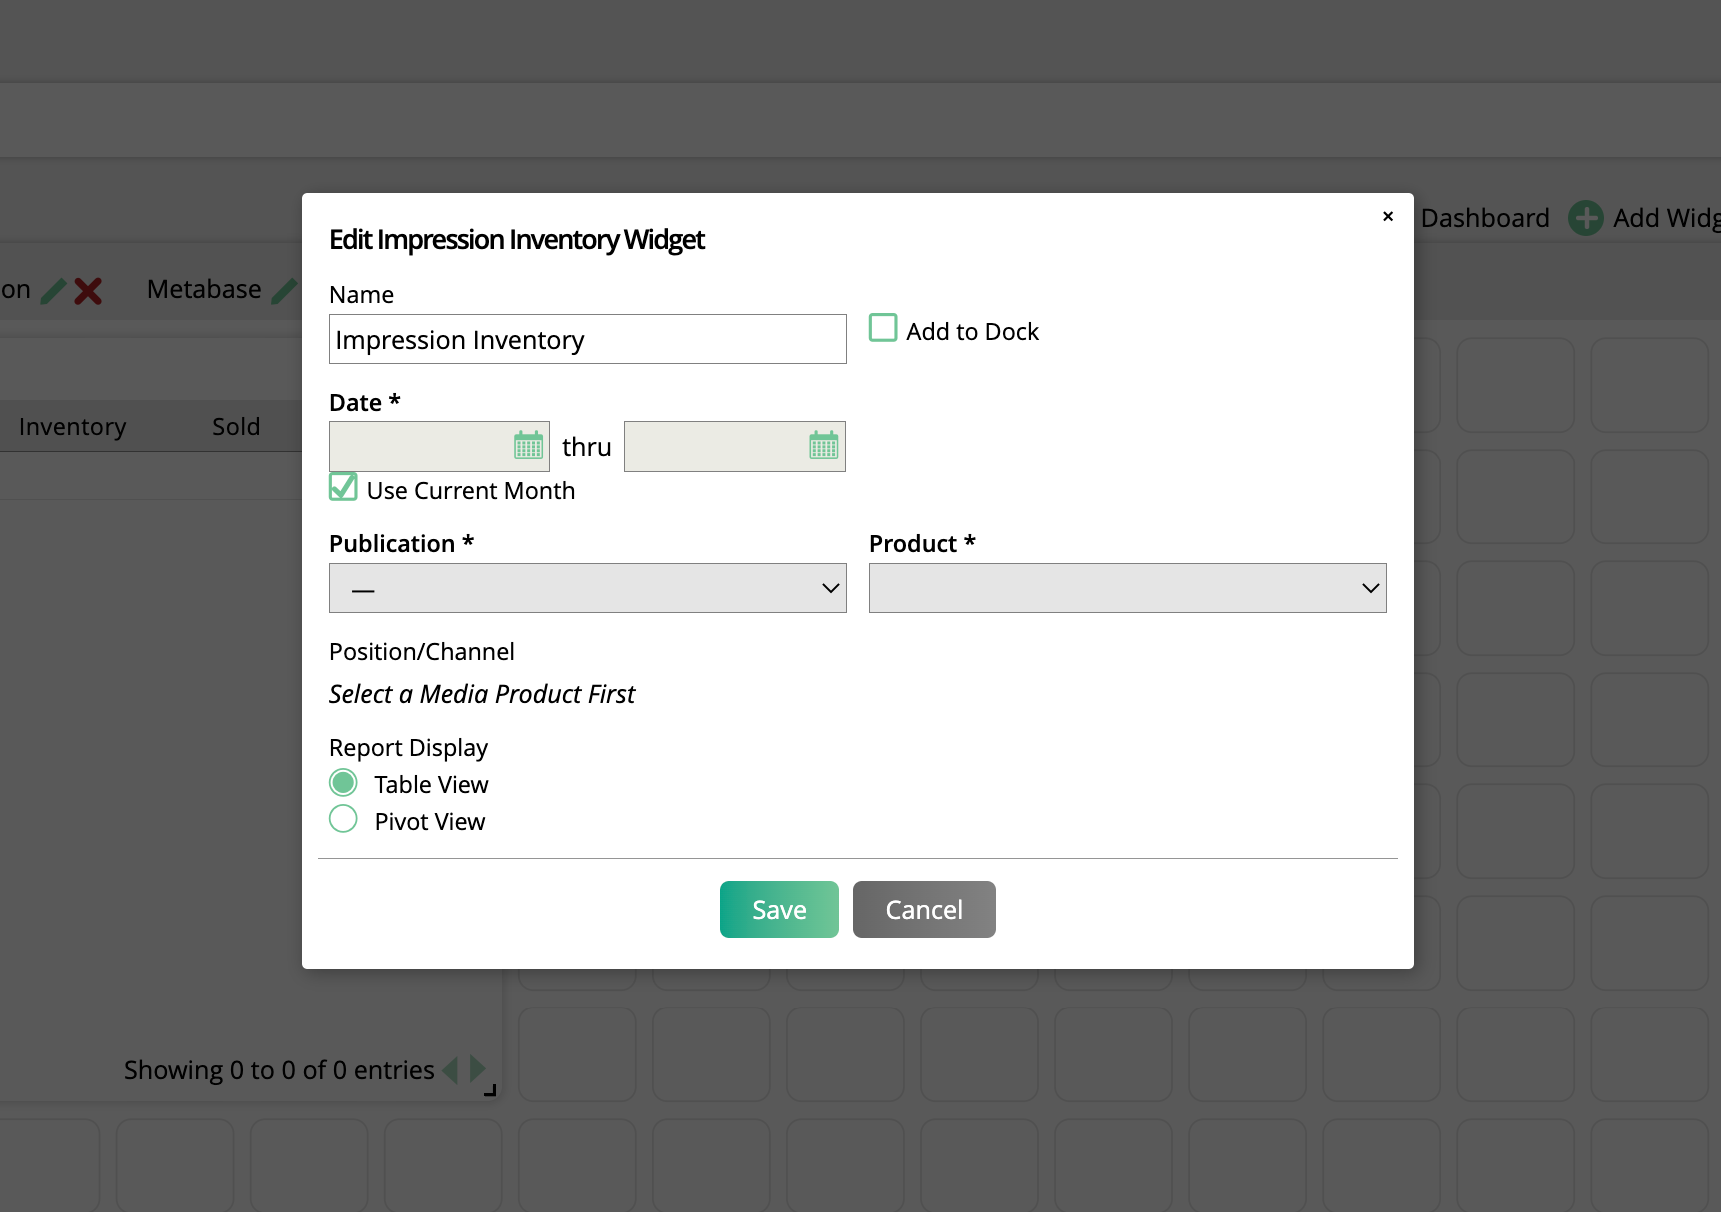
There are three required filters for the widget. The first is the date range.
By default, the date will be set to the current month. If you uncheck this option, you can enter a custom date range. Both a start and end date is required.
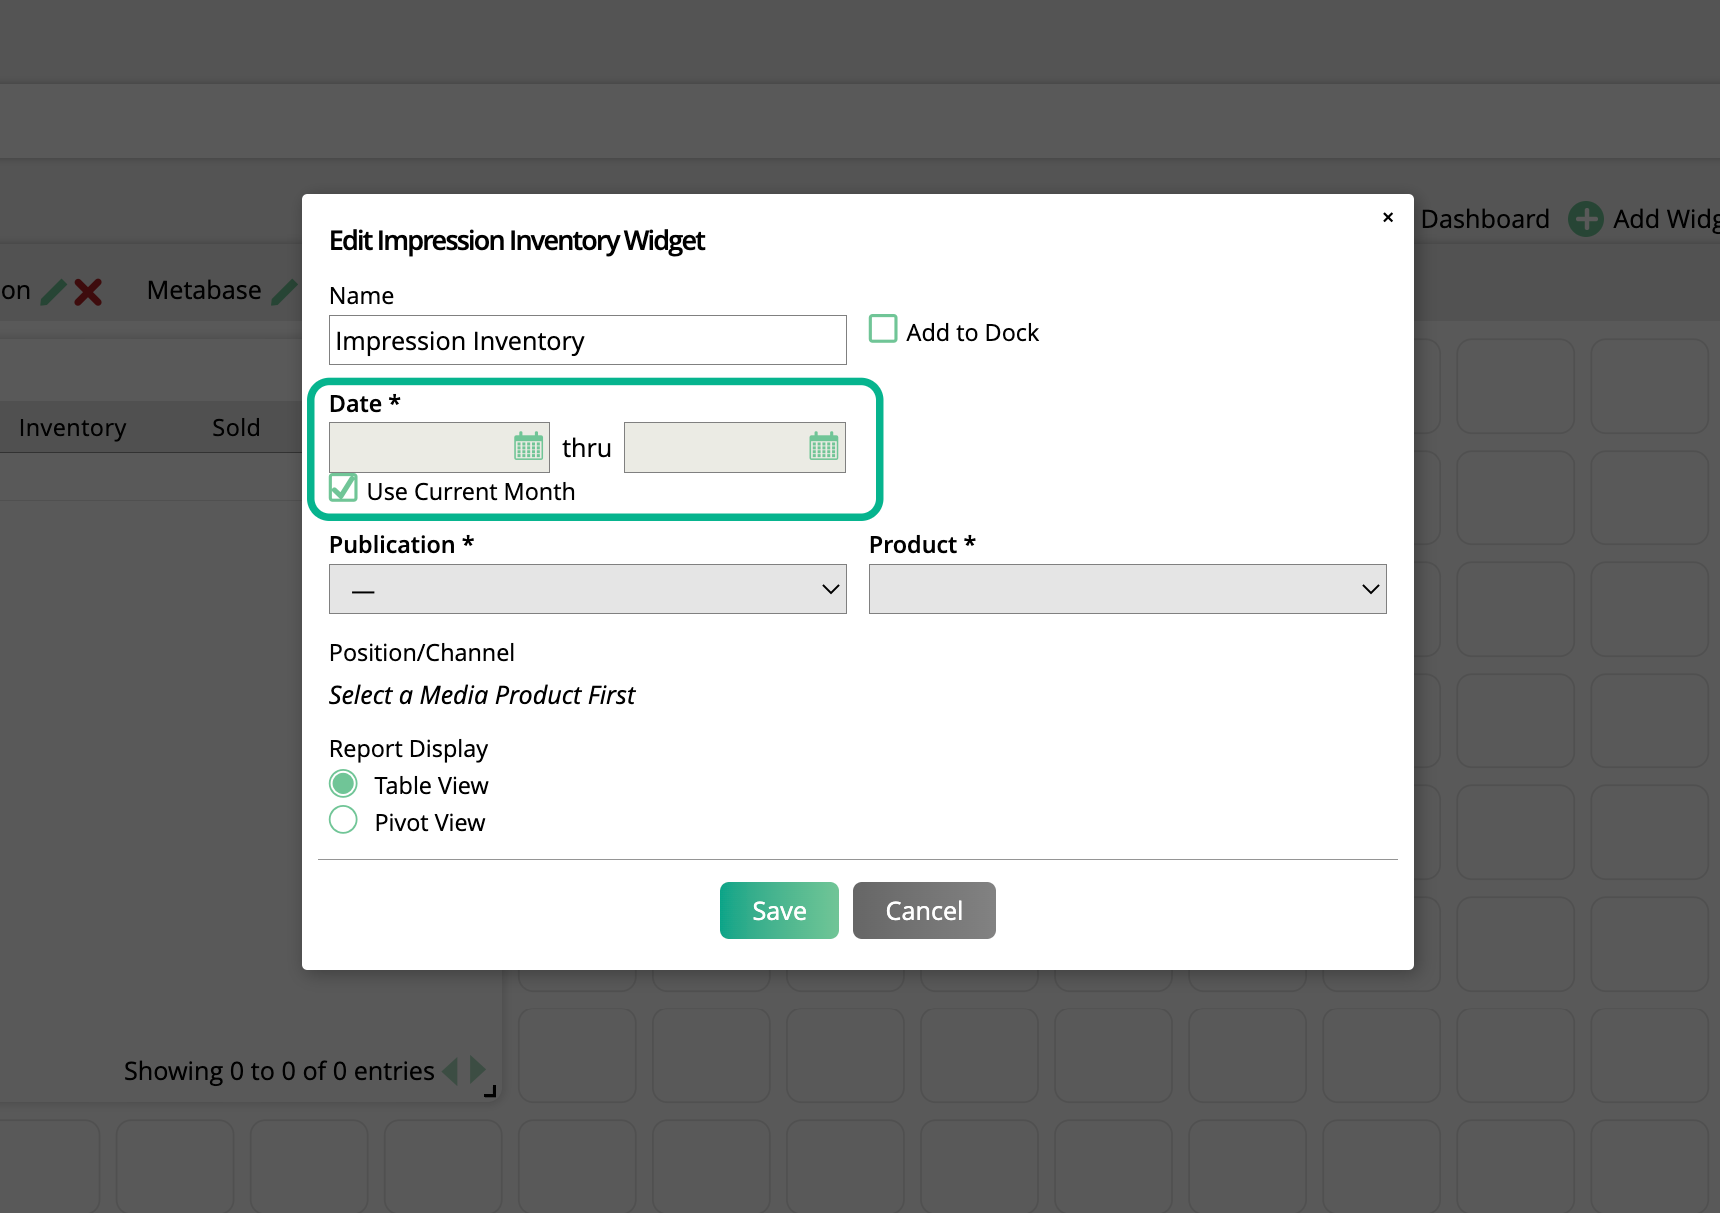
The next required field is the Publication.
You may only choose one Publication. Your Product list will be based on which Publication you choose.
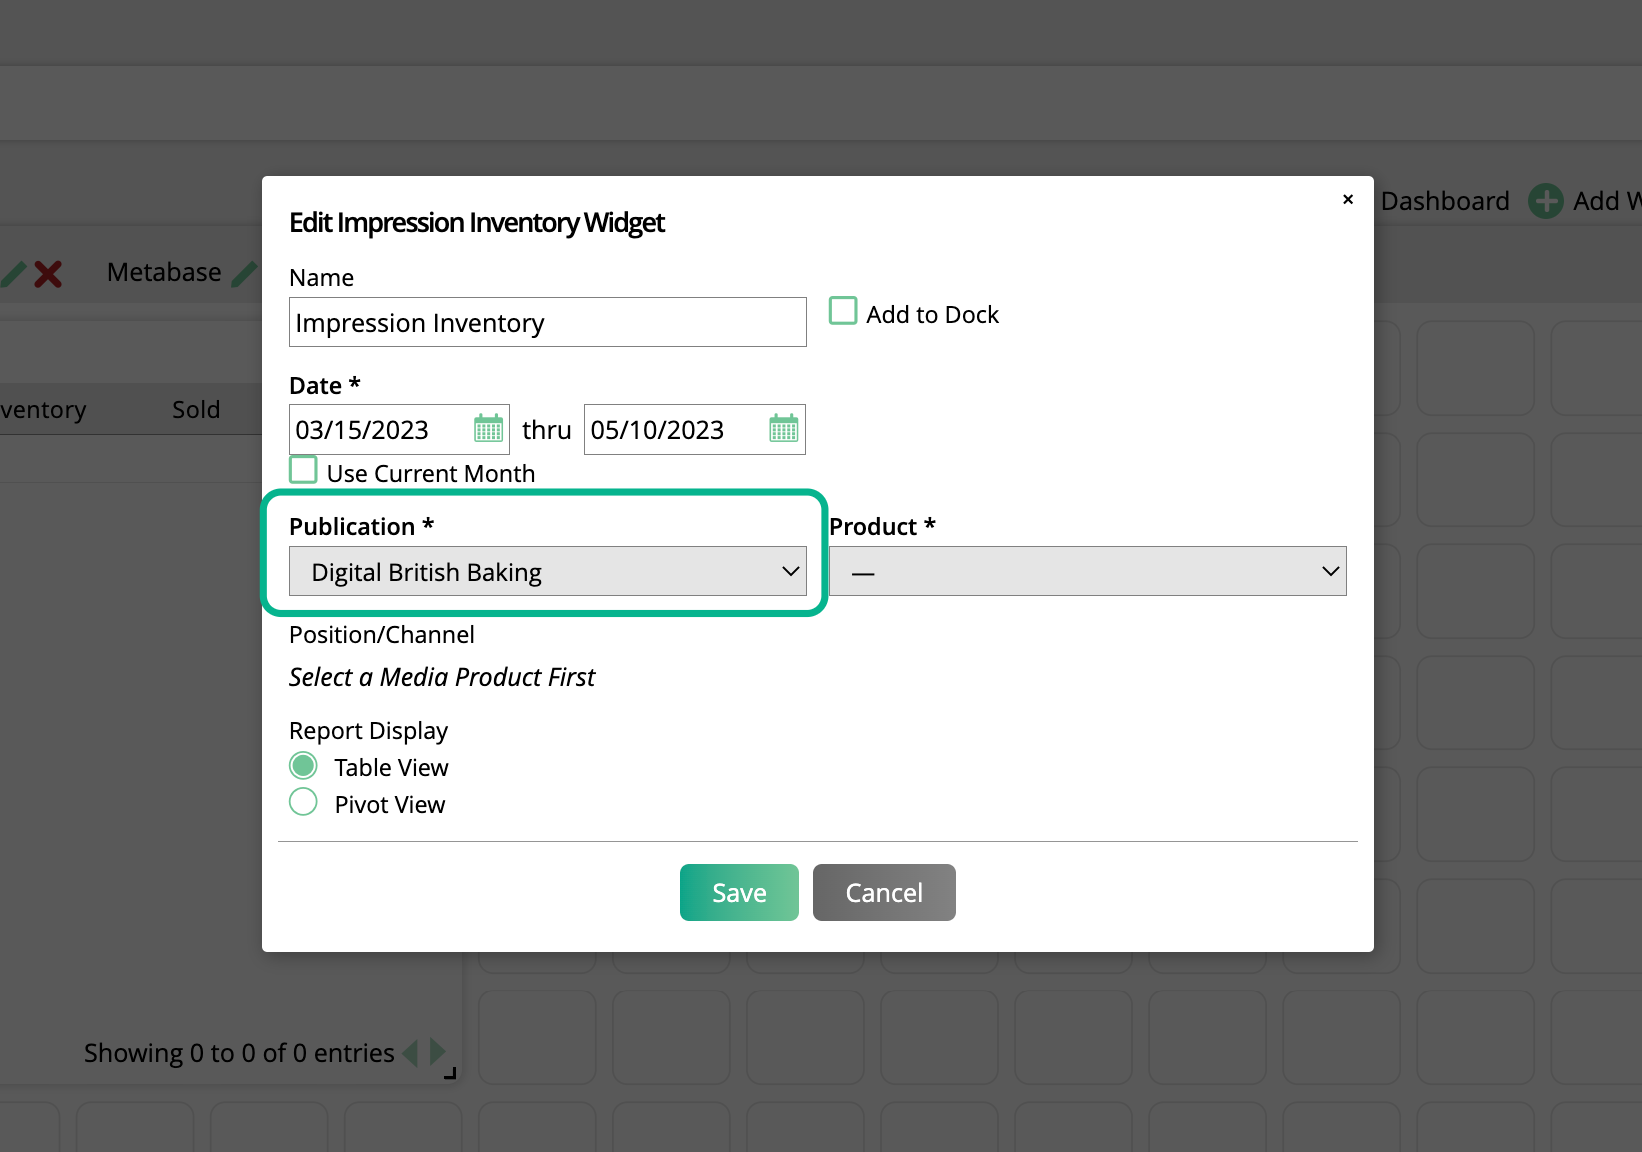
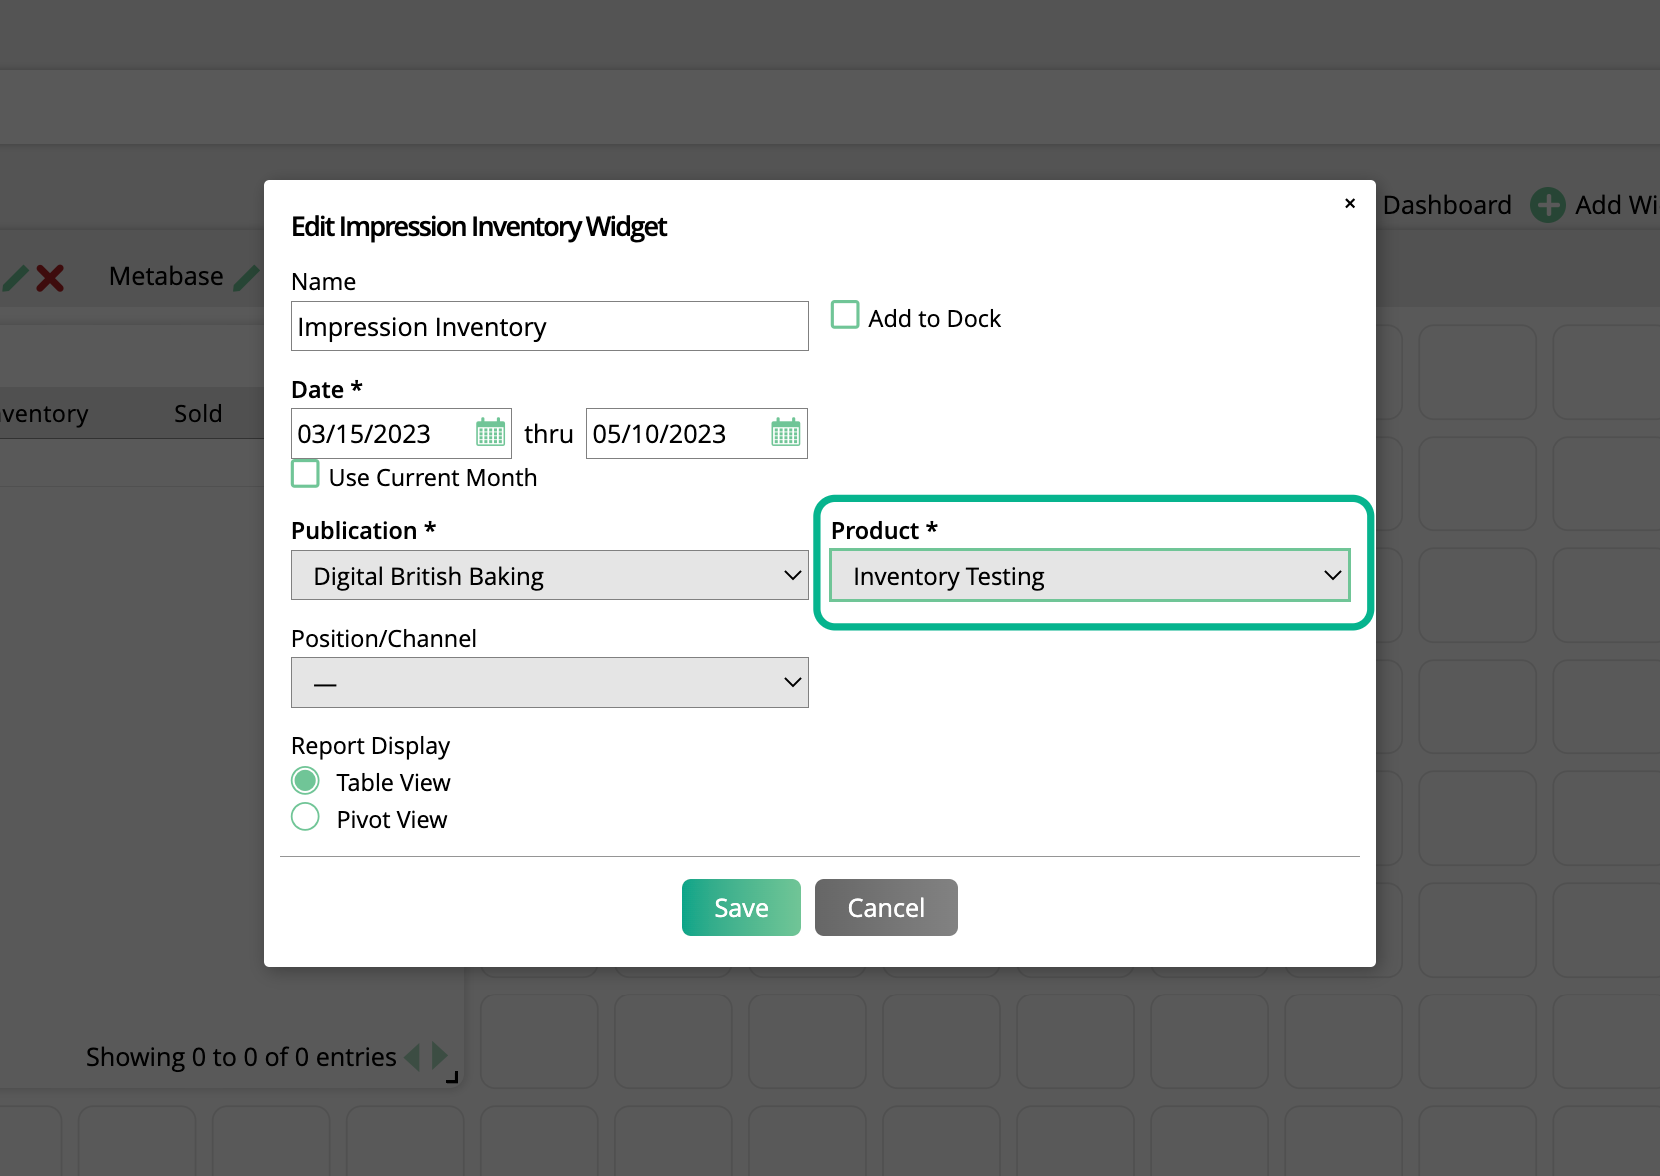
And finally, the last required field is Product.
The widget only supports viewing one Product at a time. If you need to see inventory data for multiple impression products, you will need to add multiple widgets to your dashboard. The Product chosen will determine what shows up in your Position/Channel field.
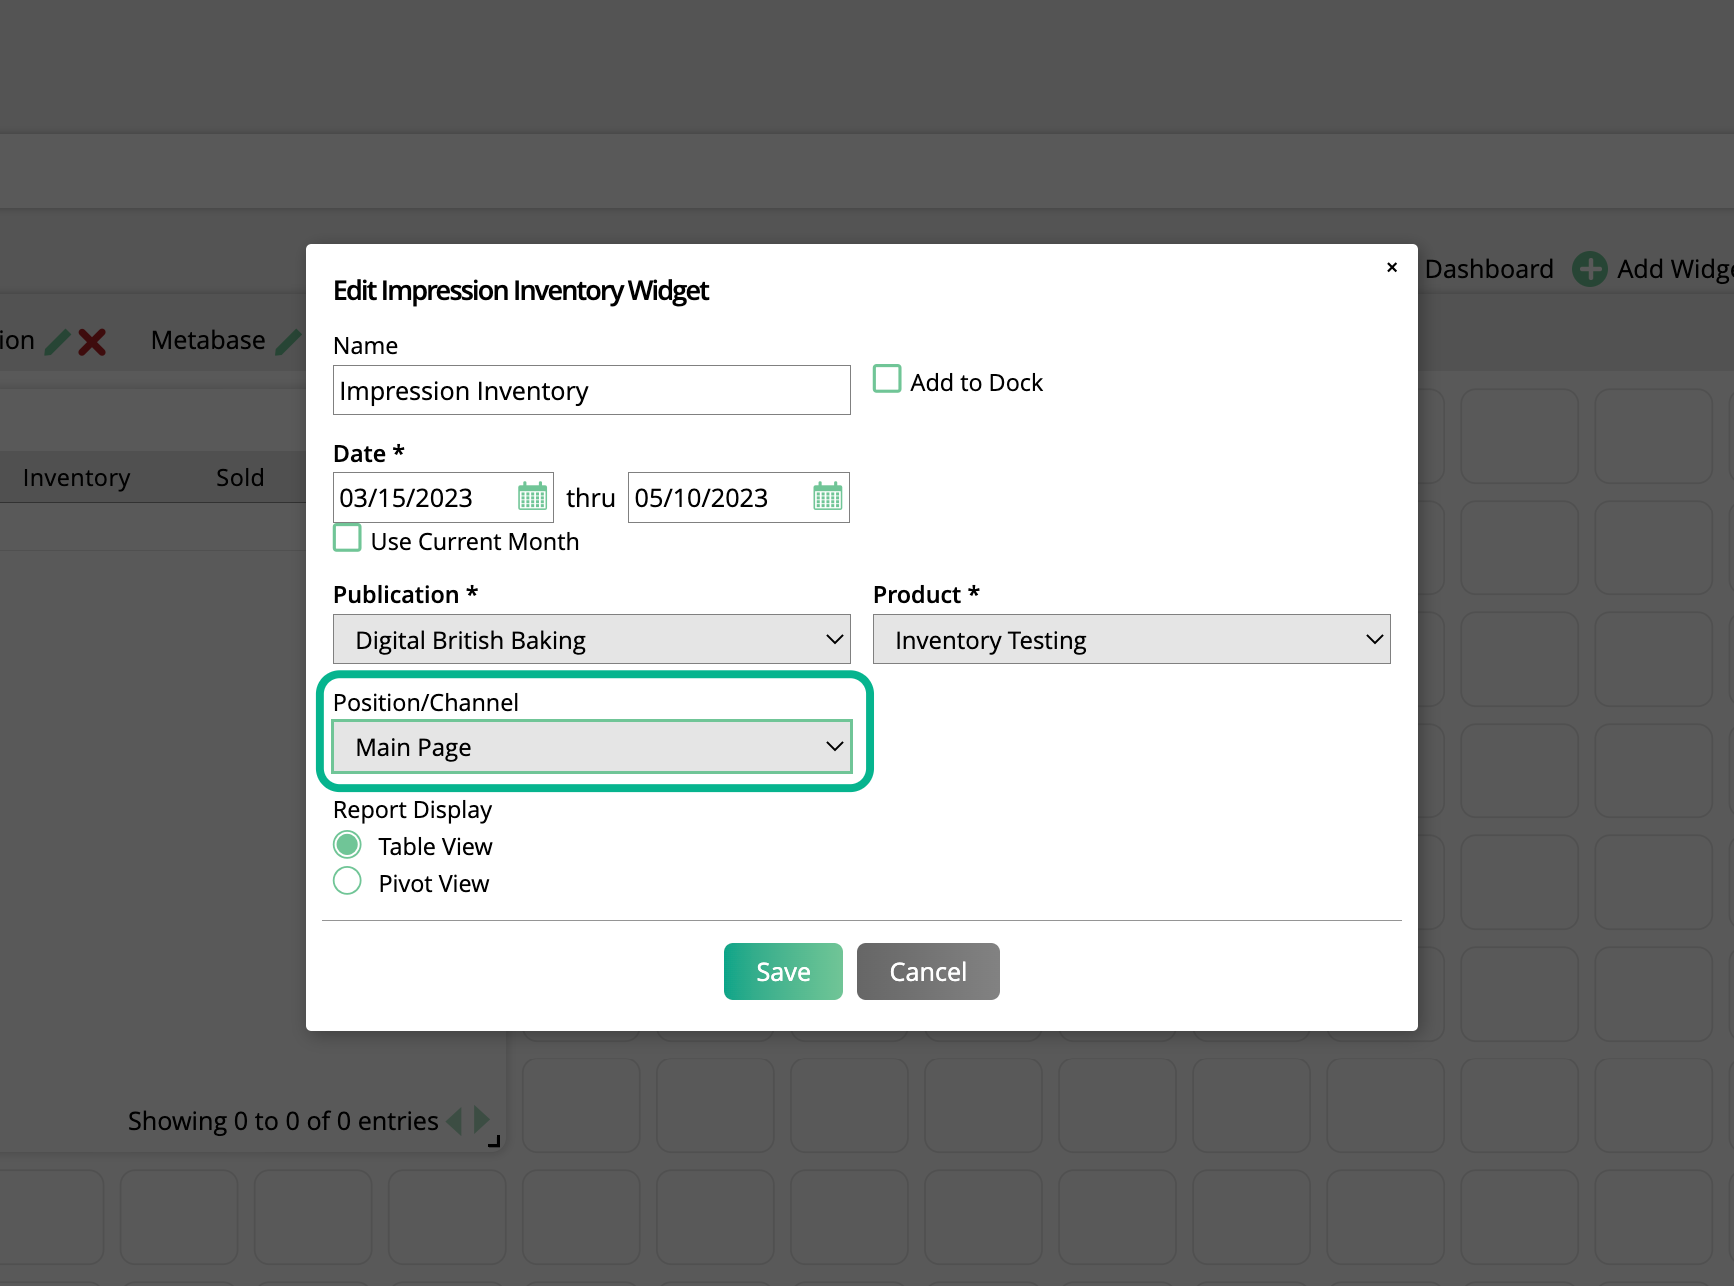
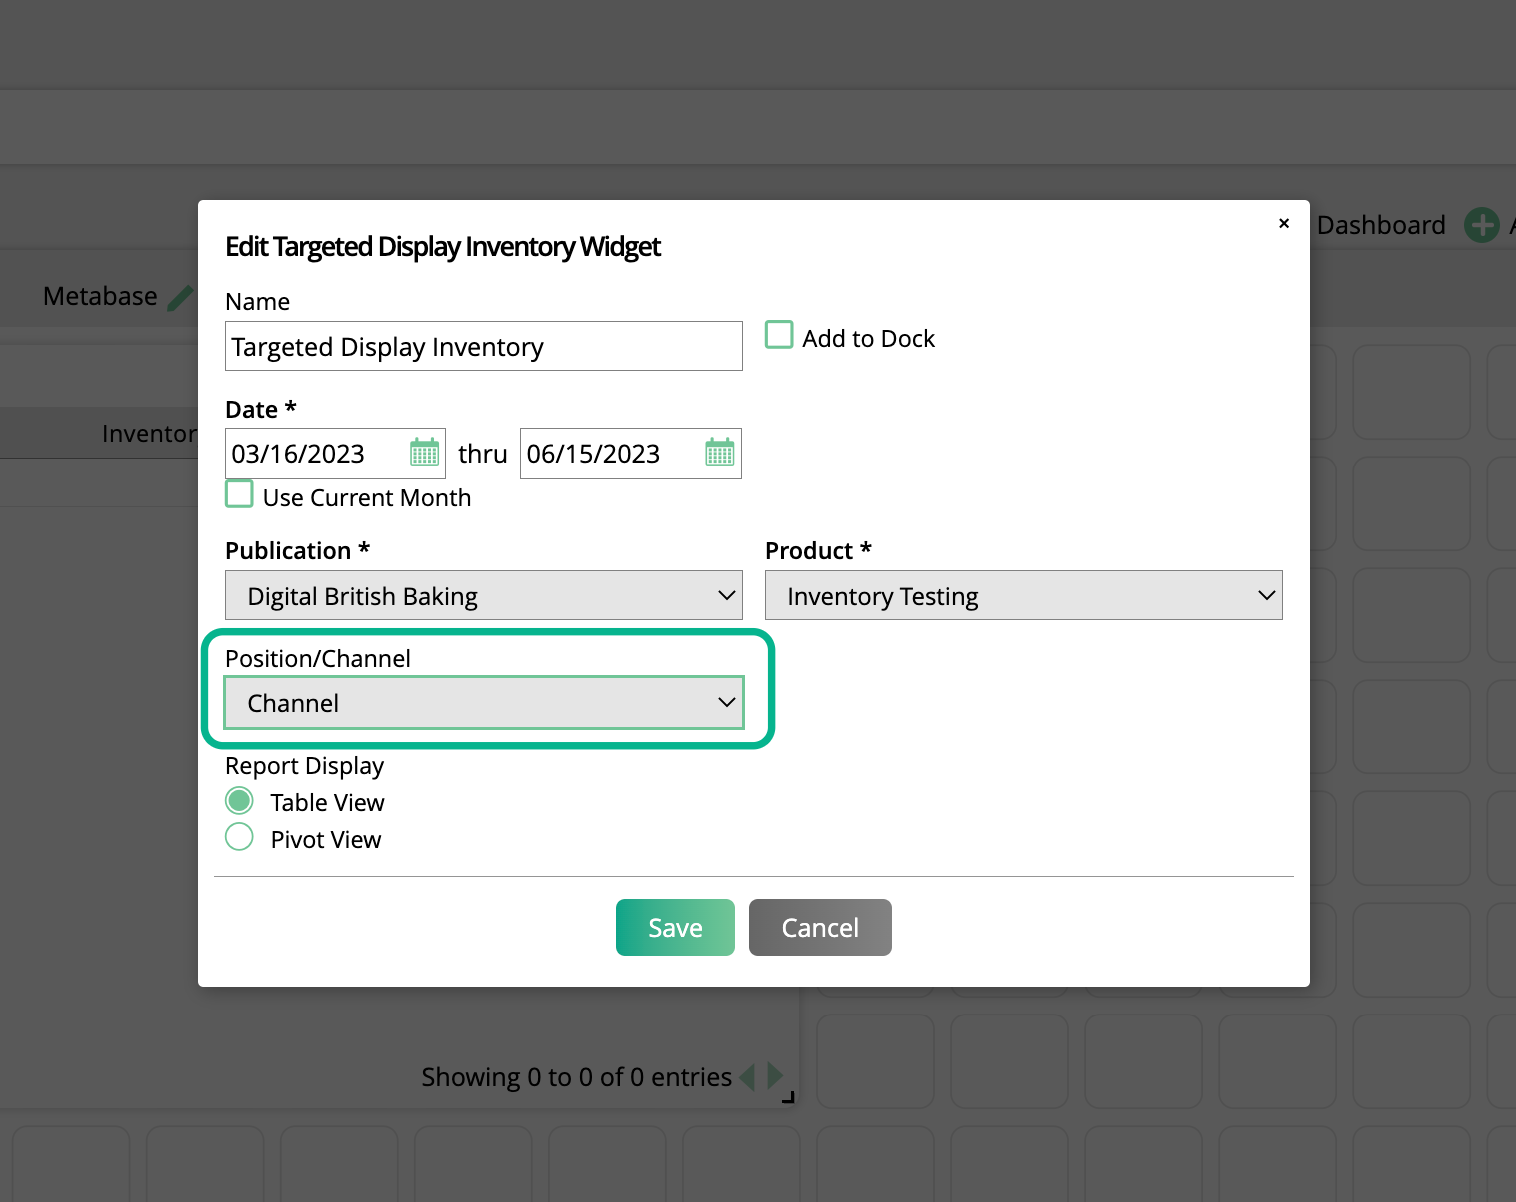
The Position/Channel field is optional, but can help narrow down your results if your impression product has multiple channels.
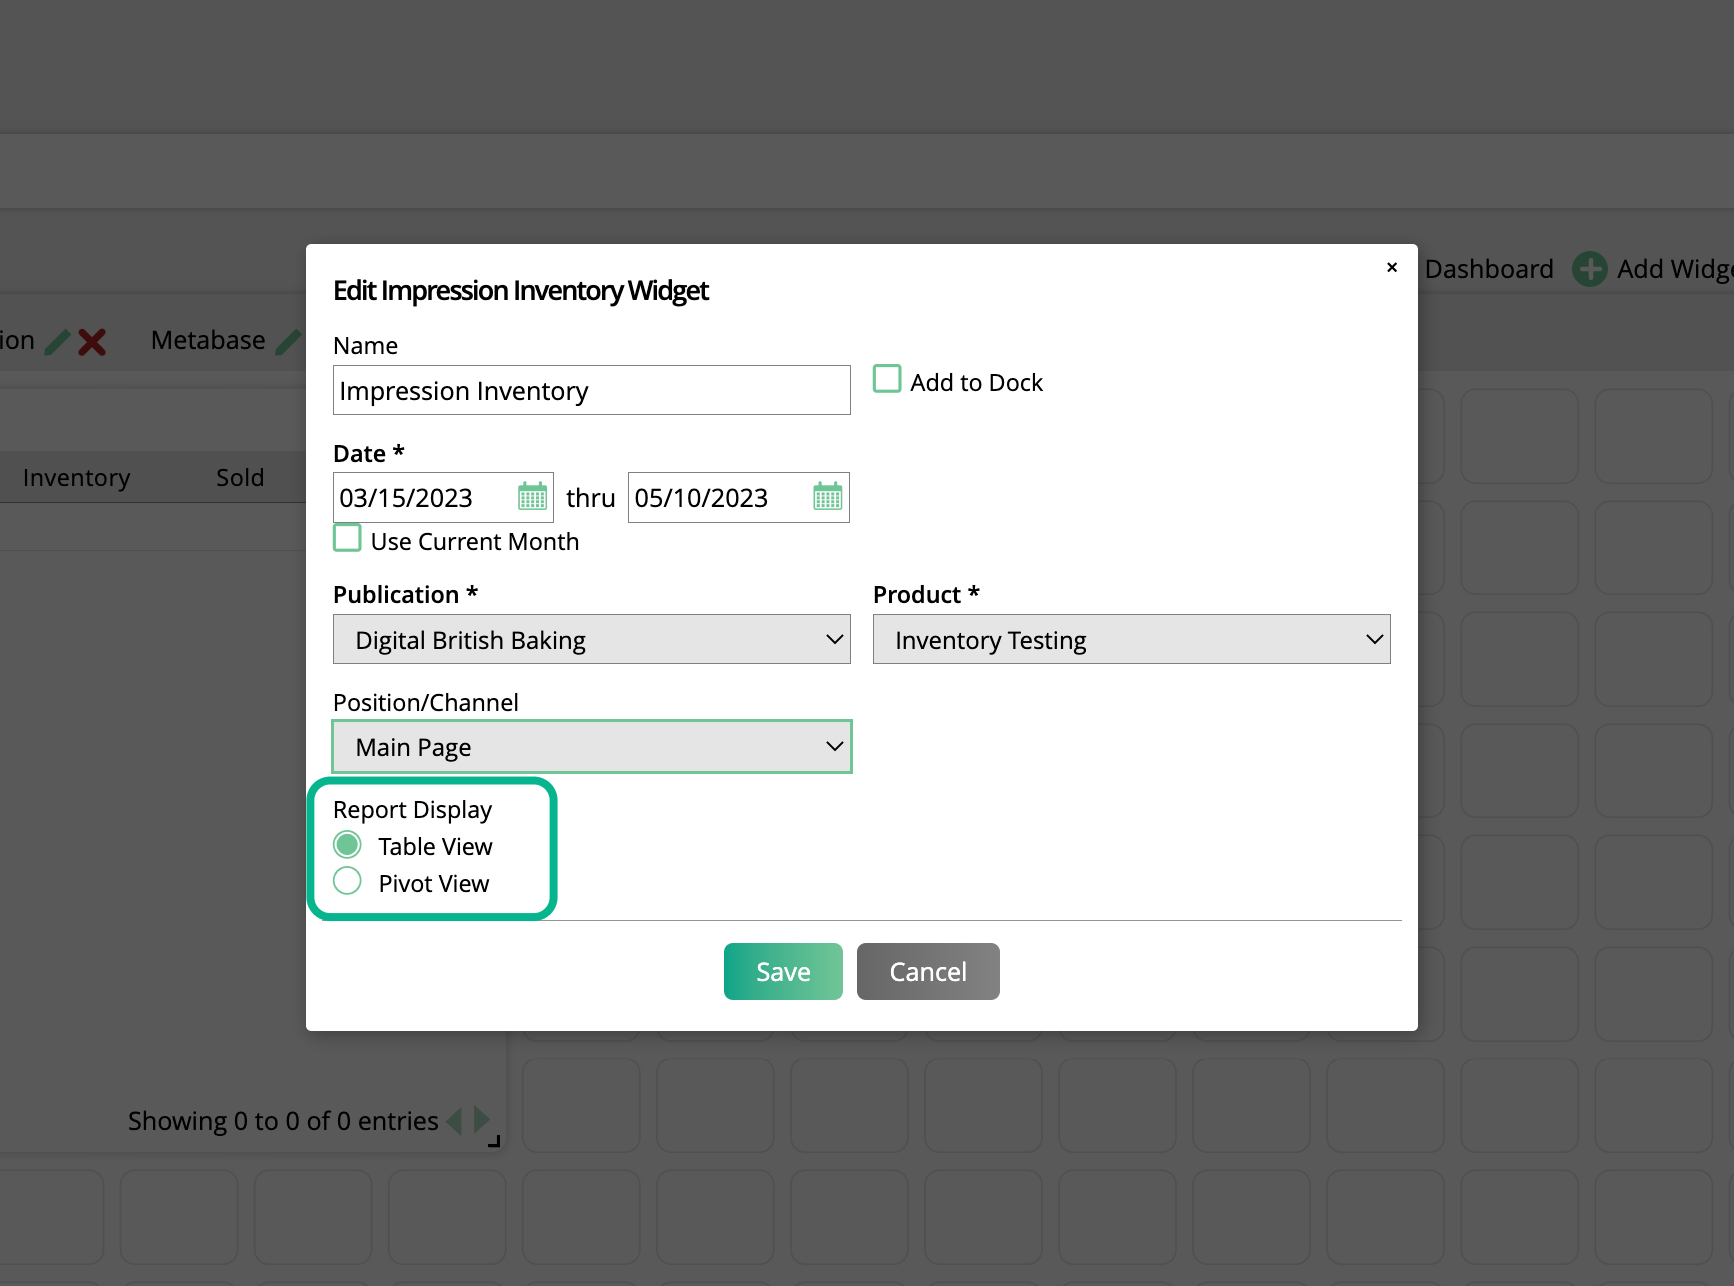
The Report Display lets you choose how your results are shown. These are the same options as the Impression Inventory Report.
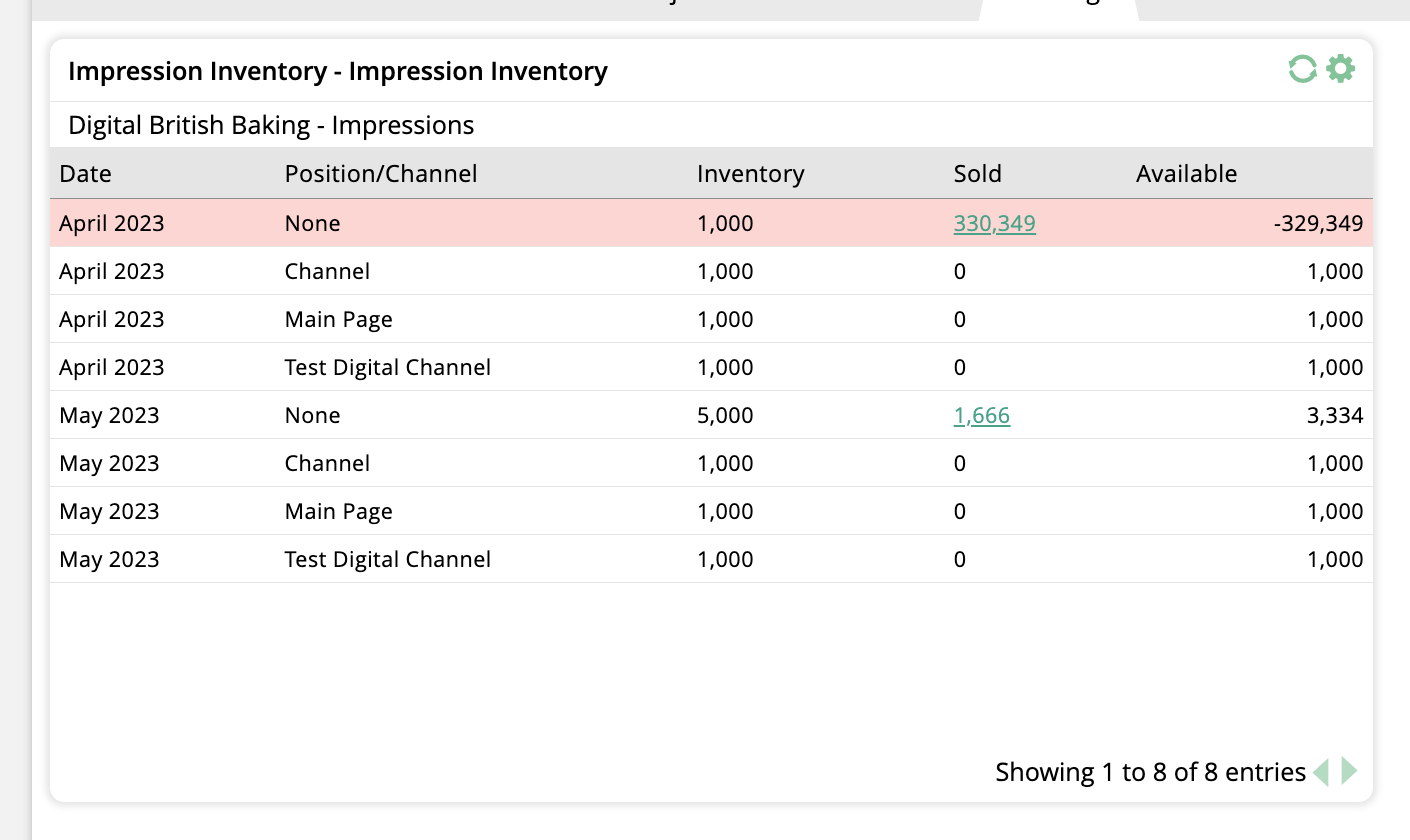
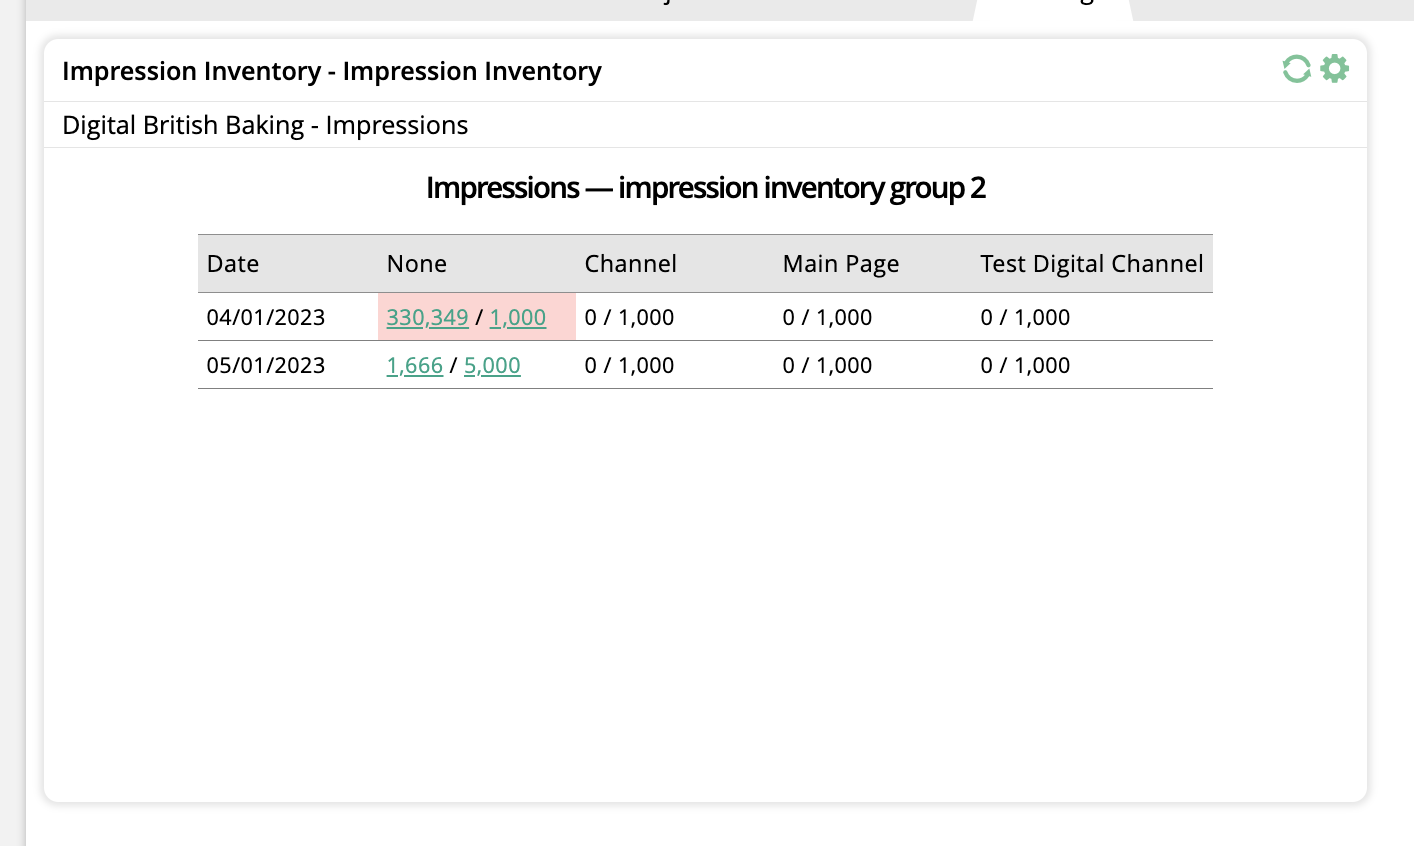
The table format is just what it sounds like, a table showing your impression inventory data. Each column header can be clicked on to sort the results by that column, and any oversold items will be highlighted in red.
Clicking on the value in the Sold column will redirect you to the Digital Media Snapshot report with certain search filters automatically filled in.
The pivot format is a visual representation of the same information contained in the table view.
Each date and channel for the product will show the sold amount first, followed by the inventory amount after the backslash.
Clicking on the sold amount will redirect you to the Digital Media Snapshot report with certain search filters automatically filled in.
Clicking on the inventory amount will open the daily inventory popup, which will give you more detailed information about the daily breakdown of the available and sold inventory.
Added 3/09/2023
The Monthly Per Issue Stats widget displays a list of monthly issue contract and payment statistics. For this widget, you can either choose to display contract stats or payment stats. The contract stats show you how many sales were made for a specific issue month and year range, while the payment stats display any payments received for a specific issue month and year range. Both of these types can be extremely helpful and allow you to keep this information easily accessible in your dashboard.
To add the widget to your dashboard, make sure you are in edit mode. Click Add Widget in the upper right corner. You will get a window that shows widget types. View the Sales type and select Monthly Per Issue Stats.
By clicking on the gear icon in the upper right corner of the widget, you can name it and filter results by contract or payments and publication. You can also change the date range by choosing ‘Use Current Month’ or you can select a different month and year. From the edit pop-up, you can also add this widget to your dock and choose whether or not to use the display chart. In the display chart view, you can hover over a bar to see the exact value. Click Save once you are done editing.
If you have the widget type set to ‘Contracts’, the data is pulled from the Consolidated Ad Sales Report. If the type is set to ‘Payments’, the data is pulled from the Recorded Payments page. You can navigate to both of these by clicking on the ‘View Details’ icon in the upper right corner of the widget.
The Orders Waiting for Approval widget shows all of the pending orders that require user or customer approval in an easy to read list. You can choose which stage of the approval process you want displayed in the widget, in addition to being able to perform actions directly from the widget that make approving orders a convenient and quick process.
To add the widget to your dashboard, make sure you are in edit mode. Click Add Widget in the upper right corner. You will get a window that shows widget types. View the Sales type and select Orders Waiting for Approval.
By clicking on the gear icon in the upper right corner of the widget, you can choose to name the widget or add it to your dock. You can also filter the results that display by Type, Publisher, and User. The users that you see are determined by your permissions. The type filter allows you to choose which stage of the approval process you would like to see including Publisher, Client, Finance, Sales Approver, and Awaiting Amendment. Once you are done editing, click Save.
There are two different views for the widget depending on how large you make it in your dashboard.
The smaller view will display the total number of orders in this stage of the approval process and the total amount the orders are worth.
The larger view will display the date the order was created, the order number, the company name, and the amount. From the detail view of the widget you can click on the company name, which will take you to the company page. You can also click on the Order ID number, which will take you directly to the approval page for that order.
The data for this widget is pulled from the Sales > Approve Orders page, which you can navigate to by clicking on the ‘View Details’ icon in the upper right corner of the widget.
The Past Months Contract Sales widget displays the total contract sales for previous months in an easy to read bar chart, broken down by month. The widget also shows the total for the past months that are displaying. By hovering over one of the bars, you can see the exact value. This is a great widget for getting a snapshot of how your company is doing in terms of contract sales in recent months.
To add the widget to your dashboard, make sure you are in edit mode. Click Add Widget in the upper right corner. You will get a window that shows widget types. View the Sales type and select Past Months Contract Sales.
By clicking on the gear icon in the upper right corner of the widget, you can name the widget, and choose how many previous months you wish to display. You are also able to add this widget to your dock for easy access. Once you are done editing, click save.
The Sales Rep Contract Sales widget displays a gauge for a sales rep’s monthly contract sales goal. For a specific rep, the widget shows their monthly contract sales goal, their current contract sales, and the amount remaining to reach their goal. This can be really helpful to both the sales rep and a sales rep manager.
To add the widget to your dashboard, make sure you are in edit mode. Click Add Widget in the upper right corner. You will get a window that shows widget types. View the Sales type and select Sales Rep Contract Sales.
By clicking on the gear icon in the upper right corner of the widget, you can edit the widget name and filter by date range and user. The users you have access to depend on your permissions. You are also able to add this widget to your dock for easy access. Once you are done editing, click Save.
The Top 10 List widget displays a list of clients, client categories, or publications by total contract value or sales/billing dates. You can choose to view the results in either a list or in a display chart. Hovering over each bar in the display chart will show the exact value. This widget is great for seeing a summary view of your most lucrative clients or publications.
To add the widget to your dashboard, make sure you are in edit mode. Click Add Widget in the upper right corner. You will get a window that shows widget types. View the Sales type and select Top 10 List.
By clicking on the gear icon in the upper right corner of the widget, you can edit the widget name, add it to your dock, and choose whether or not to use the display chart view. You can also change what displays in the widget by filtering by Time Period, Type, Publication, and either Total Contract Value or Sales/Billing Dates. Click Save once you are done editing.
When the type filter is set to ‘Client’, the widget will link to the Annual Client Spend Report, which you can easily navigate to by clicking on the ‘View Details’ icon in the upper right corner.
The Targeted Display Inventory widget brings the Targeted Display Inventory Report directly to your dashboard. The widget can display your targeted display inventory in either table or pivot format, depending on how you want to view the data.
To begin, go to your Dashboard. The dashboard is your home page when you log in, or you can click on the Ad Orbit icon in the upper left corner of your page to navigate there.
If your System Configuration 'Enable User Widget Permissions' is turned on, you will need the User Permission 'Targeted Display Inventory' in order to access the widget.
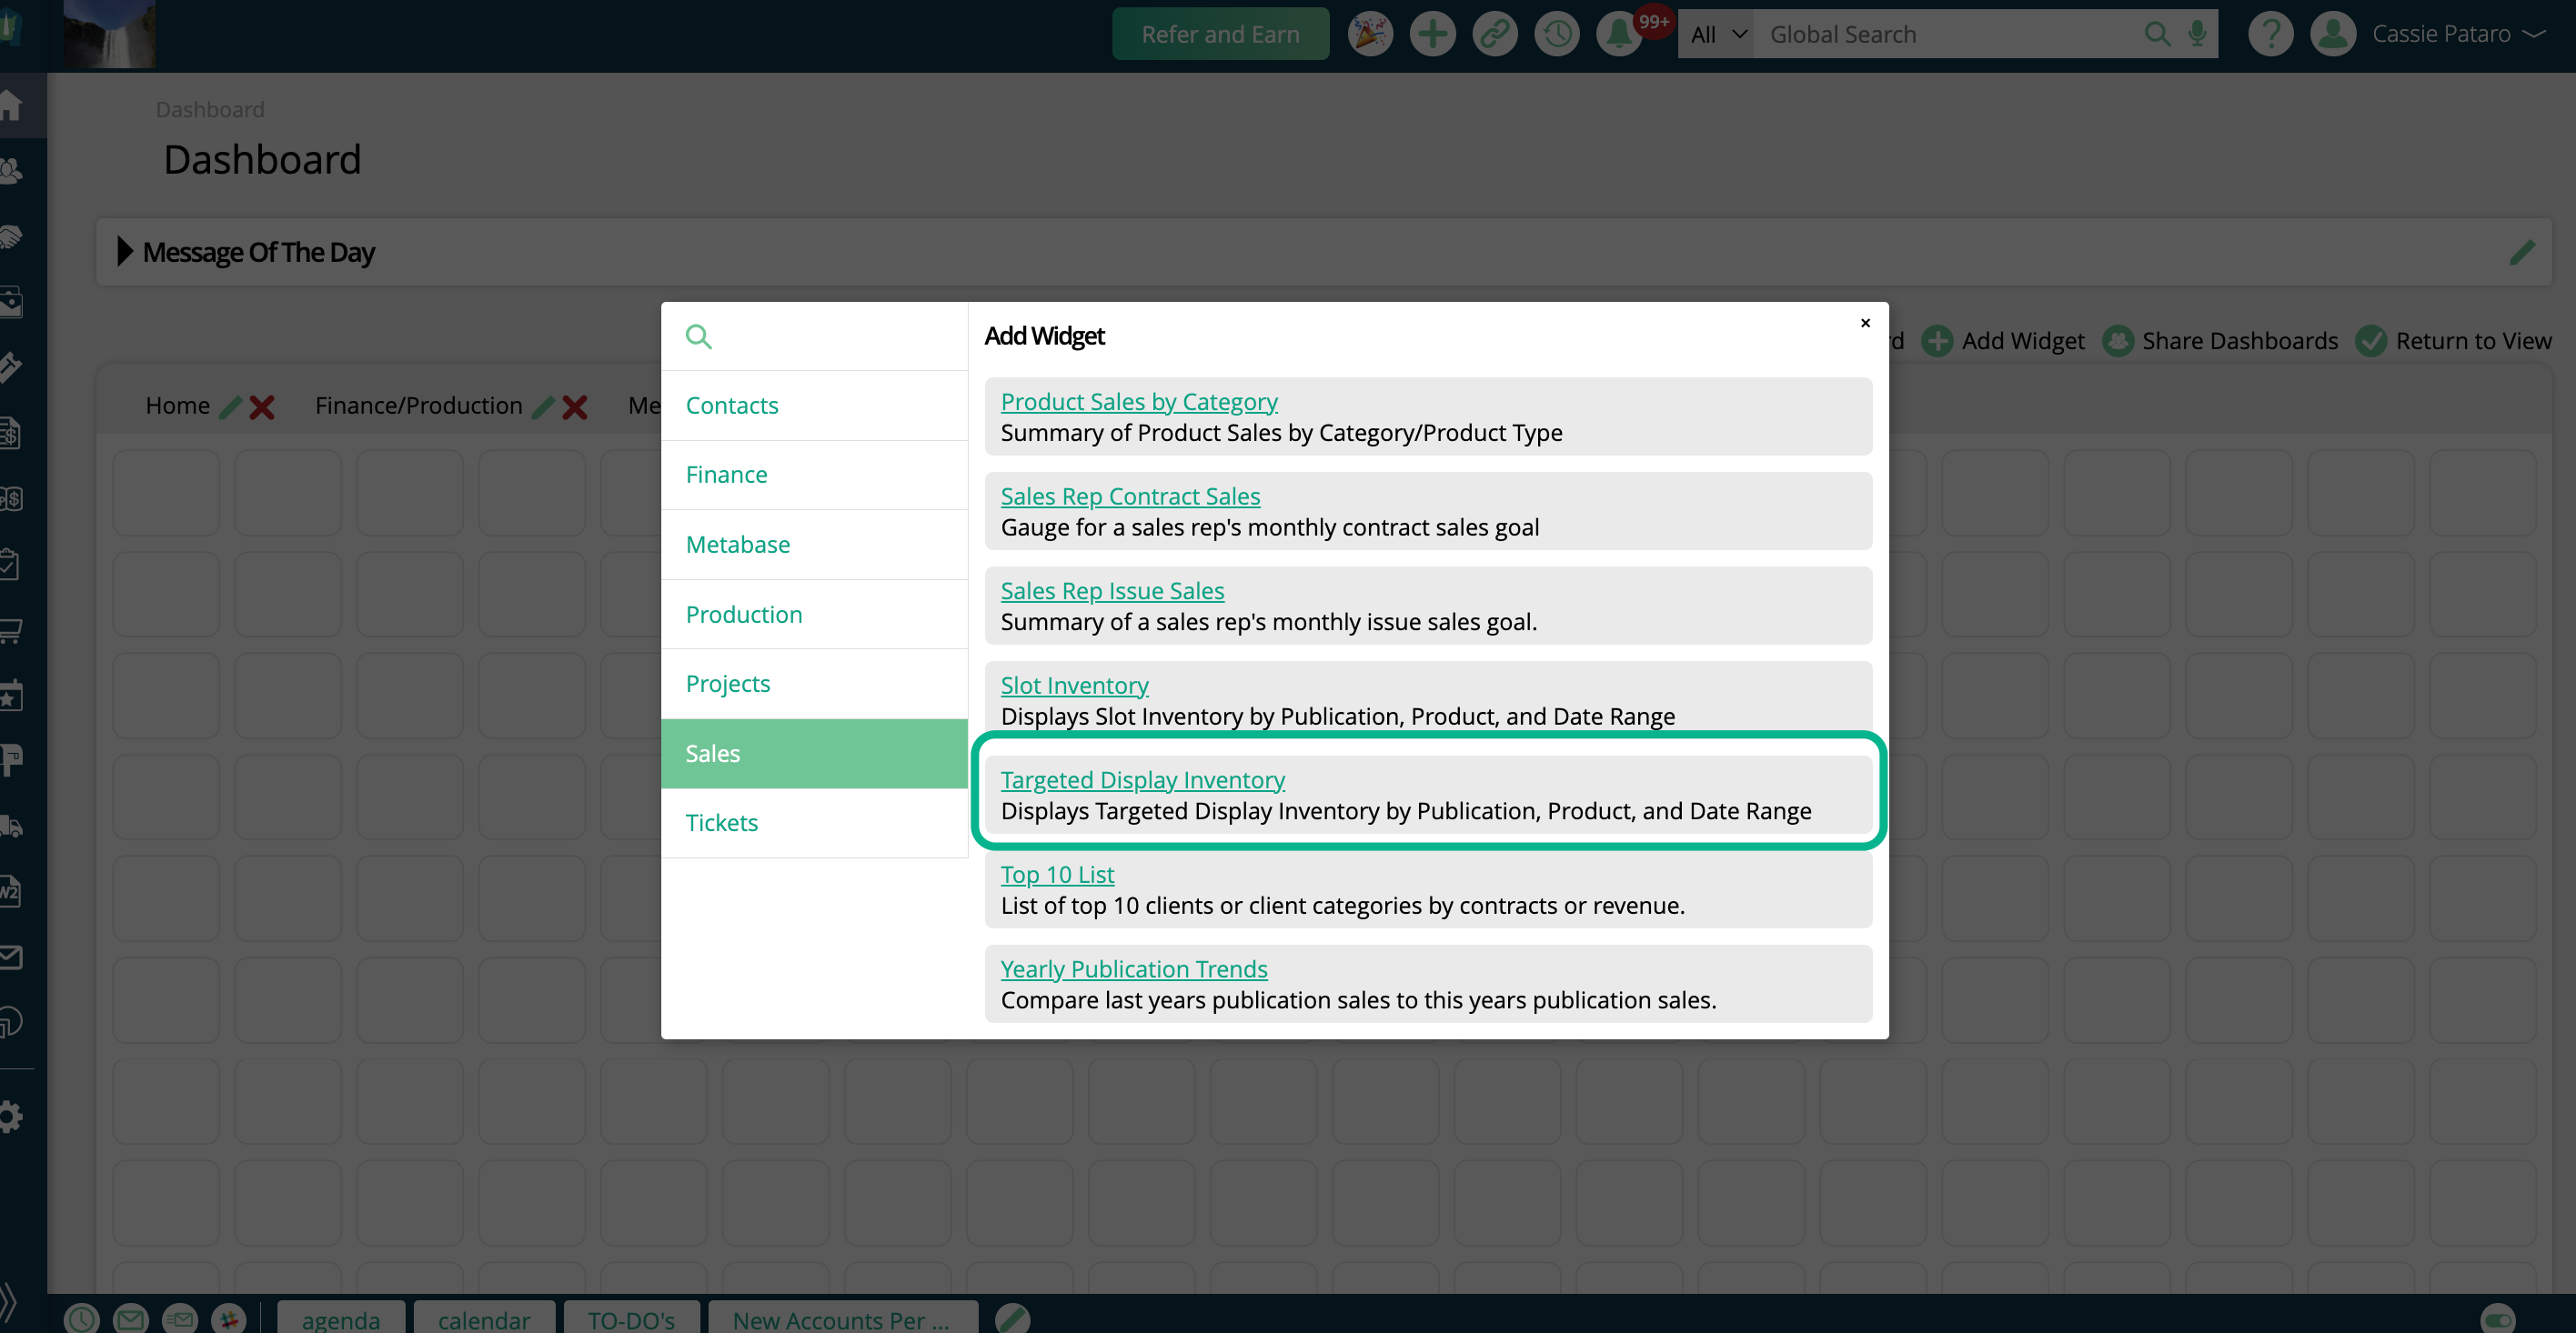
To add the widget, your dashboard needs to be in edit mode. Click on Edit Dashboard.
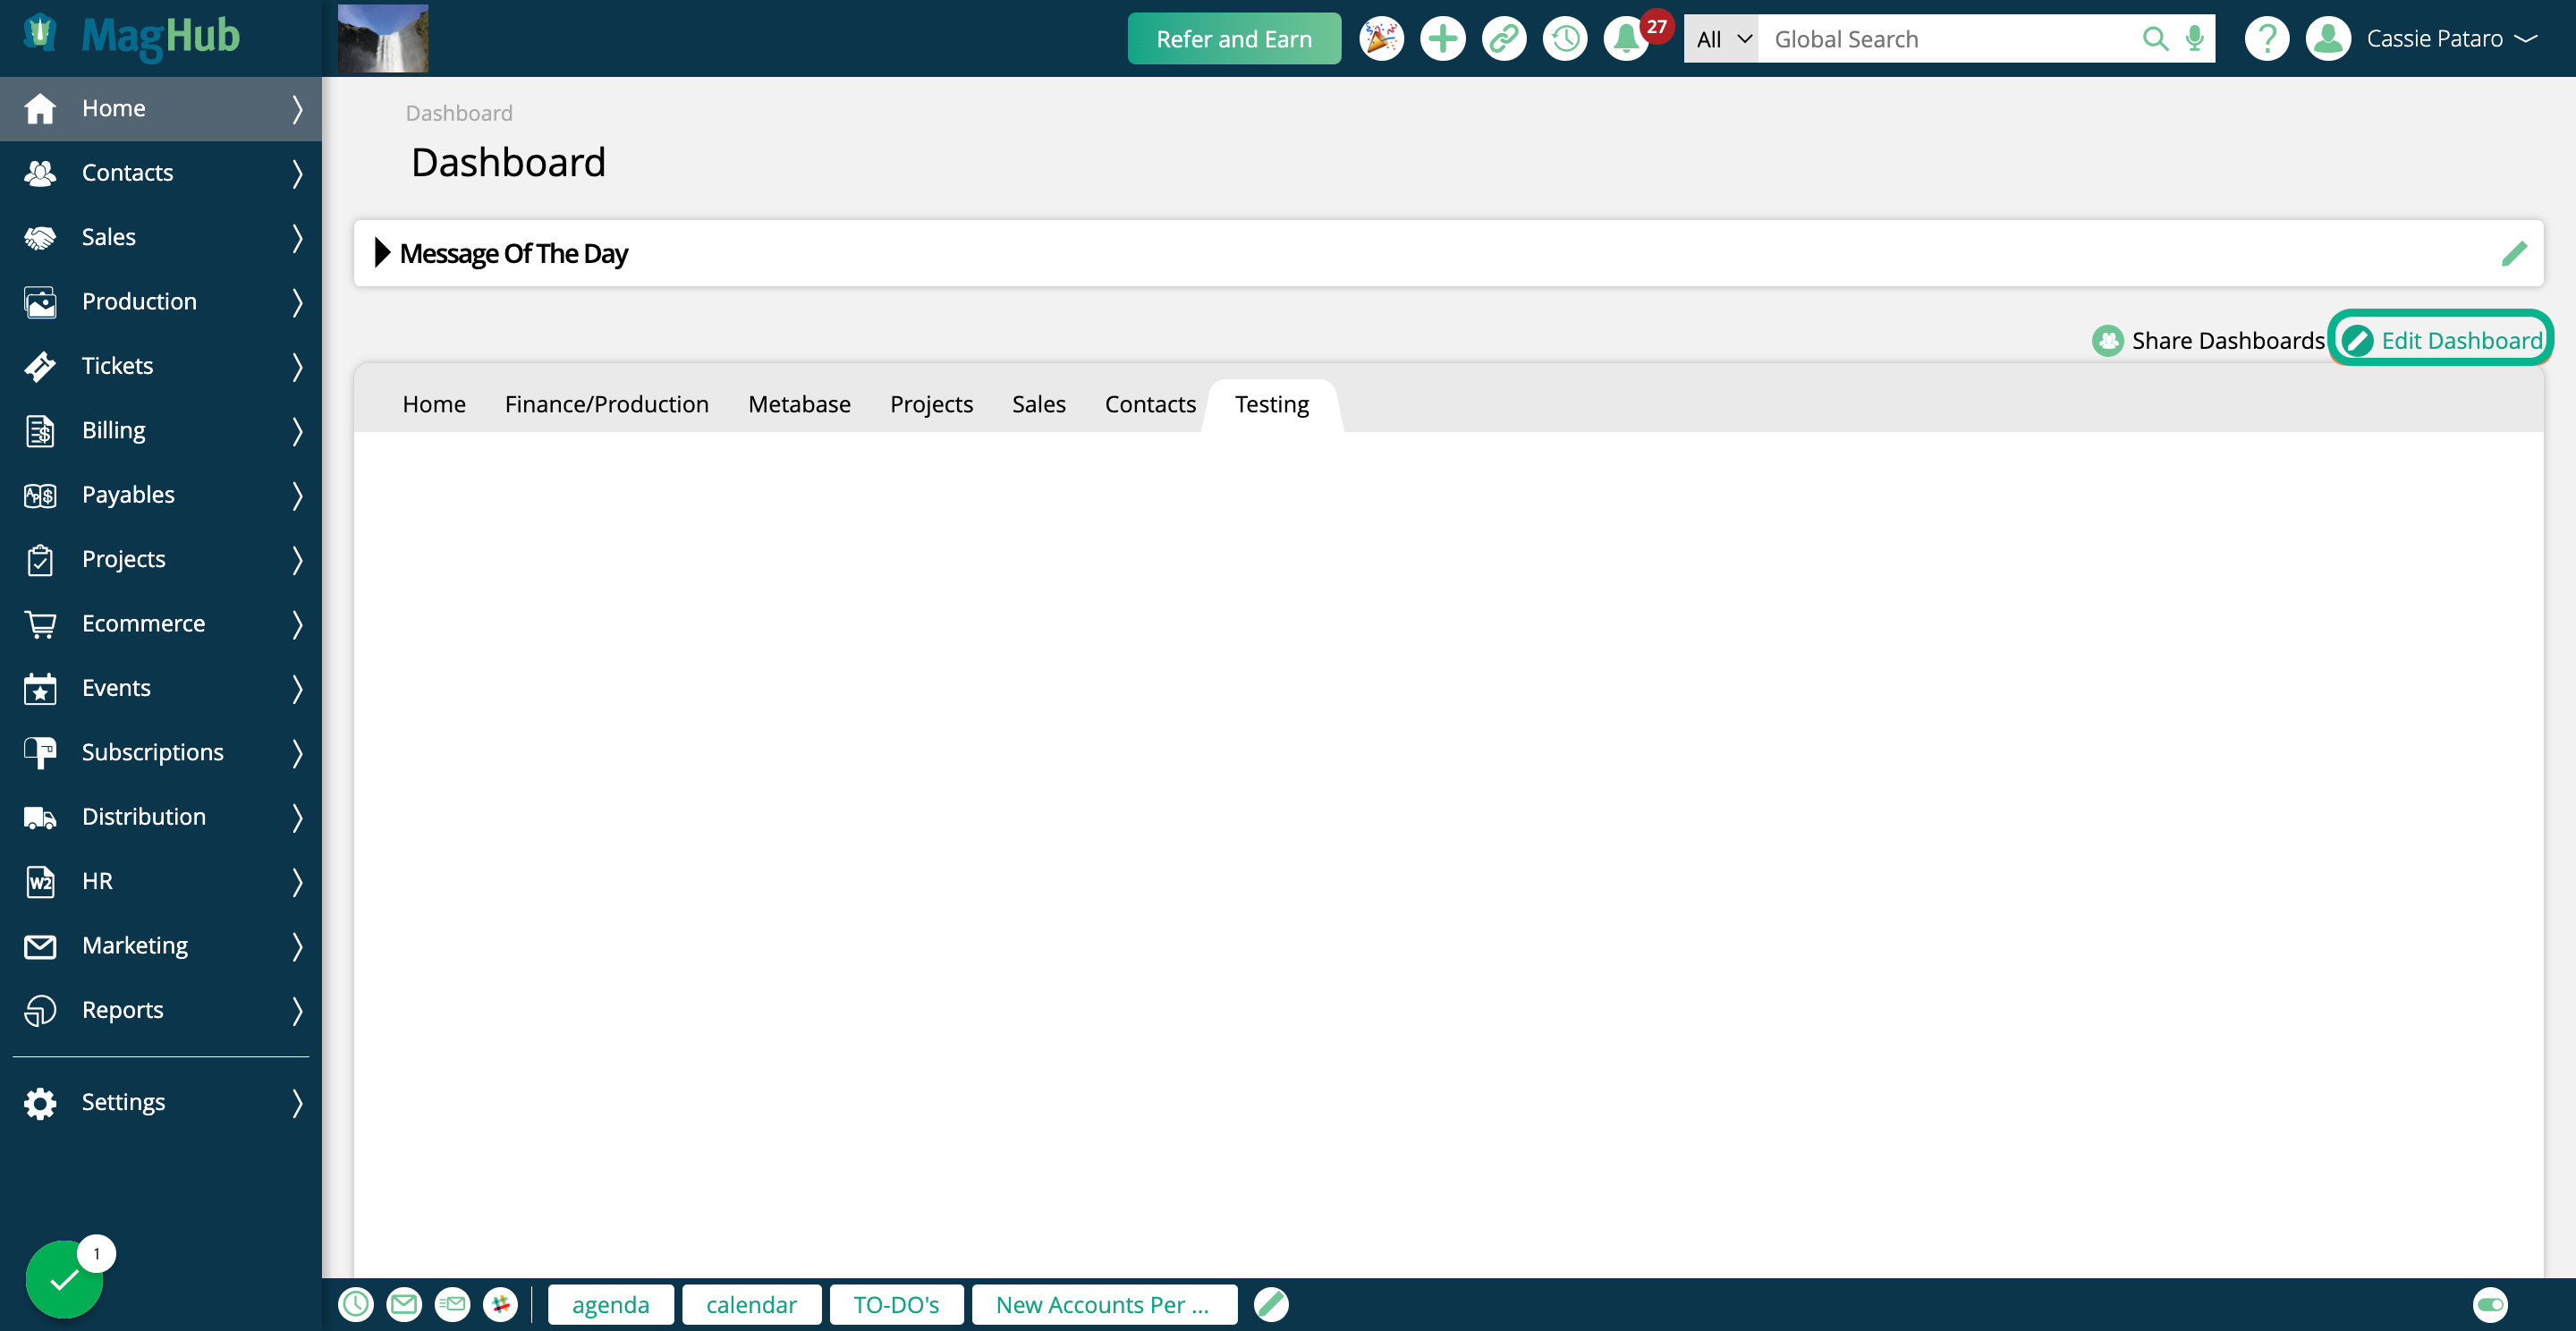
Click on Add Widget
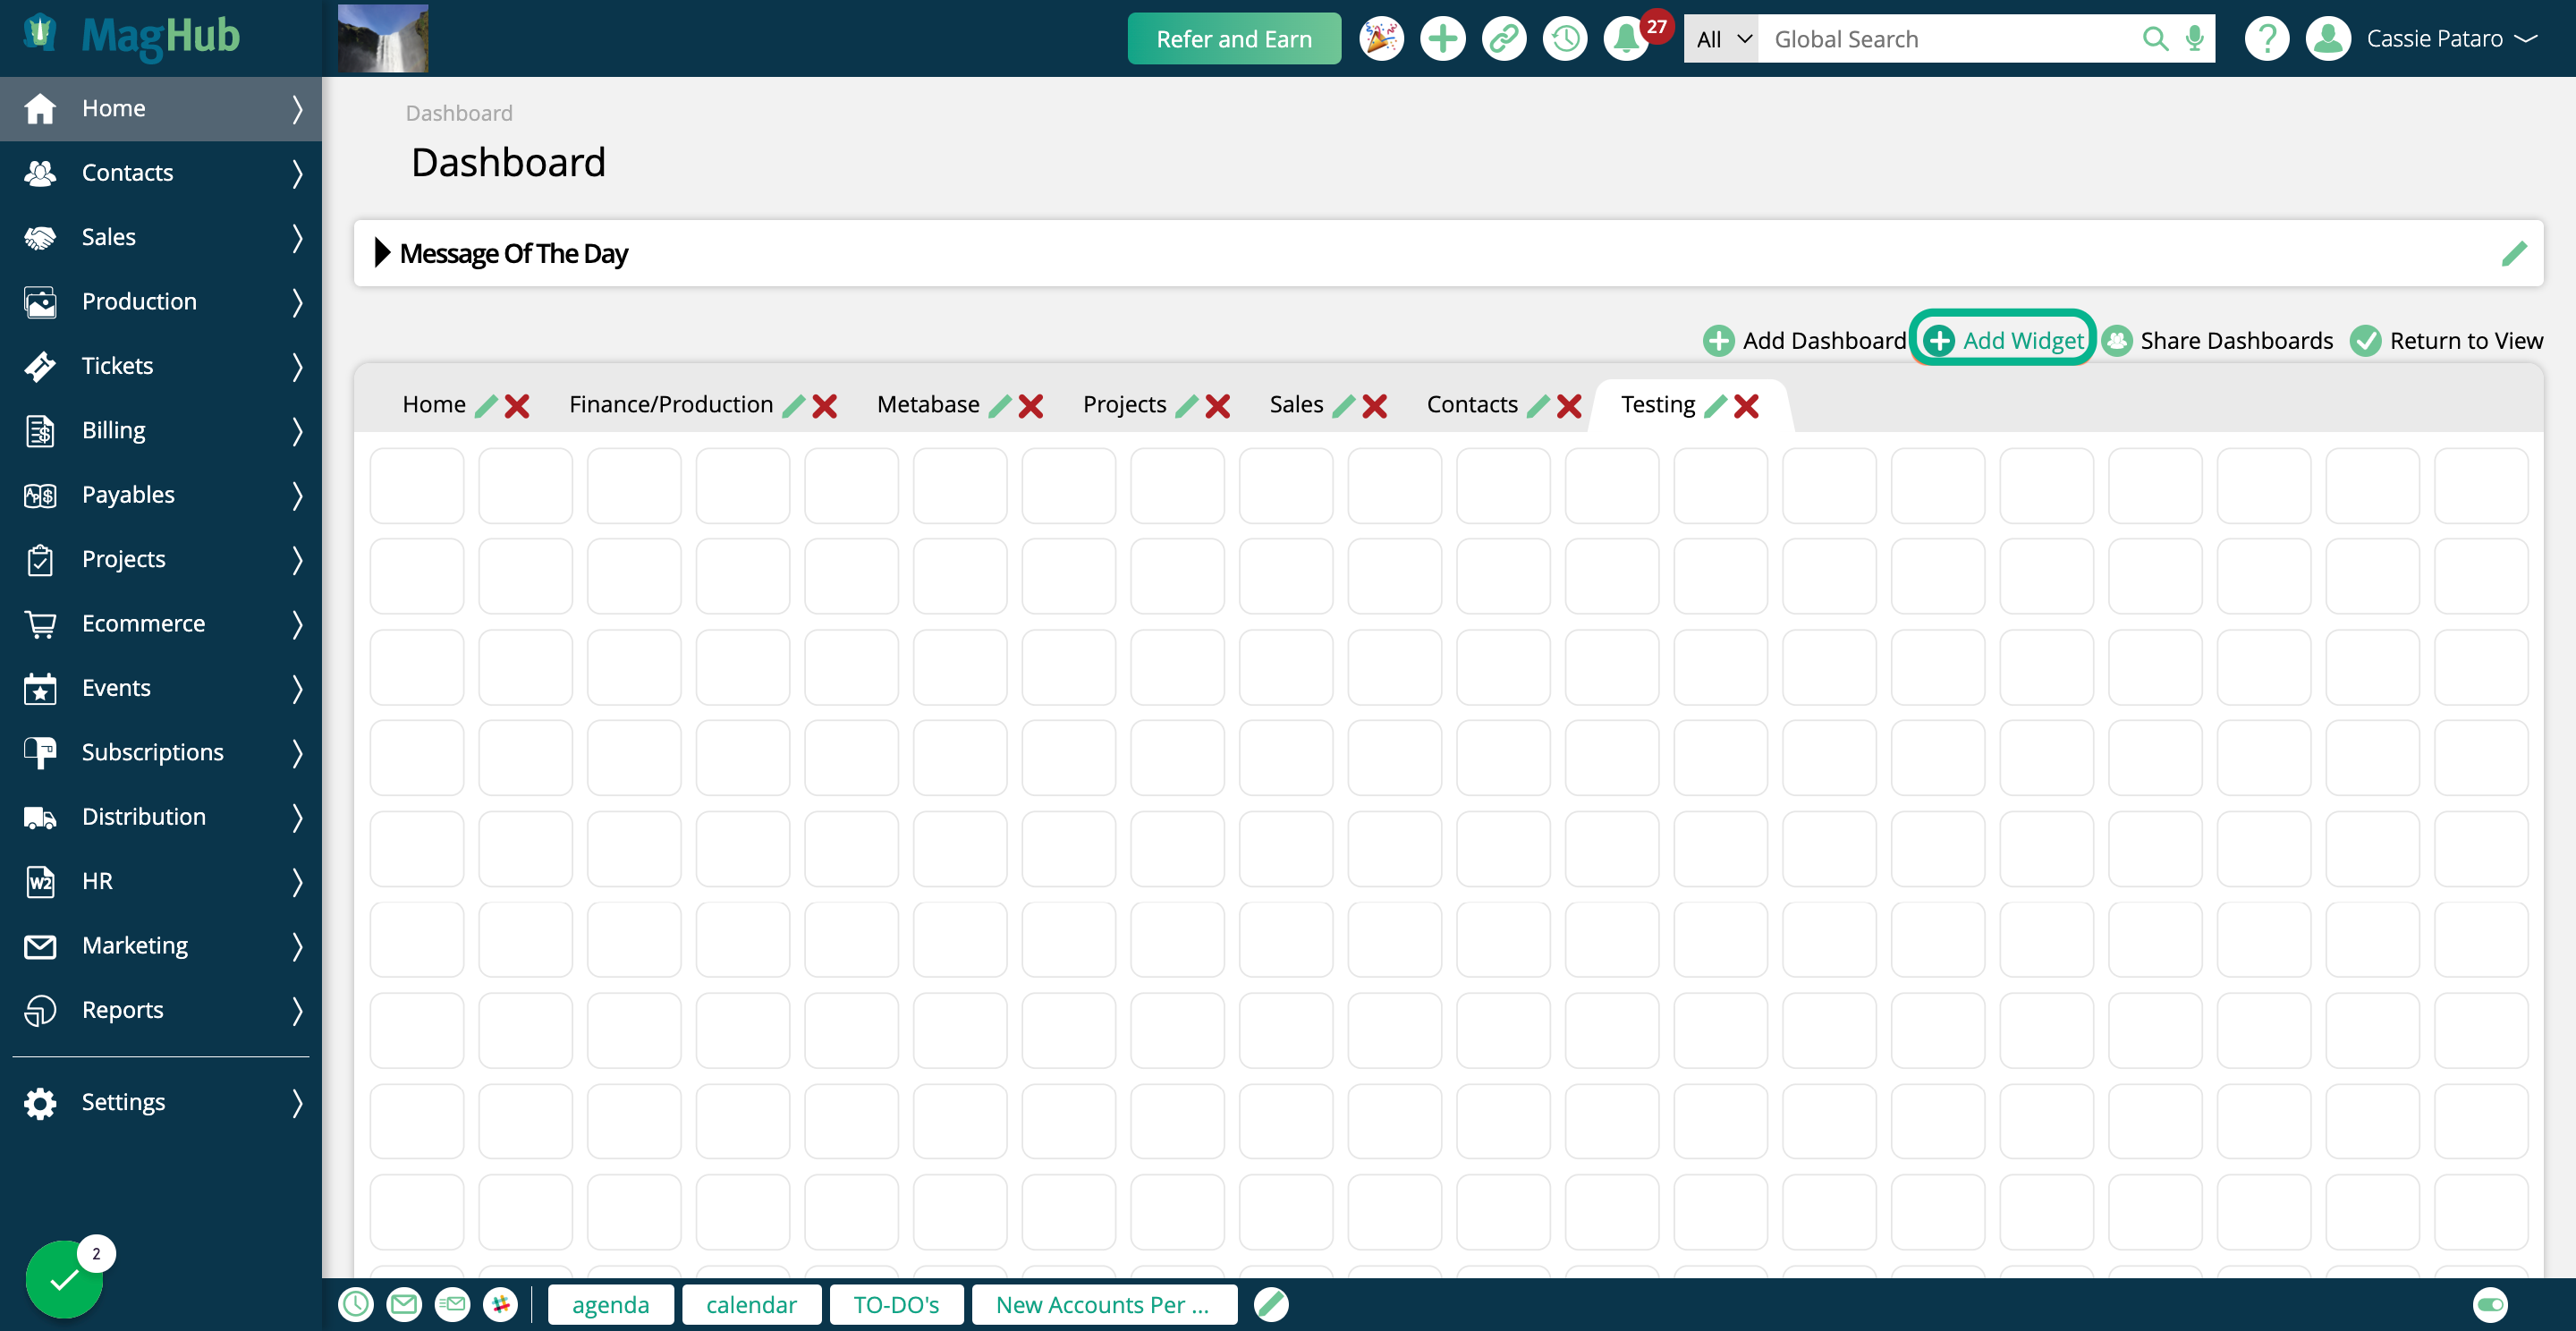
In the popup, click on Sales
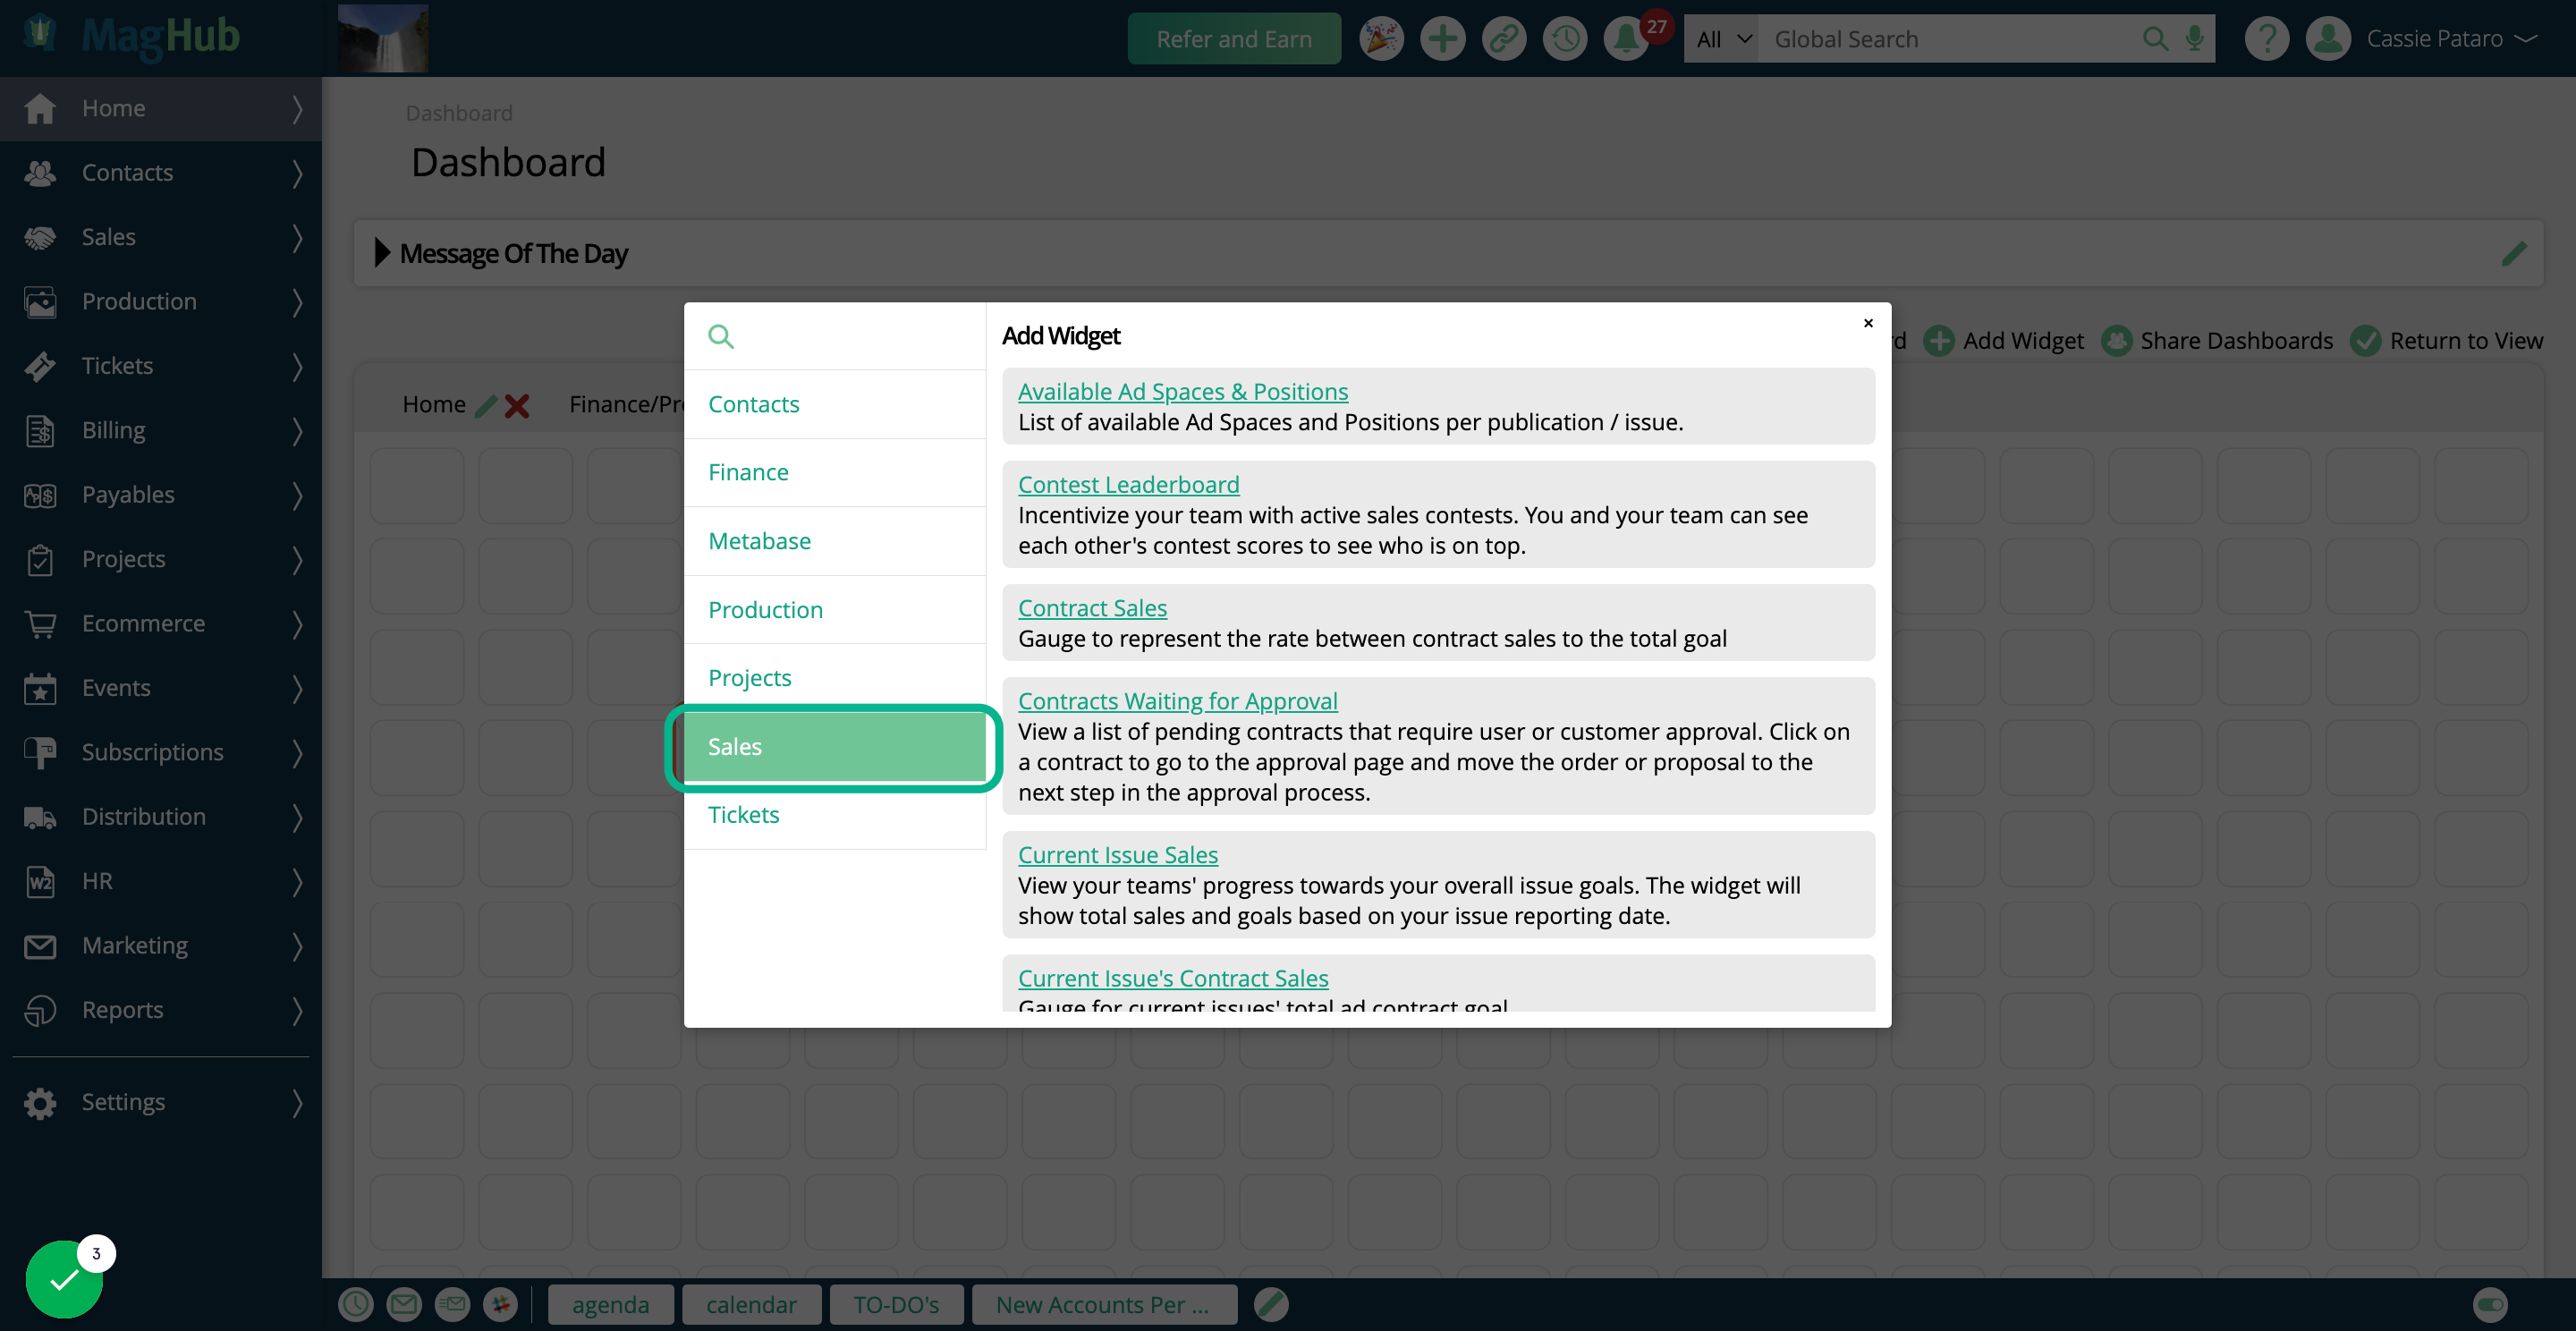
Then click on Targeted Display Inventory
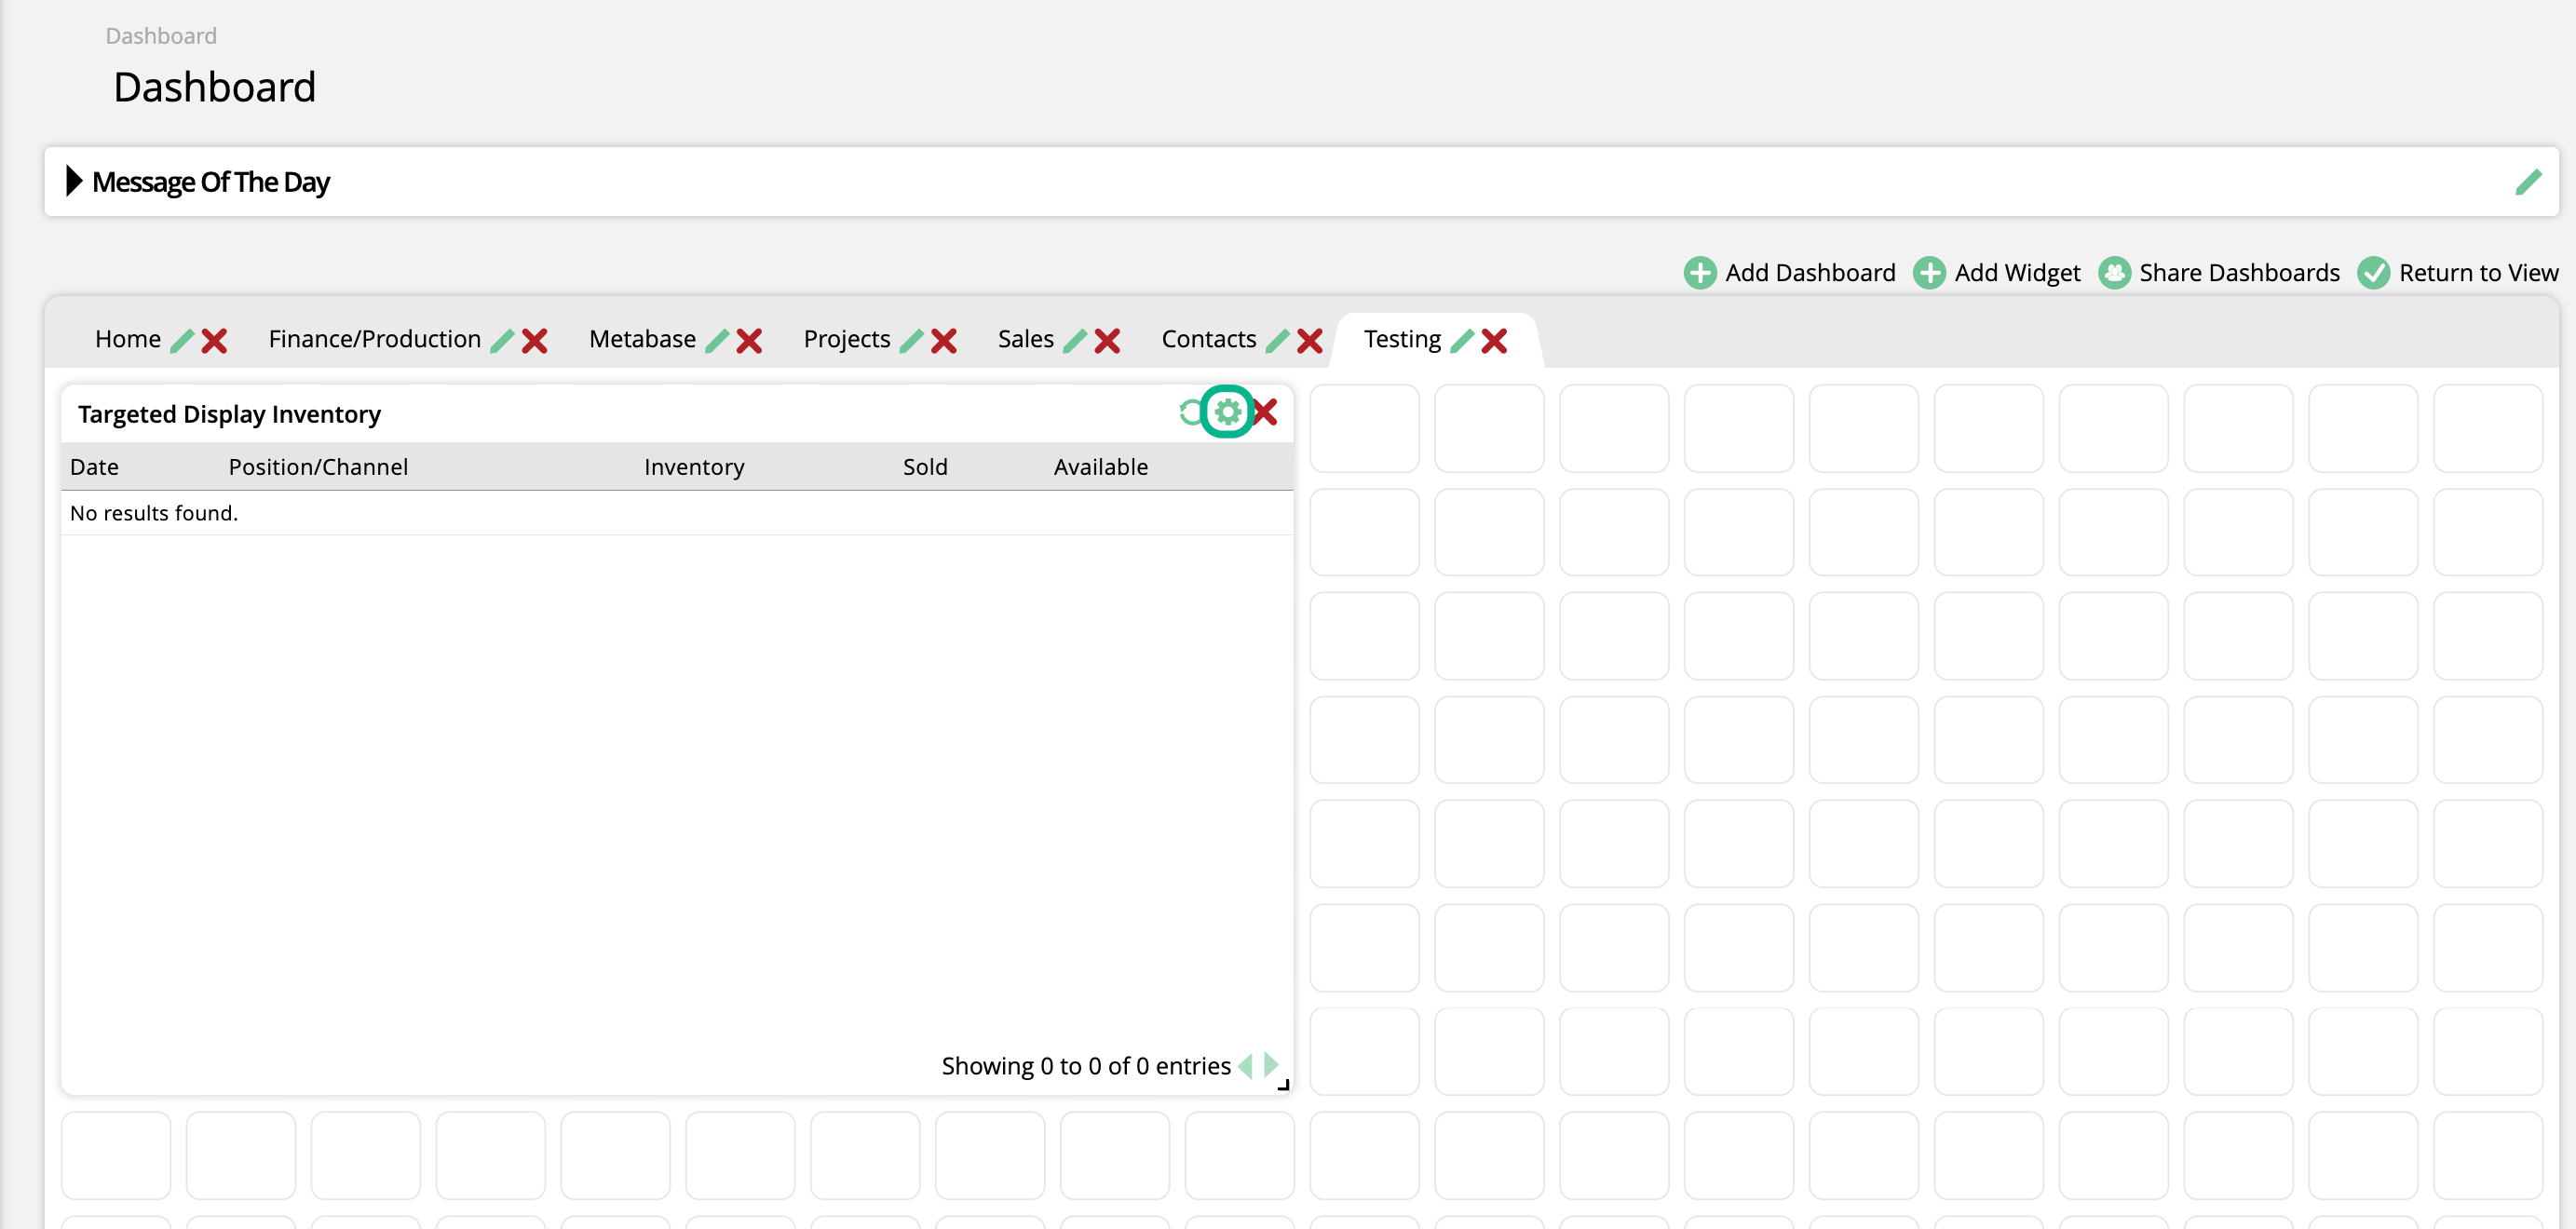
The widget will not display any information until you configure it, by clicking on the gear icon in the upper right corner.
In the edit popup, you can name your widget, and add it to the dock for easy access.
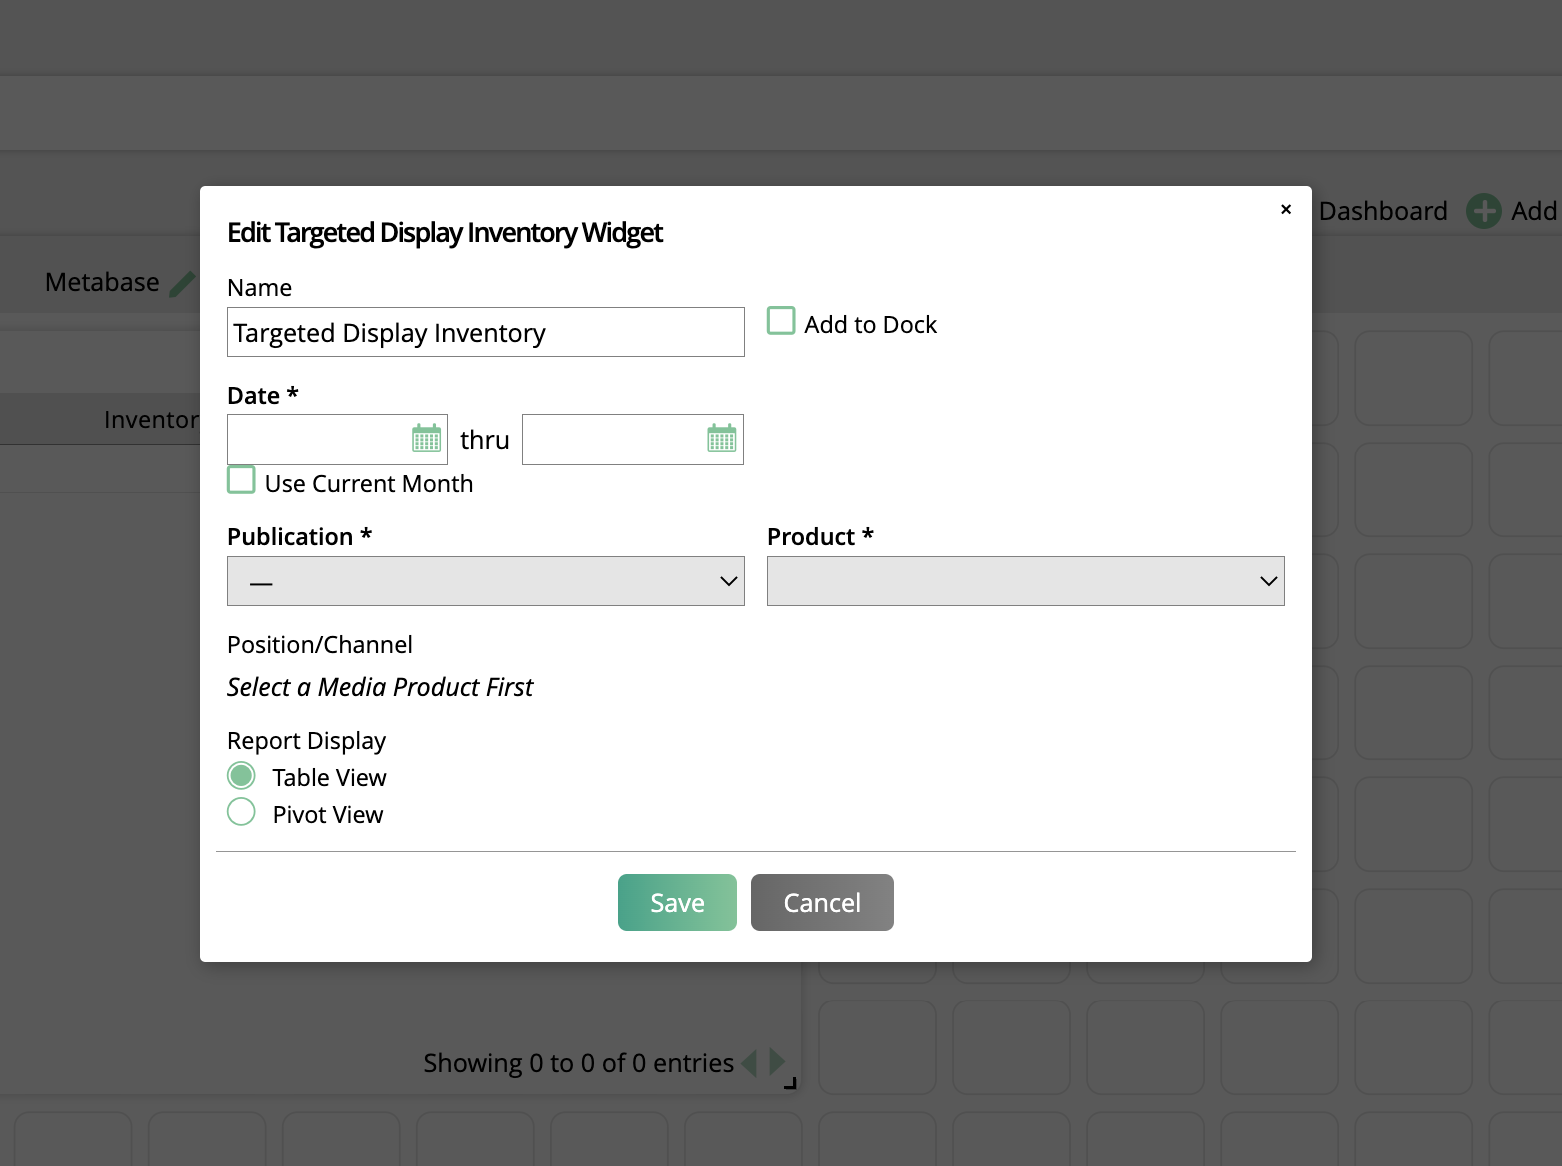
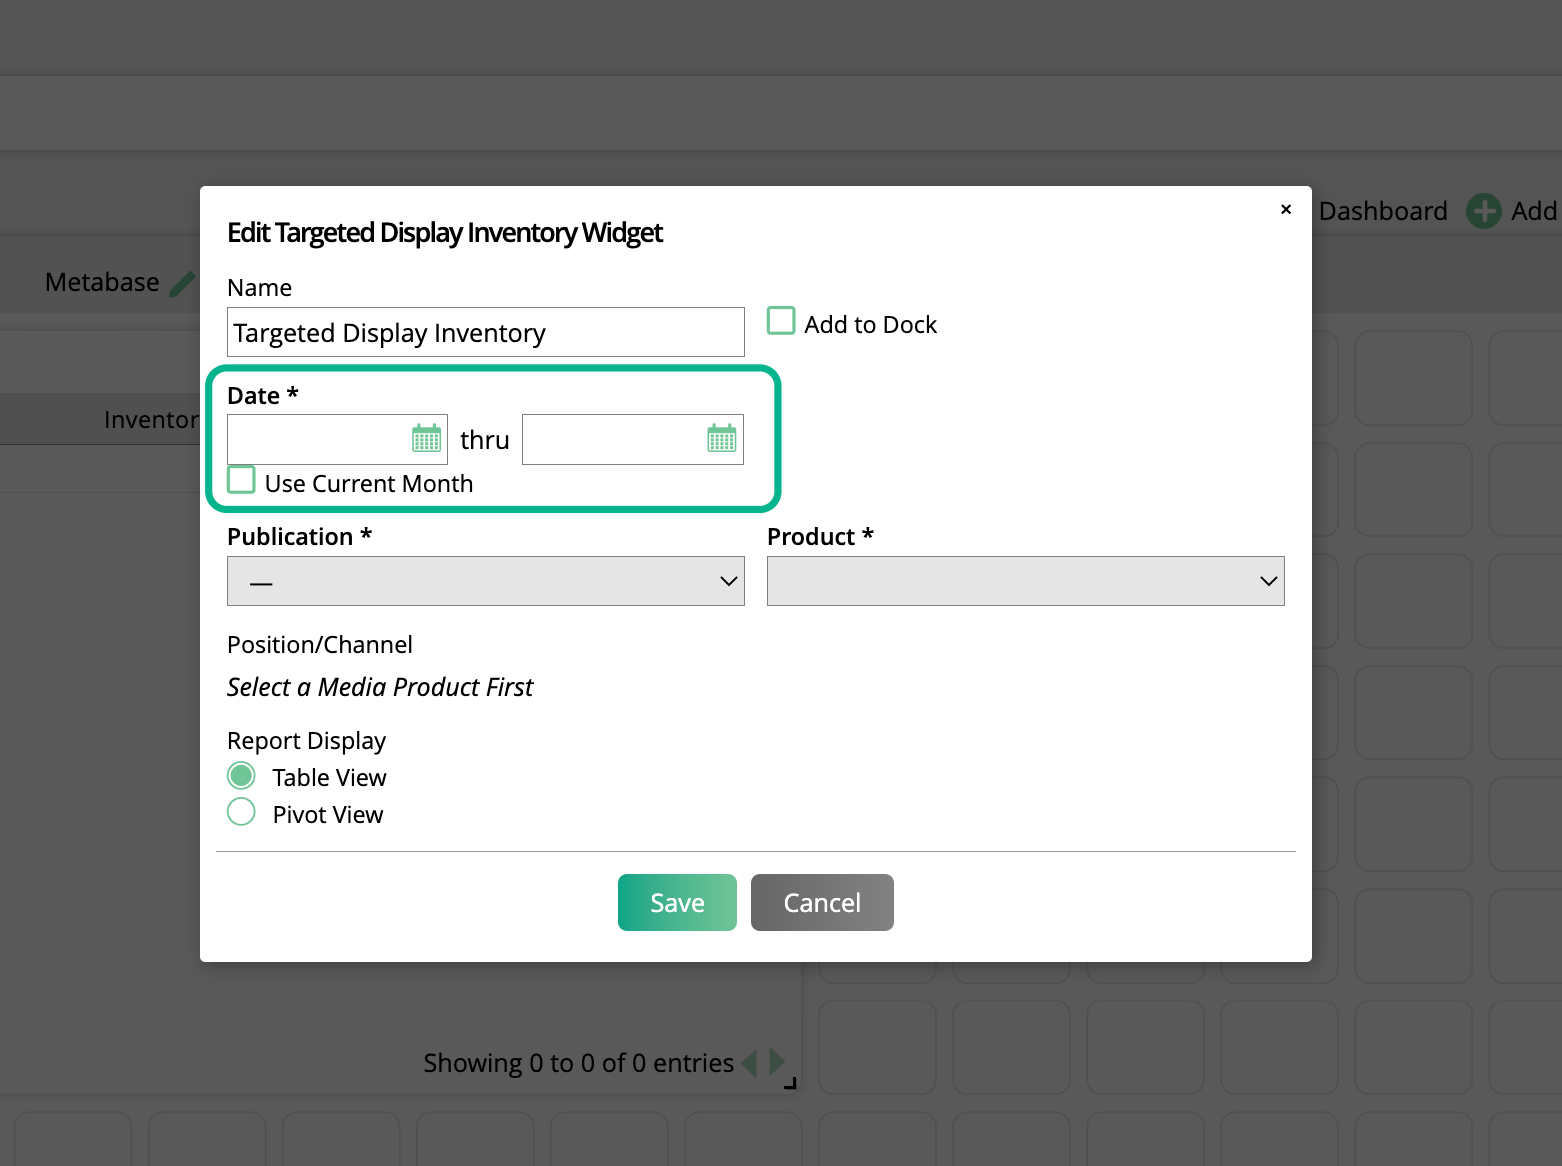
There are three required filters for the widget. The first is the date range.
By default, the date will be set to the current month. If you uncheck this option, you can enter a custom date range. Both a start and end date is required.
The next required field is the Publication.
You may only choose one Publication. Your Product list will be based on which Publication you choose.
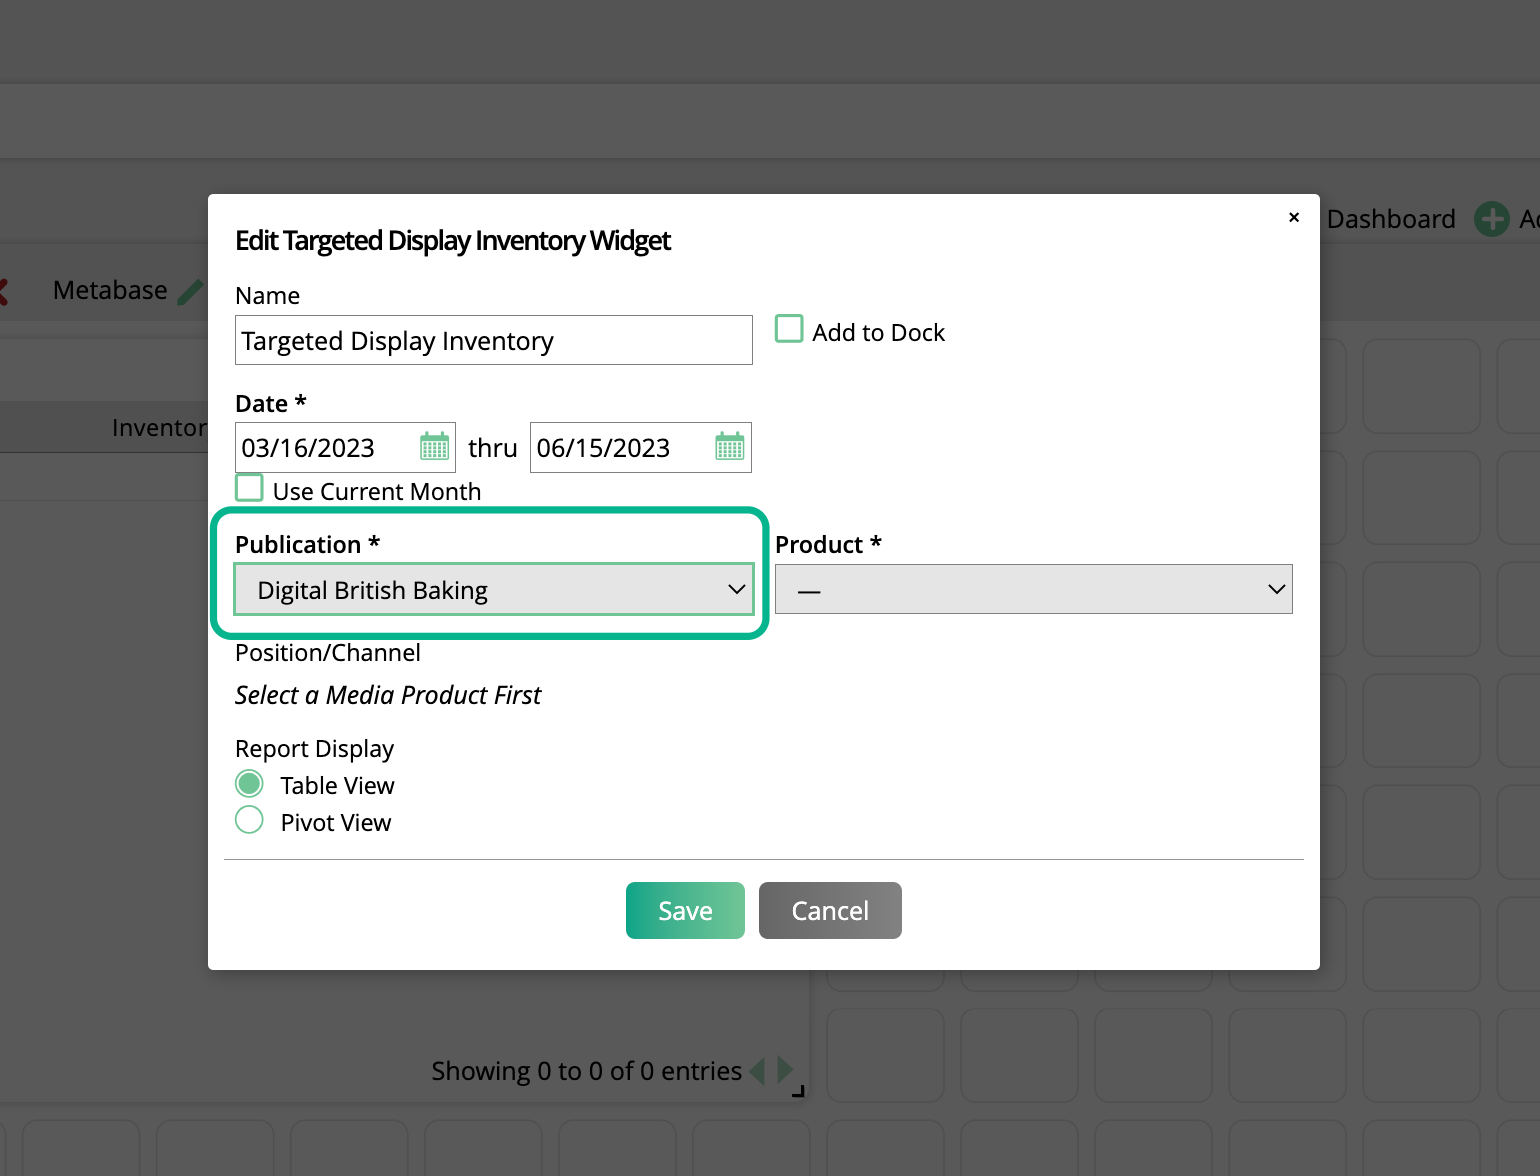
And finally, the last required field is Product.
The widget only supports viewing one Product at a time. If you need to see inventory data for multiple targeted display products, you will need to add multiple widgets to your dashboard. The Product chosen will determine what shows up in your Position/Channel field.
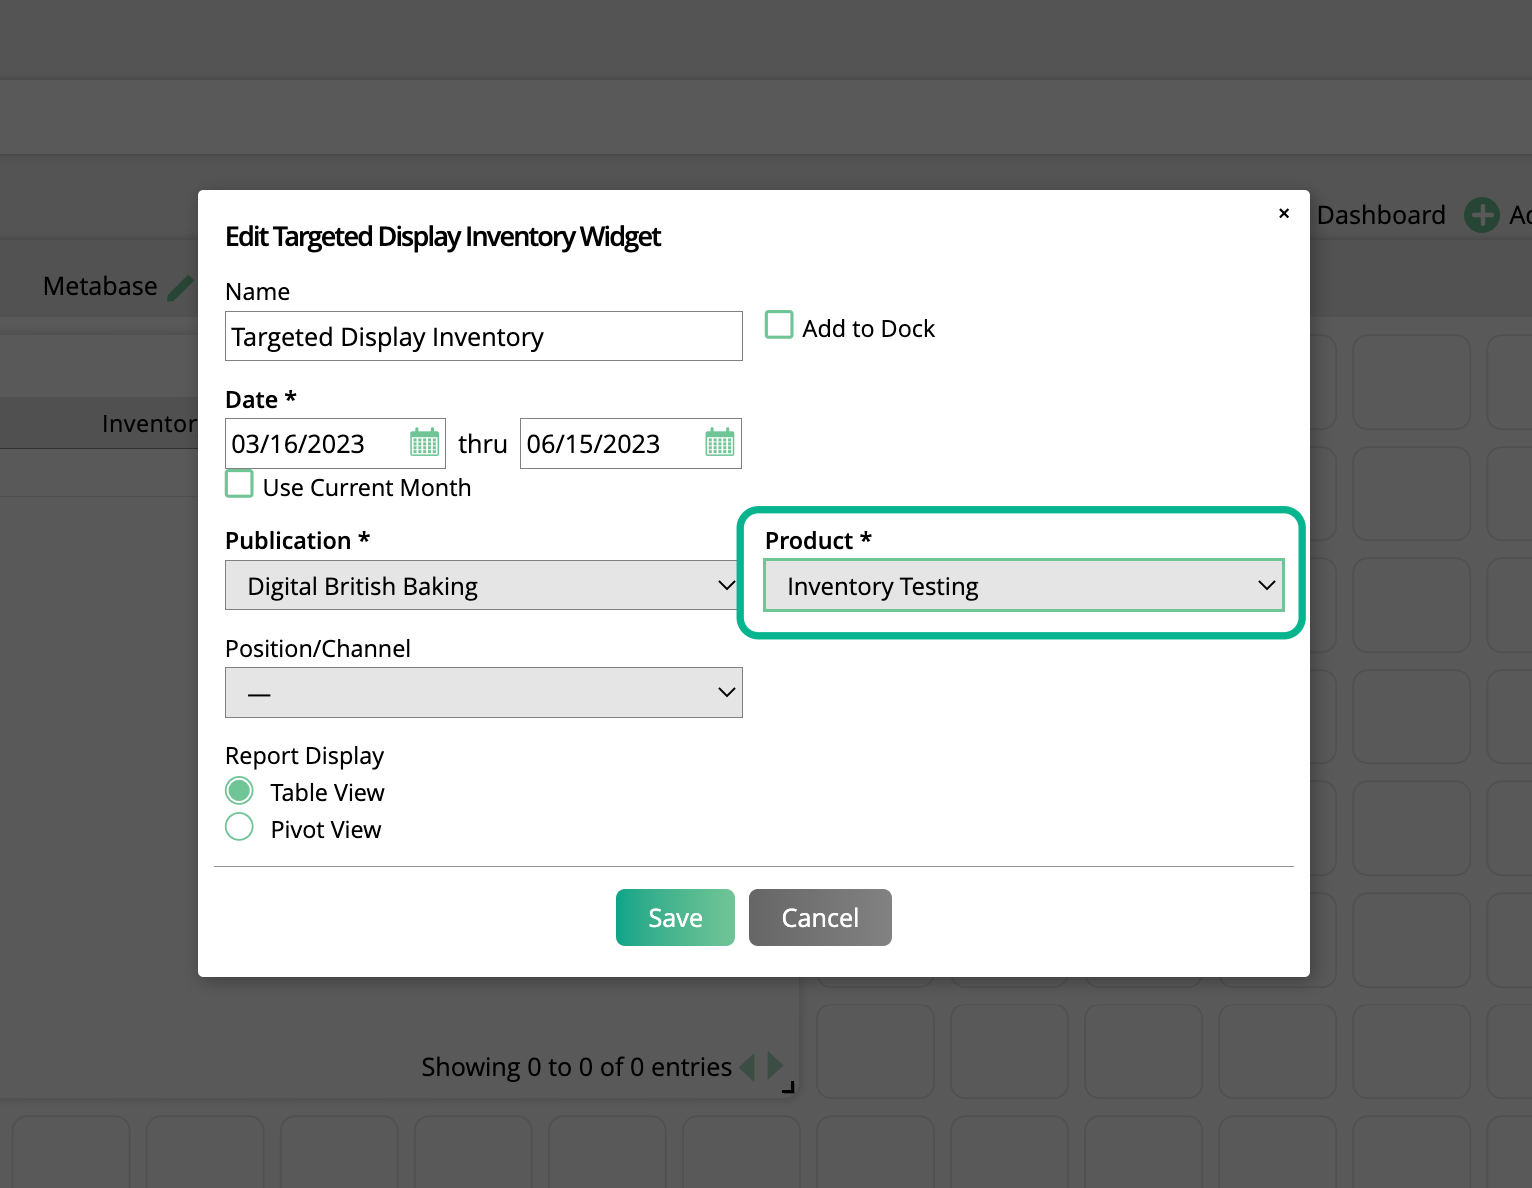
The Position/Channel field is optional, but can help narrow down your results if your targeted display product has multiple channels.
The Report Display lets you choose how your results are shown. These are the same options as the Targeted Display Inventory Report.
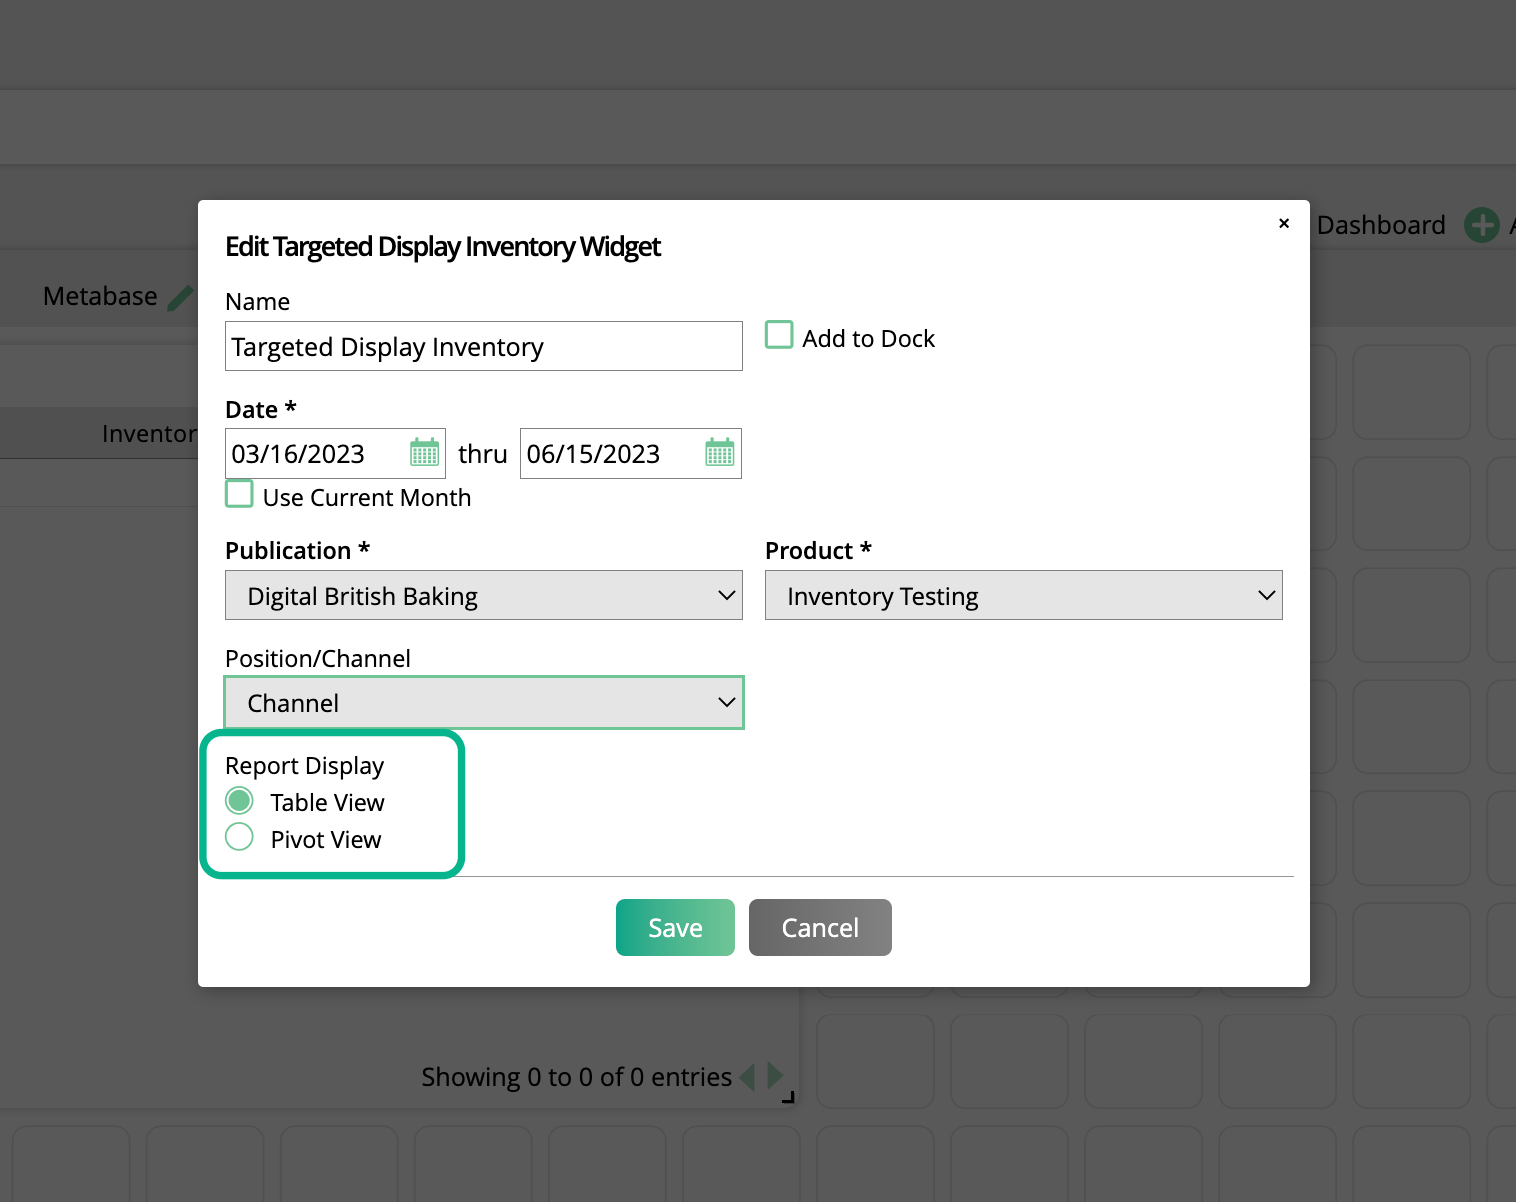
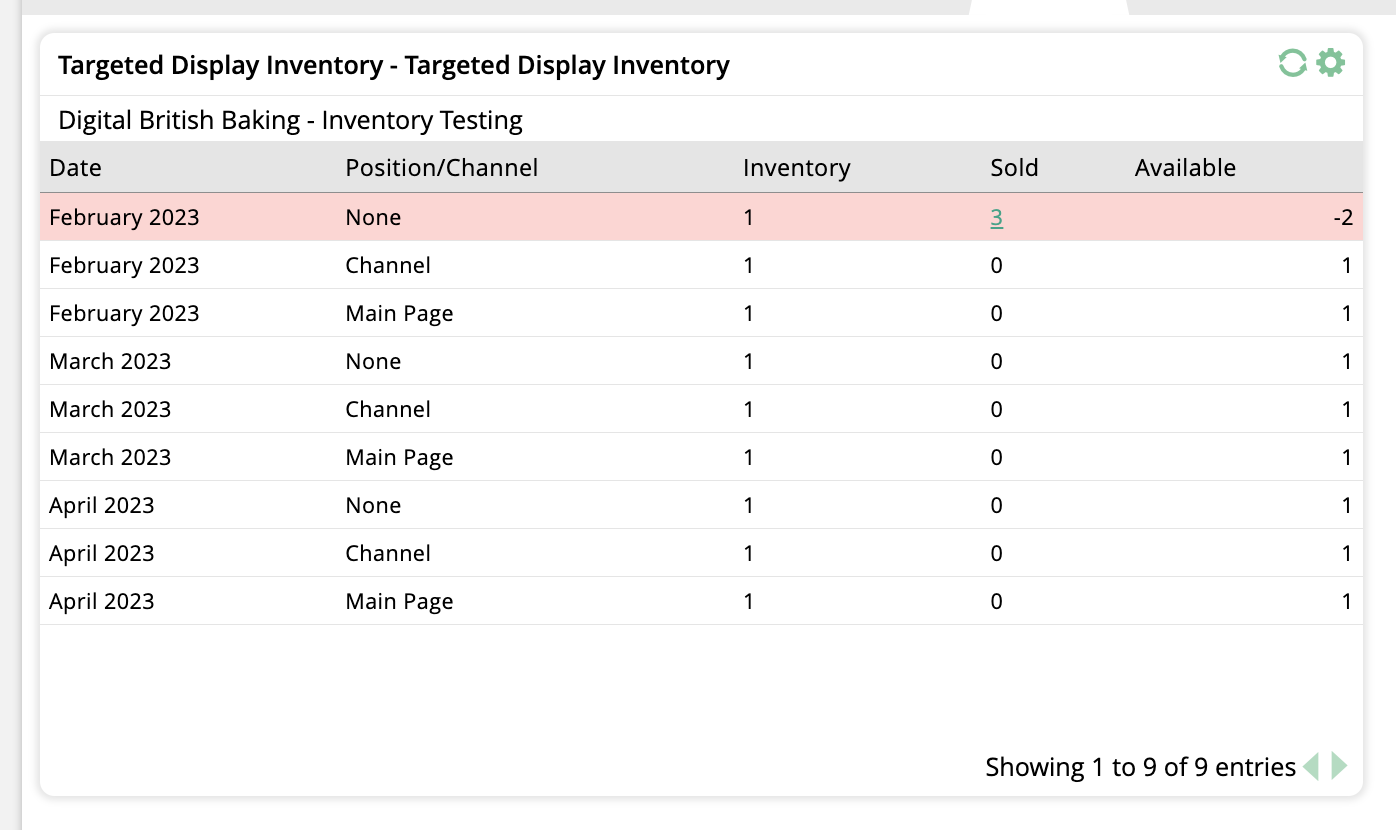
The table format is just what it sounds like, a table showing your targeted display inventory data. Each column header can be clicked on to sort the results by that column, and any oversold items will be highlighted in red.
Clicking on the value in the Sold column will redirect you to the Digital Media Snapshot report with certain search filters automatically filled in.
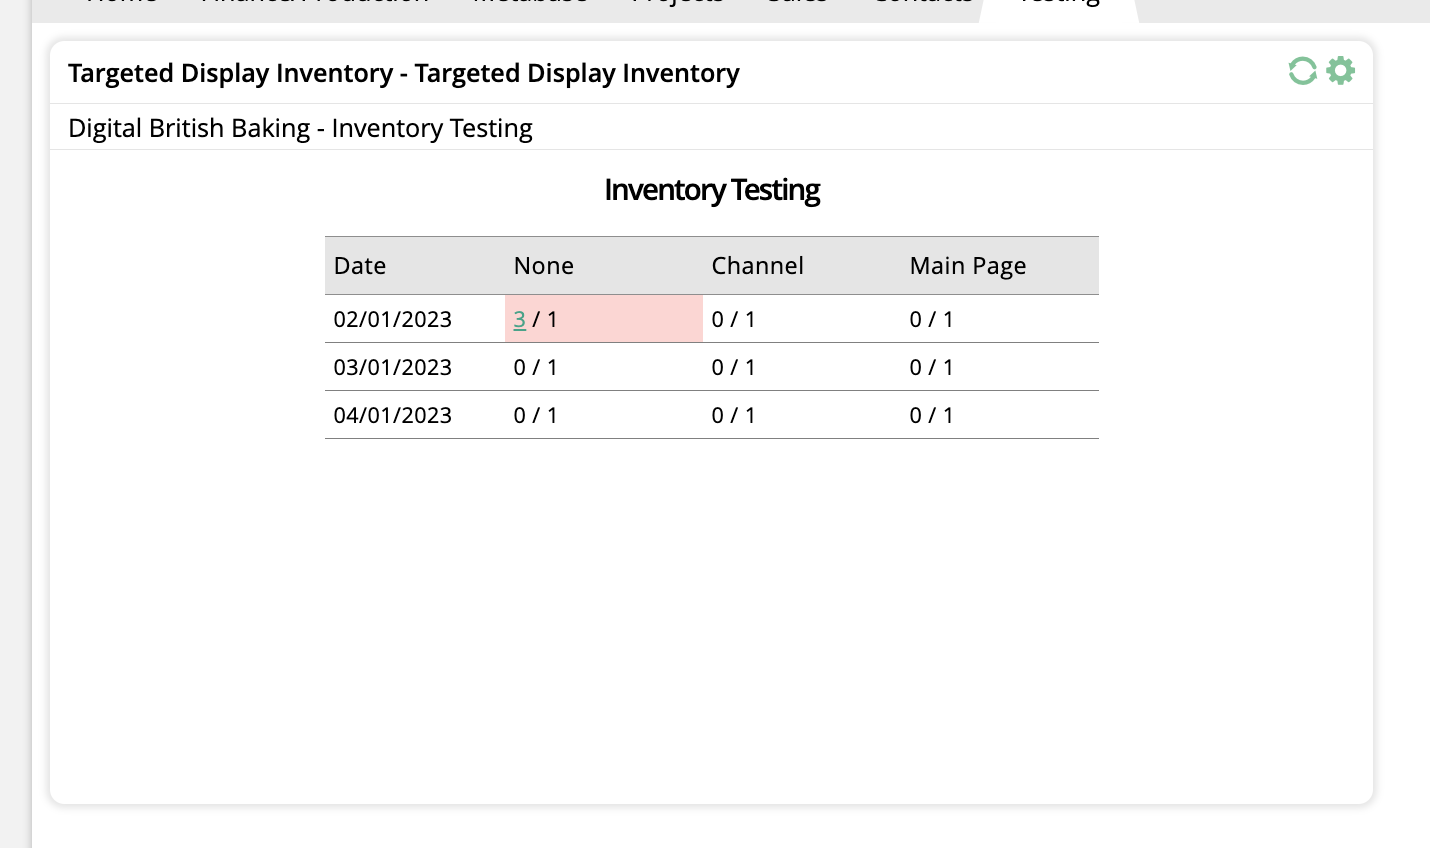
The pivot format is a visual representation of the same information contained in the table view.
Each date and channel for the product will show the sold amount first, followed by the inventory amount after the backslash.
Clicking on the sold amount will redirect you to the Digital Media Snapshot report with certain search filters automatically filled in.
Added 3/09/2023
The Yearly Publication Trends widget compares last year's publication sales to this year's sales. It displays the information in an easy to read chart broken down by month, and by hovering over a bar, you can see the exact value. It also shows last year’s total and this year’s total. For this widget, you can either choose to display contract stats or payment stats. The contract stats show you how many sales were made over the course of a year for publications. The payment stats display the actual payments made for those contracts. Both types can come in handy when looking at how your company is performing, compared to last year. It also lets you see any trends you may have over the course of a year.
To add the widget to your dashboard, make sure you are in edit mode. Click Add Widget in the upper right corner. You will get a window that shows widget types. View the Sales type and select Yearly Publication Trends.
By clicking on the gear icon in the upper right corner of the widget, you can edit the widget name, filter by contract or payments, and publication. You are also able to add this widget to your dock for easy access. Click save once you are done editing.
While in edit mode, you can choose to not display last year’s information or this year’s information in the chart by double clicking on ‘Last Year’ or ‘This Year’.
When you have the widget set to contracts, the data is pulled from the Publication YOY Comparison report, which you can navigate to, by clicking on the ‘view details’ icon in the upper right corner of the widget.
Sales contests help to incentivize your team. With the Contest Leaderboard widget, you and your team can see each other’s contest scores and who is in the lead. You can see the specific activities each participant has done to earn their points, and depending on your permissions, you are able to disqualify or reinstate points directly from the widget.
To add the widget to your dashboard, make sure you are in edit mode. Click Add Widget in the upper right corner. You will get a window that shows widget types. View the Sales type and select Contest Leaderboard.
No information will display on the widget until you configure it, by clicking on the gear icon in the upper right corner. You will need to select the sales contest that you want to display. You can also name the widget, and add it to your dock for easy access. Once you are done editing, click save.
The widget will display the name of the contest participant, their total points, their normal points value, and their bonus points value. By clicking on any of the table headers, you can sort the table results.
By clicking on the total points value, a pop-up will display which will show all of the activities the participant performed to earn their points.
Note
Depending on your permissions, you may have the ability to disqualify points by clicking on the trash can icon on the right side of the activity. When you click the icon, you can add notes as to why the points are being disqualified. You are also able to reinstate disqualified points.
The Current Issue Sales widget shows the rate between actual issue sales and the total goal. It allows you to view your team’s progress toward your overall issue goals based on your issue reporting date. The widget is easily configurable, so you can tailor the results to fit your needs. It also has various display types, so you can view your data in a gauge or a table.
To add the widget to your dashboard, make sure you are in edit mode. Click Add Widget in the upper right corner. You will get a window that shows widget types. View the Sales type and select Current Issue Sales.
By clicking on the gear icon in the upper right corner of the widget, you can name the widget and add it to your dock for easy access. You can also change how the data in the widget is displayed by choosing between a gauge, table by user, or table by publication. It also has many filters that make it easy to customize. When you are done editing, click Save.
You can choose from various time periods, including the current month or a custom date range.
There are conditional filters including media format, publisher, brand, and publication. Depending on what you choose for one of the filters, you will see different results populate the other filters. For example, if you select ‘digital’ for the media format filter, you will not be able to select a print publication. You will either be limited to a single publisher or be able to choose from any, depending on your system configurations.
You can also filter by order approval, for example, including sales that are 90% or higher likelihood. These percentages are dependent on your system configurations.
When the gauge display type is selected, the widget will show the chosen date range, the goal, the current sales, and the remaining sales in order to reach the goal. The gauge will display the percent of the goal that has been achieved.
If you choose either the table by user or the table by publication display type, then the widget will display the chosen date range, the current sales, the goal, and the percent of the goal that has been achieved. It will either break the results down by sales rep or by publication. You can further sort your results by clicking on any of the table headers.
The Sales Rep Issue Sales widget shows the rate between actual issue sales and the total goal for a specific rep. It allows you to view a rep’s progress toward their monthly issue sales goal. The widget is easily configurable, so you can tailor the results to fit your needs. It also has various display types, so you can view your data in a gauge or a table.
To add the widget to your dashboard, make sure you are in edit mode. Click Add Widget in the upper right corner. You will get a window that shows widget types. View the Sales type and select Sales Rep Issue Sales.
By clicking on the gear icon in the upper right corner of the widget, you can name the widget, and add it to your dock for easy access. You can also change how the data in the widget is displayed, by choosing between a gauge, or table by publication. It also has many filters which make it easily customizable. When you are done editing, click save.
You can choose from various time periods, including the current month or a custom date range.
There are conditional filters, including media format, publisher, brand, and publication. Depending on what you choose for one of the filters, you will see different results populate the other filters. For example, if you select ‘digital’ for the media format filter, you will not be able to select a print publication. You will either be limited to a single publisher, or be able to choose from any, depending on your system configurations.
The default probability of orders to include in the widget results are 100% confirmed orders, but you can choose from other probabilities, such as 90% or higher. These percentages are dependent on your system configurations.
You must also choose a user. Depending on your permissions, you will either only be able to see data for your sales, or you will be able to select from all users.
When the gauge display type is selected, the widget will show the chosen date range and user, the goal, the current sales, and the remaining sales in order to reach the goal. The gauge will display the percent of the goal that has been achieved.
If you choose the table by publication display type, the widget will display the chosen user and date range. The table will show the results by publication, month, year, the current sales, the goal, and the percent of the goal that has been achieved. You can further sort your results by clicking on any of the table headers.
The Past Days Contract Sales widget displays the total contract sales for previous days in an easy to read bar chart, broken down by day. The widget also shows the total sales for all of the days that are displaying. By hovering over one of the bars, you can see the exact value. This is a great widget for getting a snapshot of very recent sales activity.
To add the widget to your dashboard, make sure you are in edit mode. Click Add Widget in the upper right corner. You will get a window that shows widget types. View the Sales type and select Past Days Contract Sales.
By clicking on the gear icon in the upper right corner of the widget, you can name the widget, and choose how many previous days you wish to display, ranging from one to fourteen. You are also able to add this widget to your dock for easy access. Once you are done editing, click save.
The data for this widget is pulled from the Daily Order Sales report, which you can navigate to by clicking on the ‘view details’ icon in the upper right corner of the widget. The report will automatically fill in the start and end date, based on your widget configurations
Within a chosen period of time, the New vs Existing Customer Sales widget will show either the order count or value, and whether the customer is new or existing, broken down by sales rep. This allows you to get a quick summary view of recent orders, and see how your sales reps are performing. If there are no values in the given time frame for a specific rep, they will not display in the table.
To add the widget to your dashboard, make sure you are in edit mode. Click Add Widget in the upper right corner. You will get a window that shows widget types. View the Sales type and select New vs. Existing Customer Sales.
By clicking on the gear icon in the upper right corner of the widget, you can name the widget, and choose from various time periods. You can also choose from order count and order value. Order count shows the number of orders in the selected period of time, while the order value shows the total monetary amount of the orders within that period of time. You are also able to add this widget to your dock for easy access. Once you are done editing, click save.
A company is considered New based on your system’s New Account Range configuration. To have a sale for a new company display in the widget, there must be an approved order within the selected time period. If a company moves from New to Existing, you will see that reflected in the widget.
The % New column will change based on whether you selected Order Count or Order Value. The Order Count percentage does not take into account how much money each of the orders was for, it simply reflects the number of orders.
The Product Sales by Category widget shows a summary of all product sales based on a specific time period, product category, and either contract value or sales/billing dates. You can choose to view the results in either a list, or in a display chart. Hovering over each bar in the display chart will show the exact value. This widget is great for seeing a summary view of your most profitable products.
To add the widget to your dashboard, make sure you are in edit mode. Click Add Widget in the upper right corner. You will get a window that shows widget types. View the Sales type and select Product Sales by Category.
By clicking on the gear icon in the upper right corner of the widget, you can edit the widget name, add it to your dock, and choose whether or not to use the display chart view. You can also change what displays in the widget, filtering by time period, type of product, and either Total Contract Value or Sales/Billing Dates.
For the Type field, you have the choice of impressions, product category, services, and slots. The results for each type that display in the widget are dependent on your system configurations. Click save once you are done editing.
Important
Whether or not you have the option to select Impressions or Slots for the Type field is dependent on if you have the Digital Media Module enabled in your system configurations.
The Product Sales widget shows a summary of all product sales based on a specific time period and product category, filtered by rep or publication. Unlike the Product Sales by Category widget, the Product Sales widget includes data about print and digital ads.
To add the widget to your dashboard, make sure you are in edit mode. Click Add Widget in the upper right corner. You will get a window that shows widget types. View the Sales type and select Product Sales.
By clicking on the gear icon in the upper right corner of the widget, you can edit the widget name or add it to your dock. You can also change what displays in the widget, filtering by time period and choosing how the results are grouped.
When on your dashboard, the widget will show sales for the time period selected, based on the grouping you chose for your widget settings.
The Slot Inventory widget brings the Slot Inventory Report directly to your dashboard. The widget can display your slot inventory in either table or pivot format, depending on how you want to view the data.
To begin, go to your Dashboard. The dashboard is your home page when you log in, or you can click on the Ad Orbit icon in the upper left corner of your page to navigate there.
To add the widget, your dashboard needs to be in edit mode. Click on Edit Dashboard.
Click on Add Widget
In the popup, click on Sales
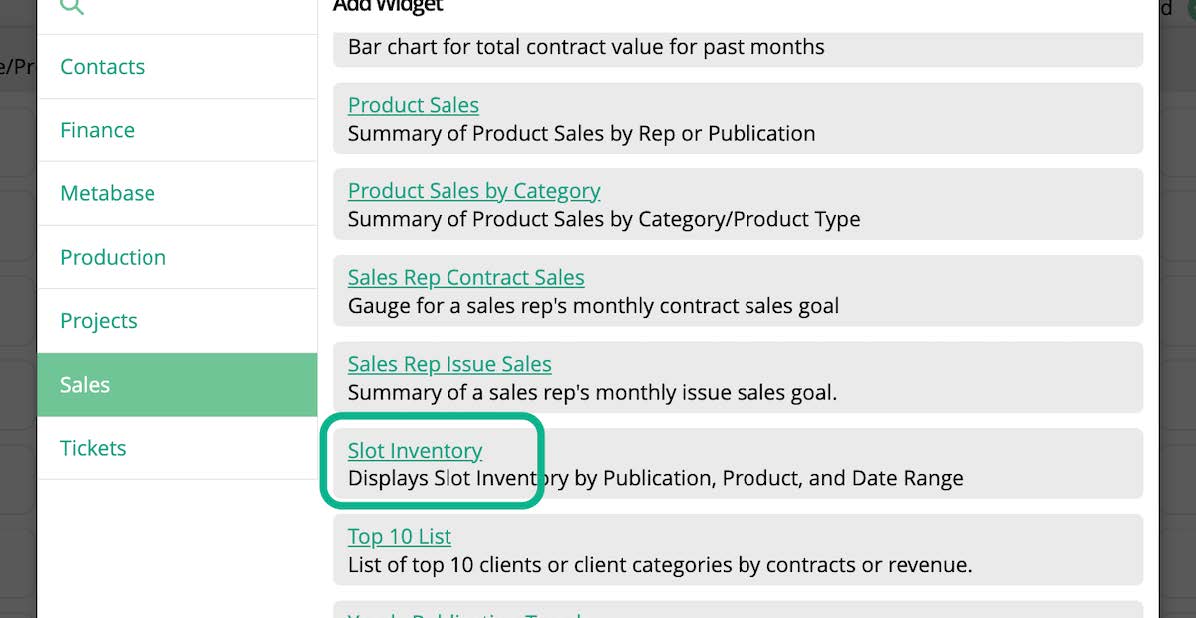
Then click on Slot Inventory
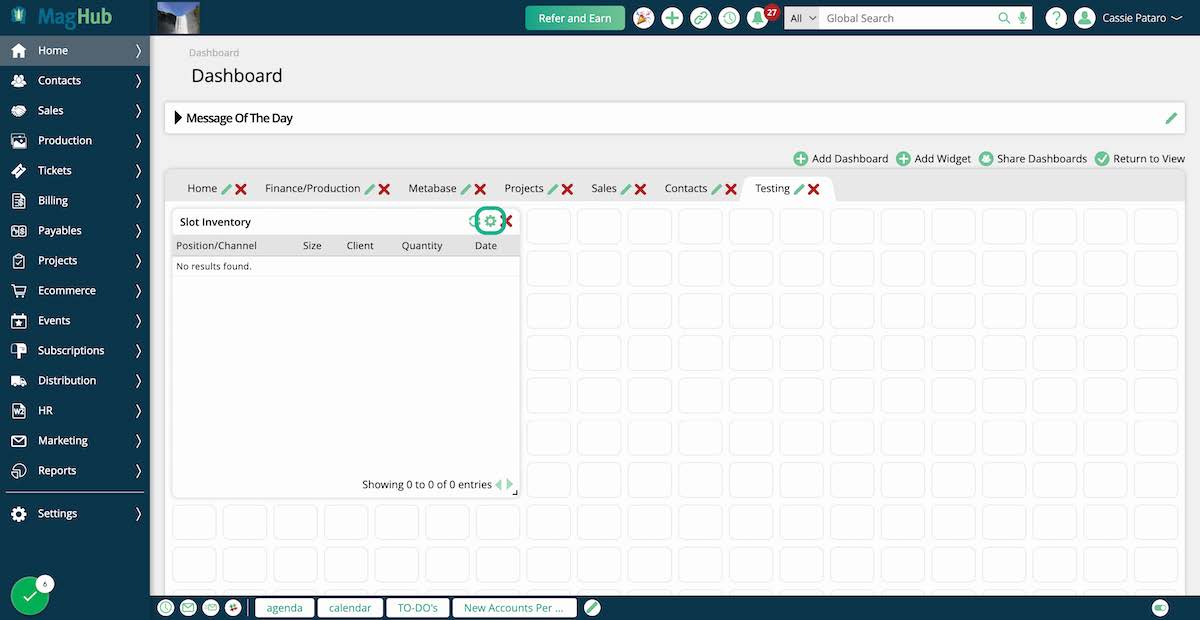
The widget will not display any information until you configure it, by clicking on the gear icon in the upper right corner.
In the edit popup, you can name your widget, and add it to the dock for easy access.
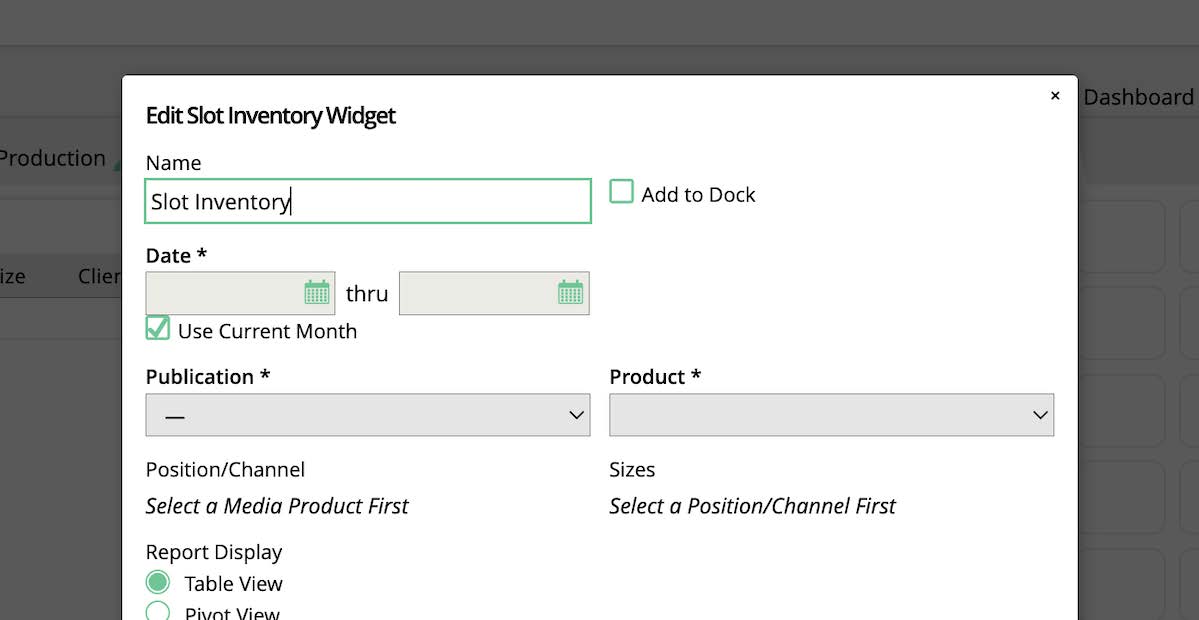
There are three required filters for the widget. The first is the date range. By default, the date will be set to the current month. If you uncheck this option, you can enter a custom date range. Both a start and end date is required.
The next required field is the Publication. You may only choose one Publication. Your Product list will be based on which Publication you choose.
And finally, the last required field is Product. The widget only supports viewing one Product at a time. If you need to see inventory data for multiple slot products, you will need to add multiple widgets to your dashboard. The Product chosen will determine what shows up in your Position/Channel and Sizes fields.
The Position/Channel field is optional, but can help narrow down your results if your slot product has multiple channels.
The Sizes field is also optional, and the options that show up here are determined both by the Product and Position/Channel selected. Once again, it can help narrow down your results.
The Report Display lets you choose how your results are shown. These are the same options as the Slot Inventory Report.
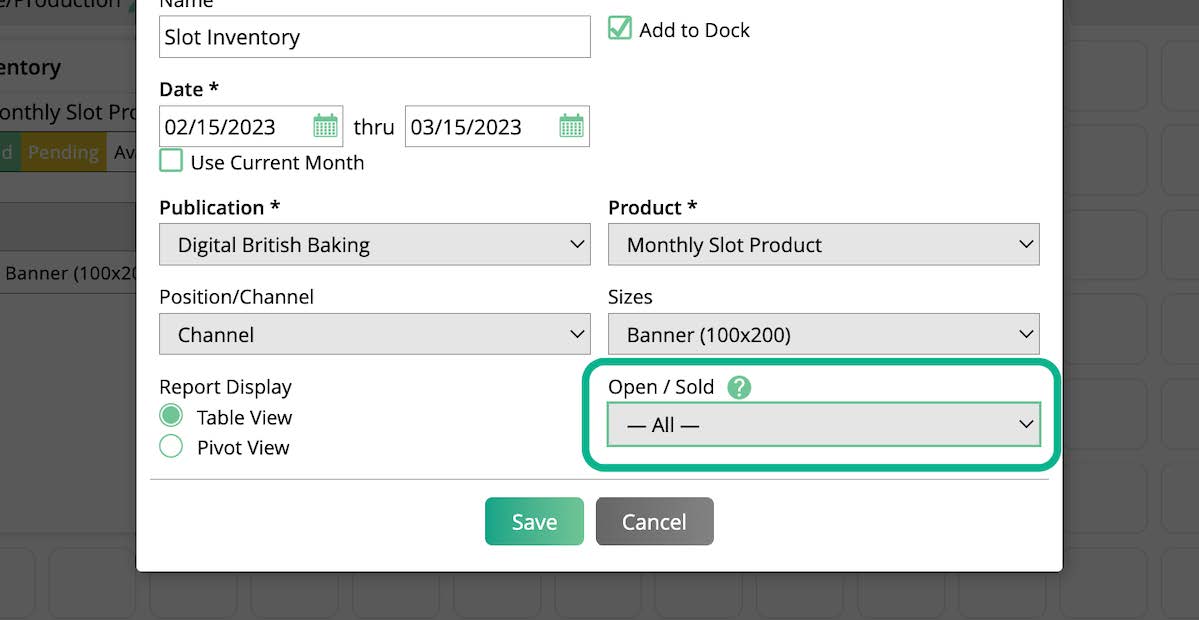
If you choose Table View for your Report Display, there's one additional field. The Open/Sold filter lets you find results based on inventory that is Open, Sold and Pending, or Sold. If this filter is left blank, the table will show all results.
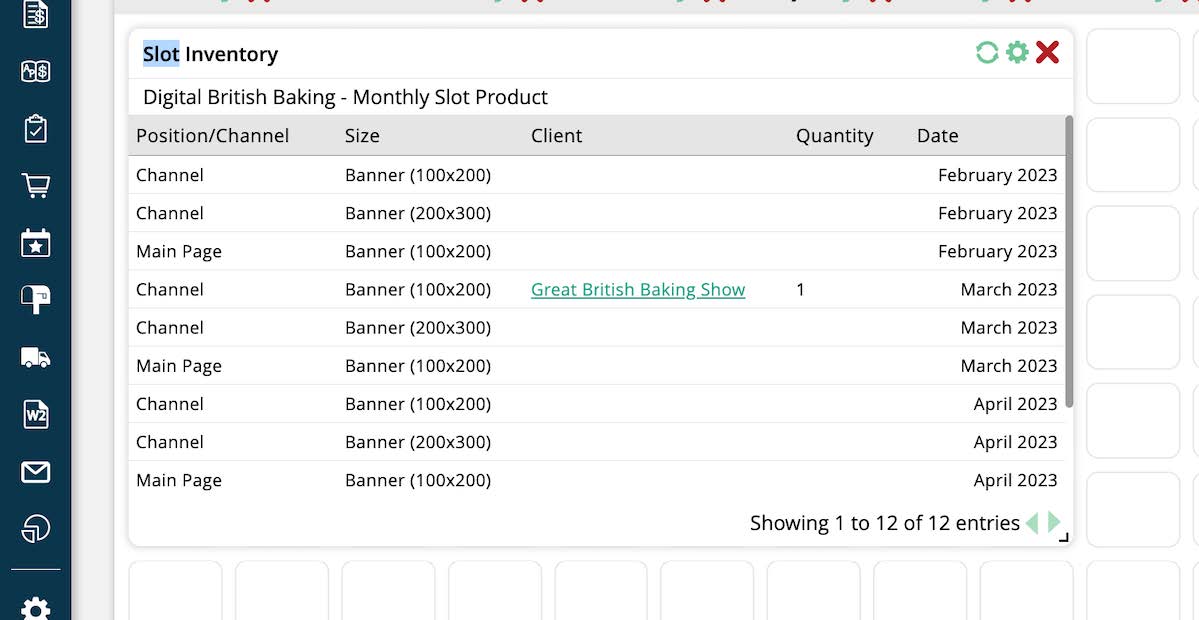
The table format is just what it sounds like, a table showing your slot inventory data. Each column header can be clicked on to sort the results by that column, and each company name is a link that will bring you to that company's Orders tab.
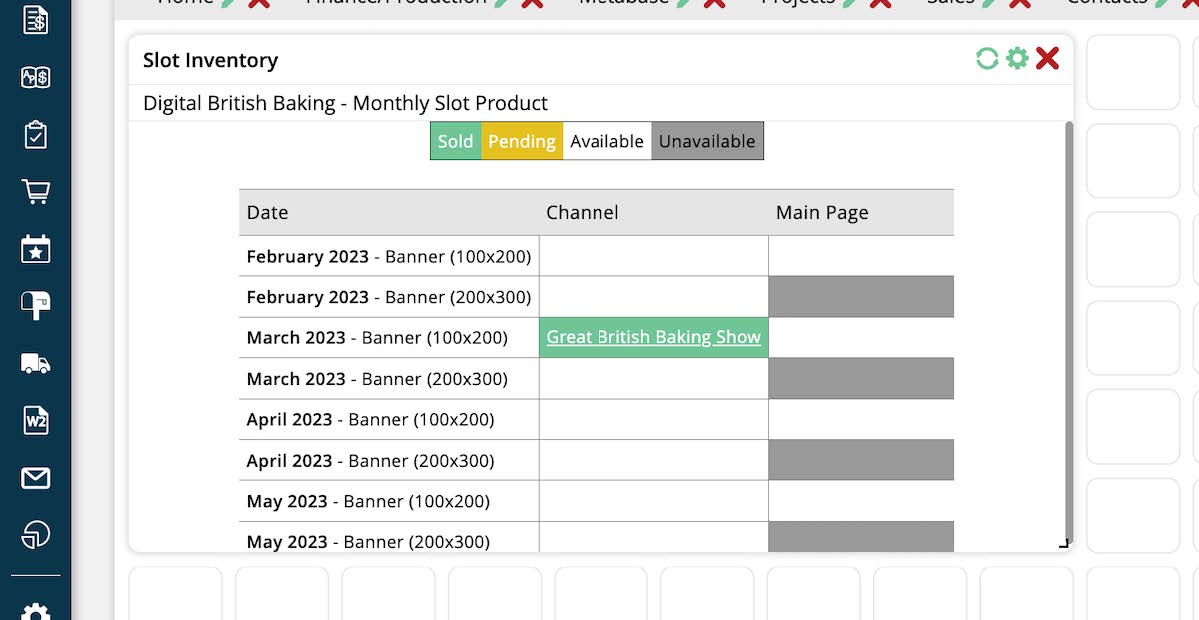
The pivot format is a visual representation of the same information contained in the table view.
Updated 3/09/2023