Creating Custom Marketing Dashboards with Metabase
Situation: As a marketing manager you might find yourself needing custom data and reporting. At Aysling, we found ourselves in a unique situation. We had begun marketing and selling two products. All leads were filtered into our single Aysling instance; however, we had to report on each product separately. Aysling’s Lead Status Report would suffice with custom criteria and fields; however, it was a multi-step process that was often challenging to explain to new employees that needed to gather that information as well.
Solution: Utilize the following Aysling components to create a one-stop Dashboard that would provide the specific information we would need on a moment’s notice. The components used were:
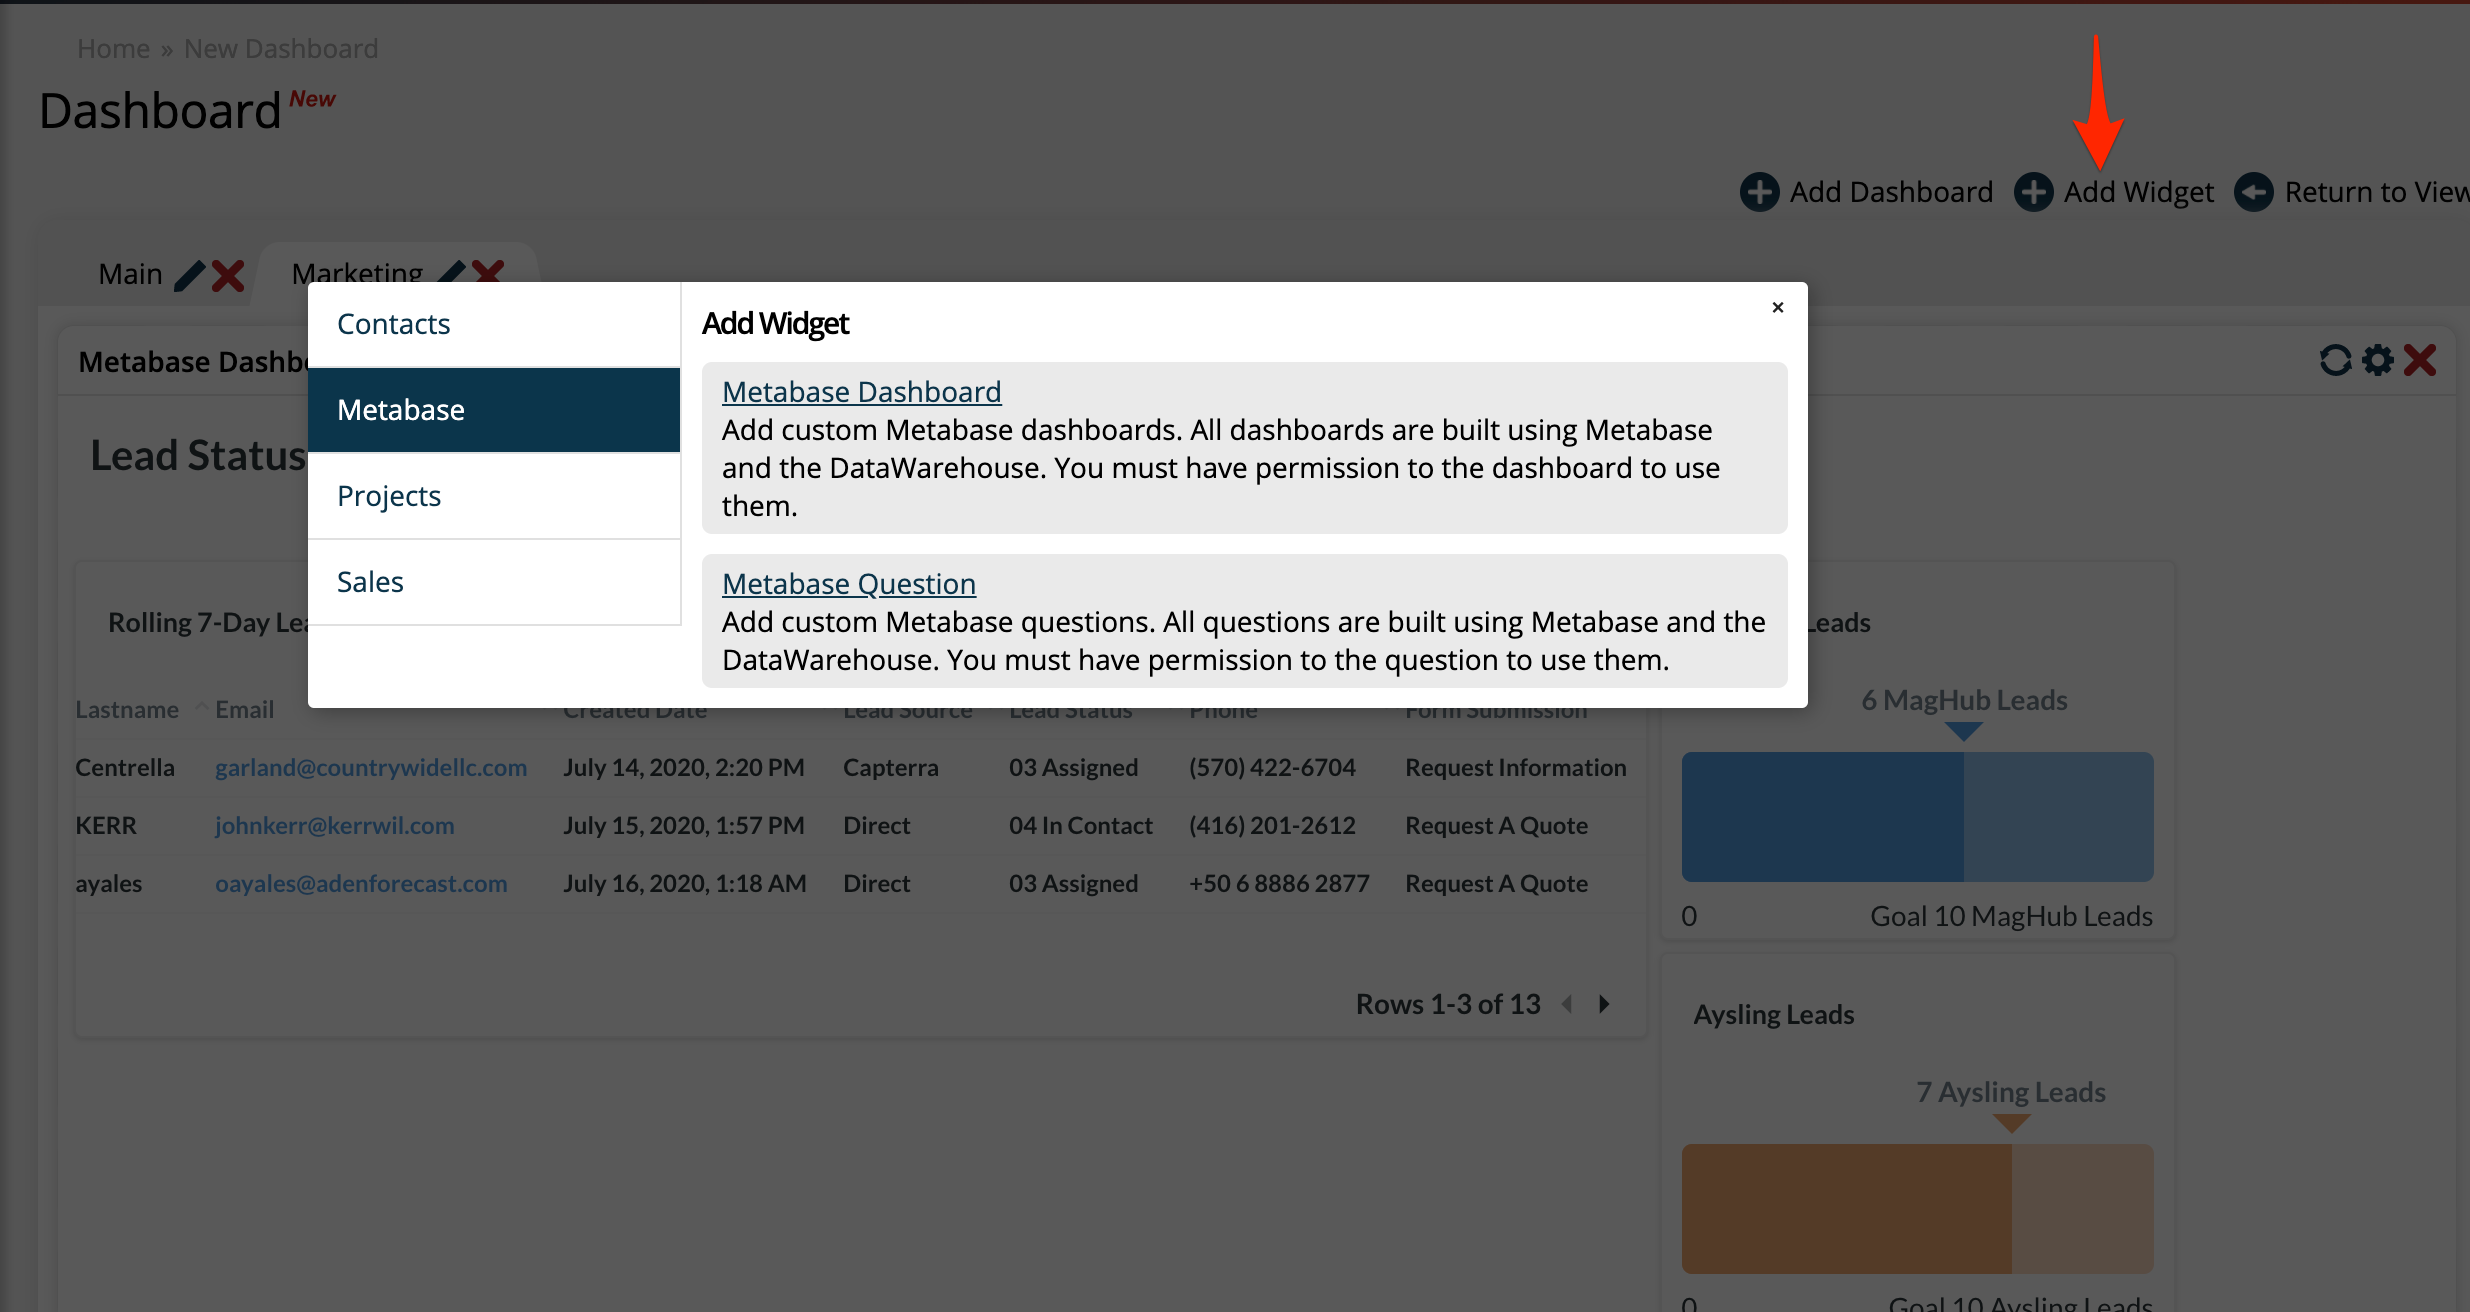
Dashboards: With Aysling’s customizable Dashboards we can use a variety of widgets that are needed in our daily operations inside Aysling. Primarily we used the Metabase widgets to show us reports that we created in Metabase.

Data Warehouse and Metabase: All data that lies within Aysling, is found within a Data Warehouse. This Data Warehouse is a vast archive of statistics that can be used to create custom reports unique to your business. Metabase is our integration partner that makes it easier to create custom visual reports with data from the Data Warehouse.

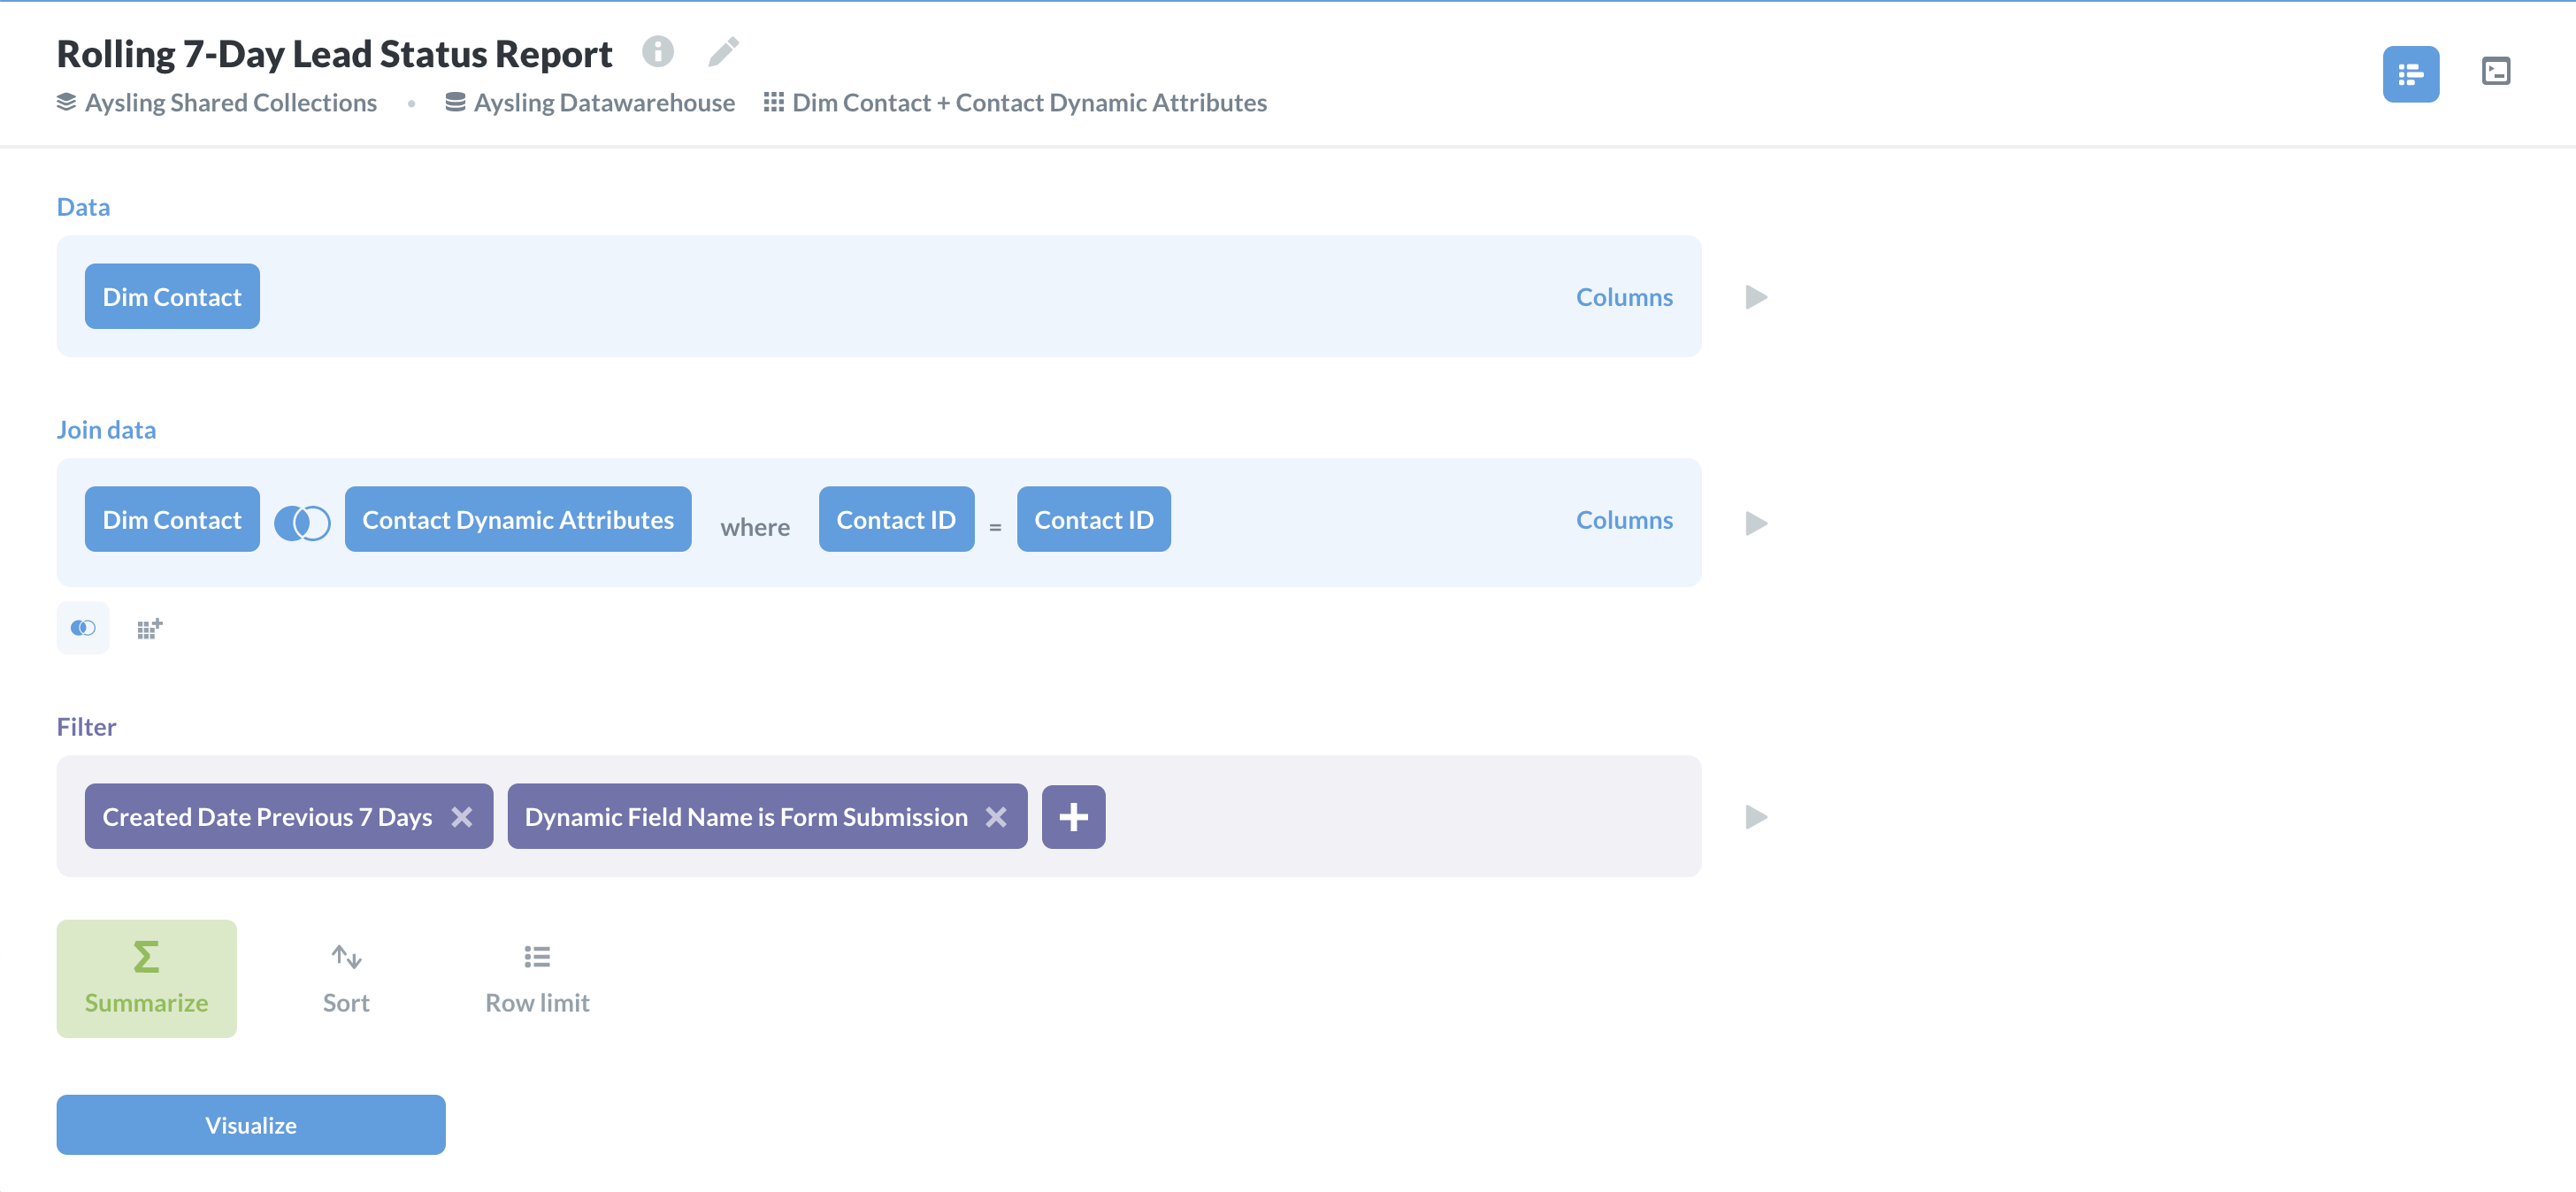
Contact Creation Date: This field is created when a contact is added to our Aysling instance.

Note
This field is populated whenever a contact is added, not just through inbound measures such as webforms. If a sales rep adds a contact, the contact will have this field; the same also goes for mass-importing. Therefore, a report that just pulls contacts from a period with Contact Creation Date, is not sufficient for a marketing manager.
Dynamic Attributes: When a new contact is created through one of our webforms, we have a few custom Dynamic Attributes associated with them. They are, Form Submission and Product of Interest. With these custom fields and the Contact Creation Date, we were able to filter out leads that were imported or manually entered.
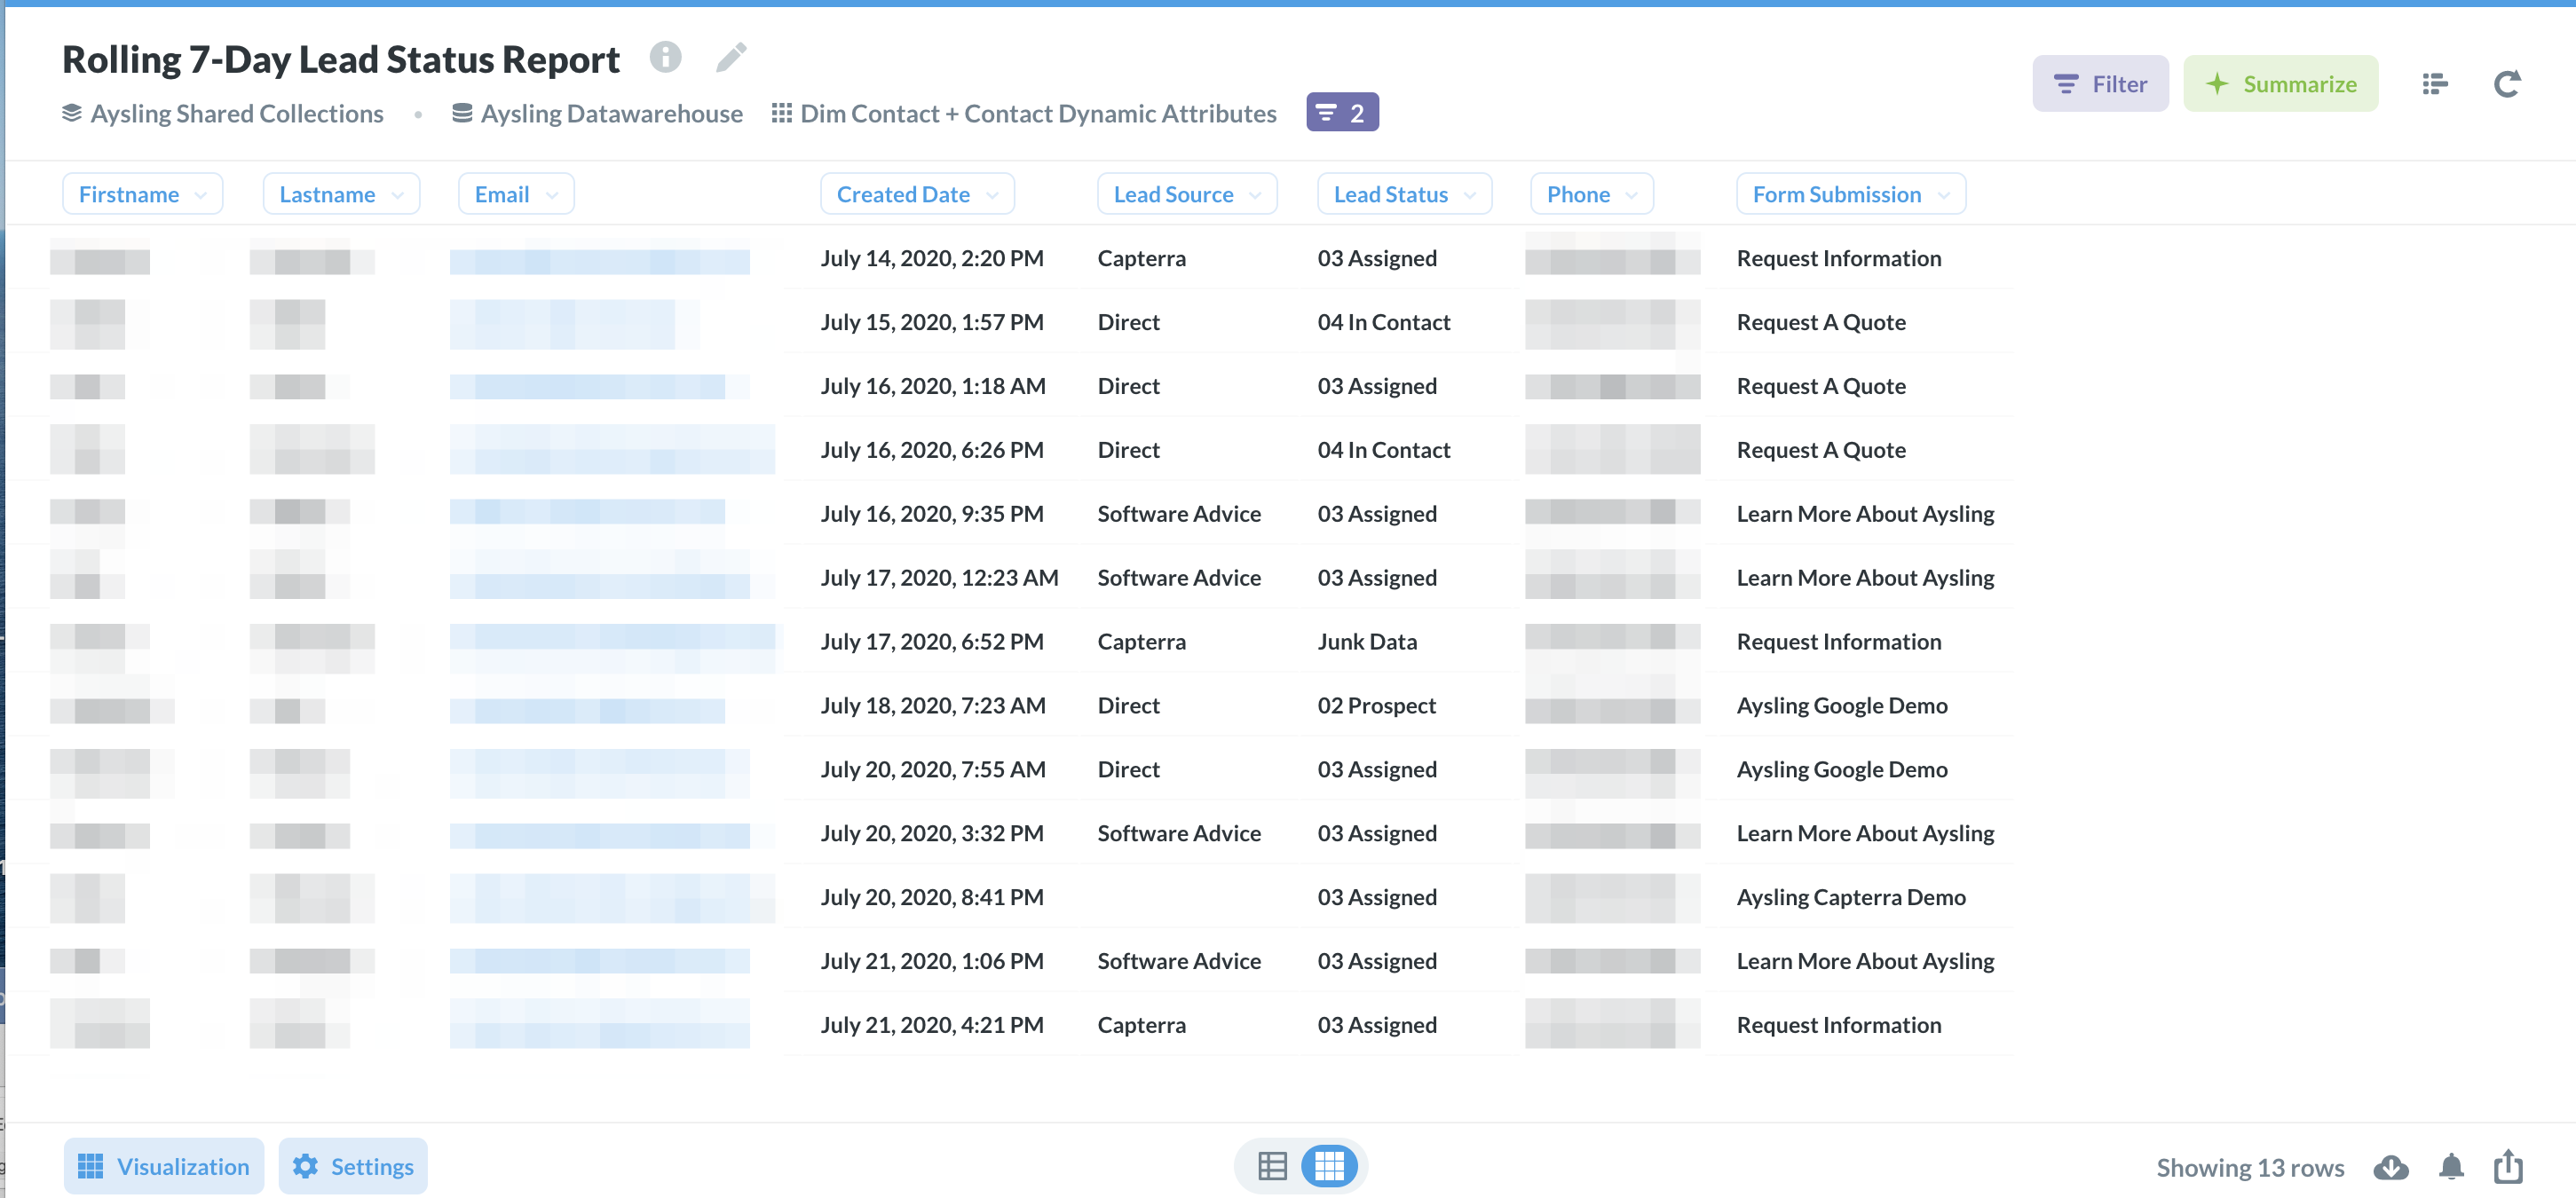
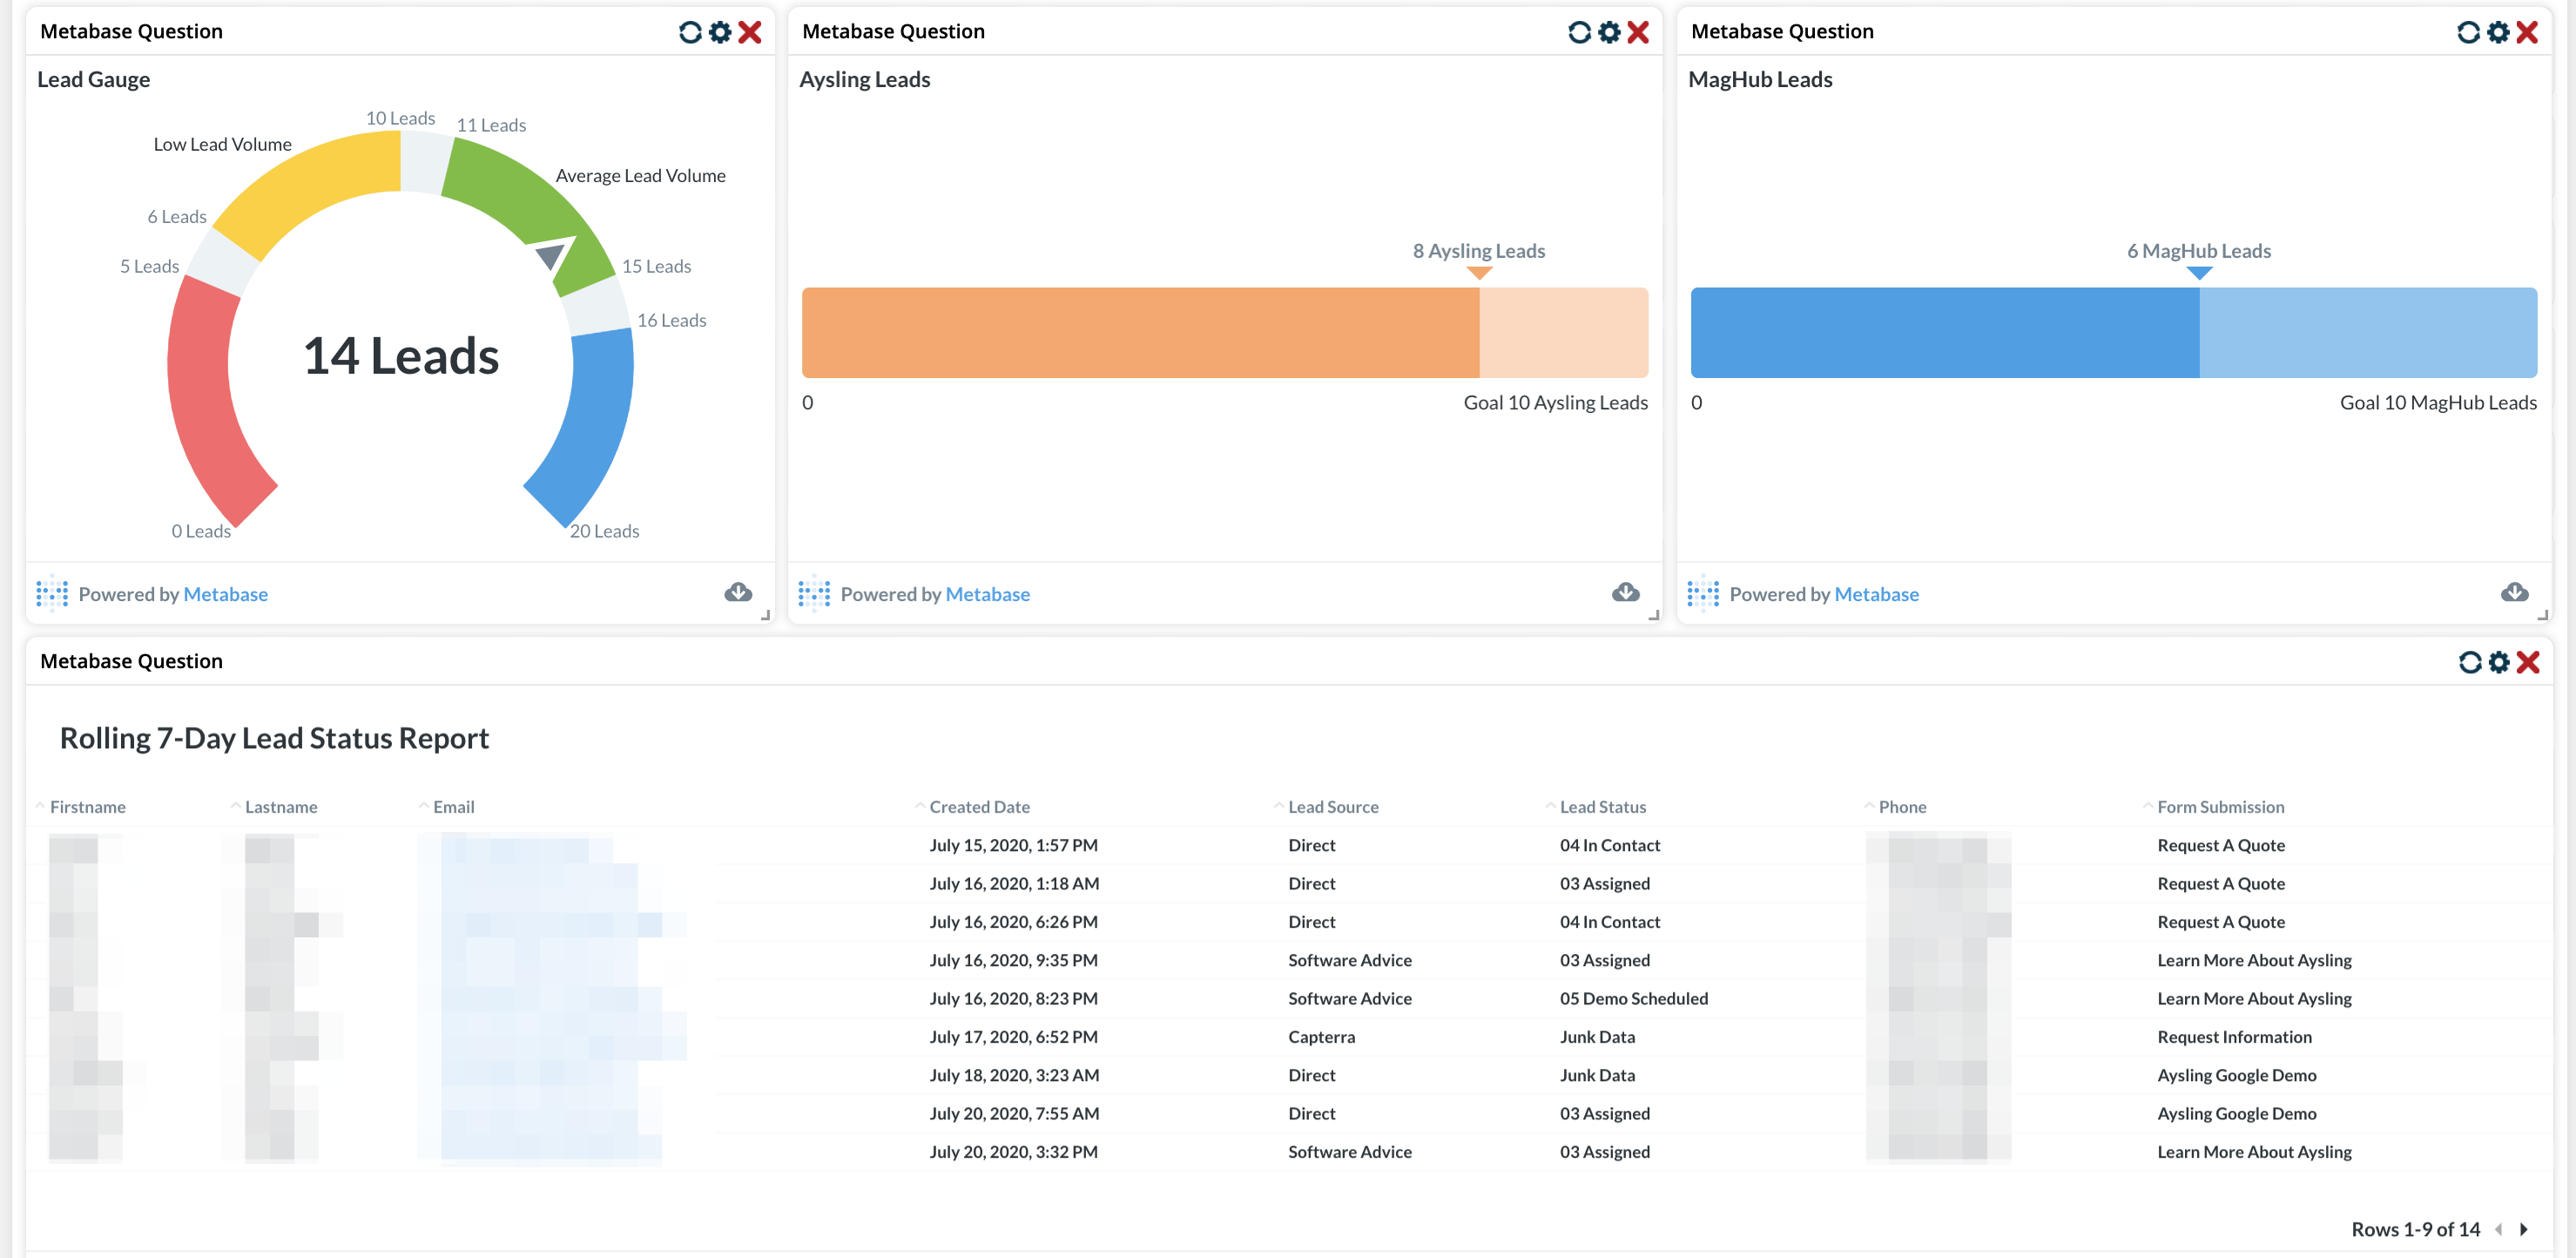
Resolution: Using Metabase, we first created a generic 7-Day Rolling Period Lead Status Report. This report would pull in all leads within a seven-day period that were captured through our webforms and live chat channels. The report would provide names, emails, and other important contact information. This report would be a good detailed report for anyone that captures webform leads. Digging deeper, we created two additional widgets: one for each of our products. These widgets would be visual progress bar reports. We established how many leads we needed to meet our marketing goal each week, and we filtered each widget to the specific product we wanted to monitor. Now, when our marketing manager logs into Aysling, they can simply go to their Dashboard and see how many leads they have gotten over a 7-day period, contact details of the leads, and what the ratio of leads are per product; without the need of manually updating a report each time they needed that information.
