How to use Gantt Chart
The Gantt Chart task view is as functional as the task table view. You can add and edit tasks, create dependencies, and switch between daily, weekly, and monthly views. Begin by navigating to a project’s Tasks tab.
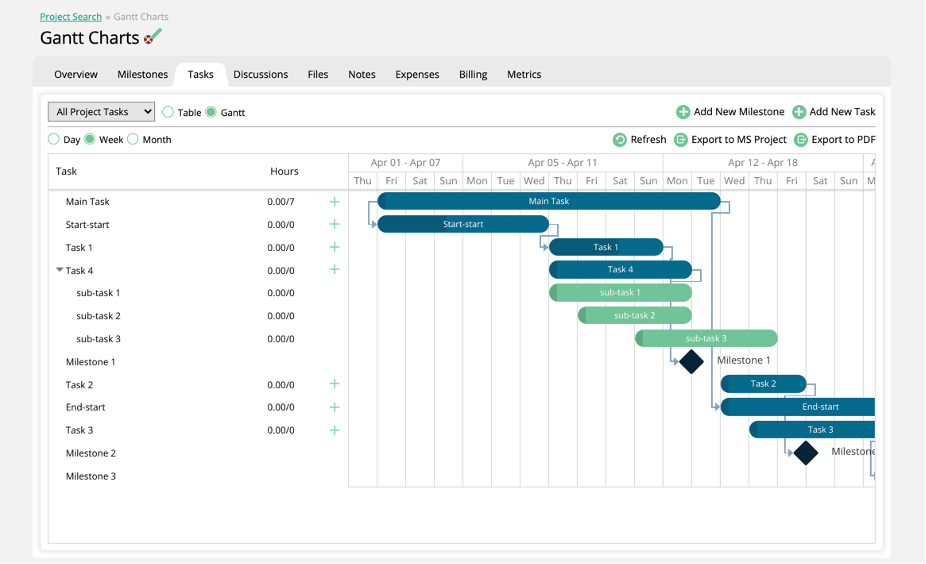
On the Tasks tab, click on the Gantt button to view your tasks in a Gantt Chart format, rather than a table.
Actions
You can perform all of the same actions from the Gantt view as from the table view, with some additional actions available.
You can add new tasks and milestones. Once the milestone or task is created, it will automatically update your chart.
There are options to export your chart to MS Project or as a PDF.
You can toggle between a few different views, depending on your preferences. The chart can be viewed on a Daily, Weekly, or Monthly basis, and you can choose whether to view All Project Tasks, My Tasks, or tasks by milestone. Both the task list and the chart will reflect the task option you selected.
Task List
The left side of the chart shows a list of all of the relevant tasks. This list may change depending on if you are filtering by My Tasks, or by specific milestone. Each task will have its name and hours displayed. The hours show both the allotted hours, and the number of hours actually recorded for the task.
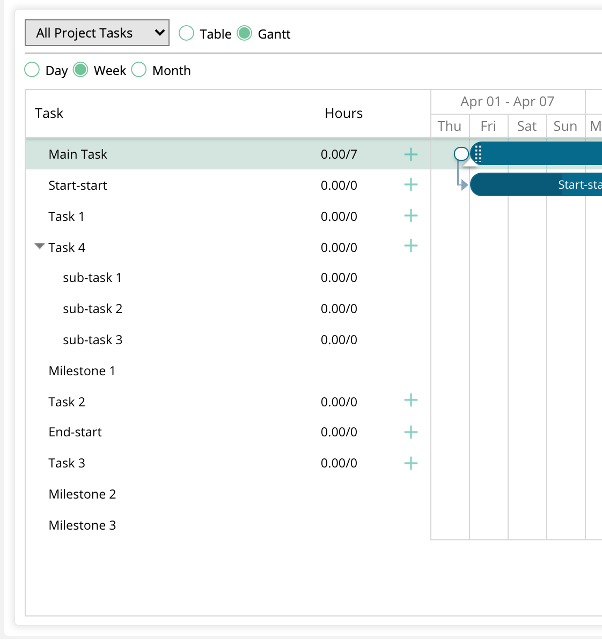
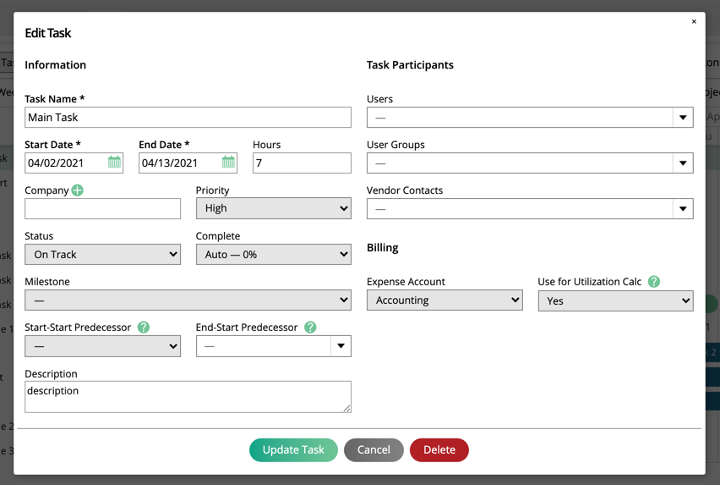
Double click on a task in the list to edit or delete the task.
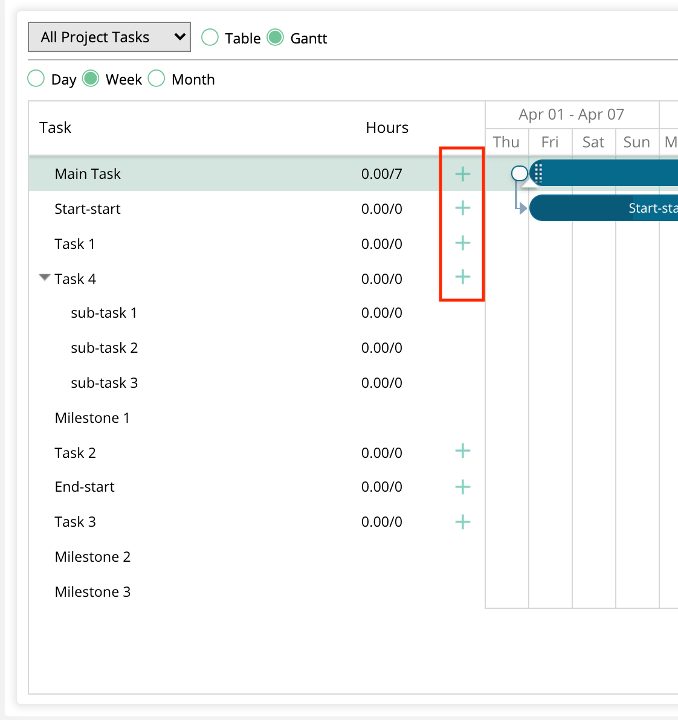
Use the + icon to add a sub-task.
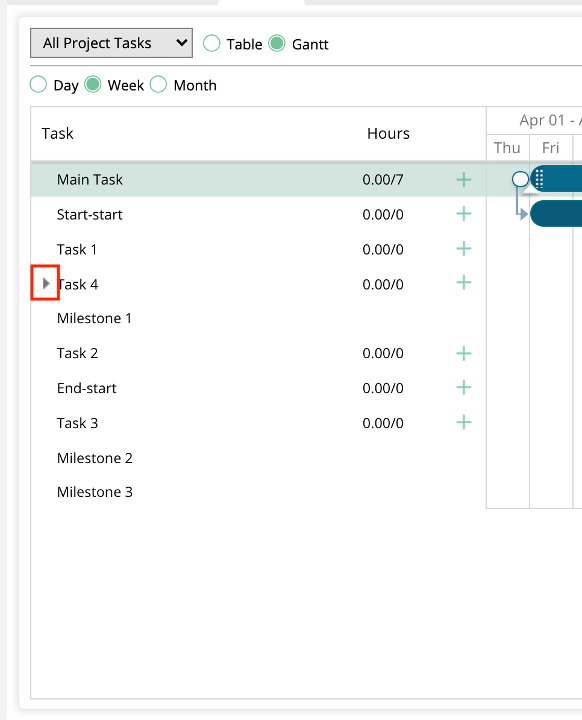
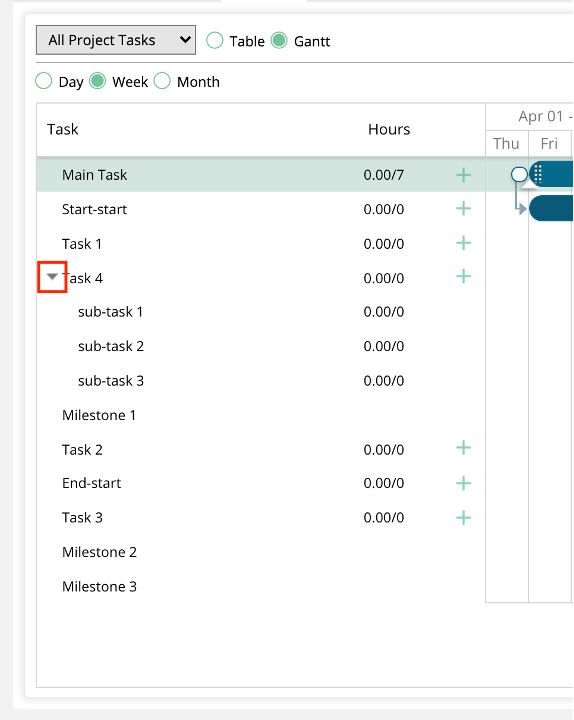
Use the arrow icon to collapse or display sub-tasks. This will affect the Gantt Chart as well. If your sub-tasks are collapsed in the list, they will not show up in the Gantt Chart either.
Hovering over a task in the list or the chart will show additional information about the task, including start and end date as well as the users that are assigned to the task.
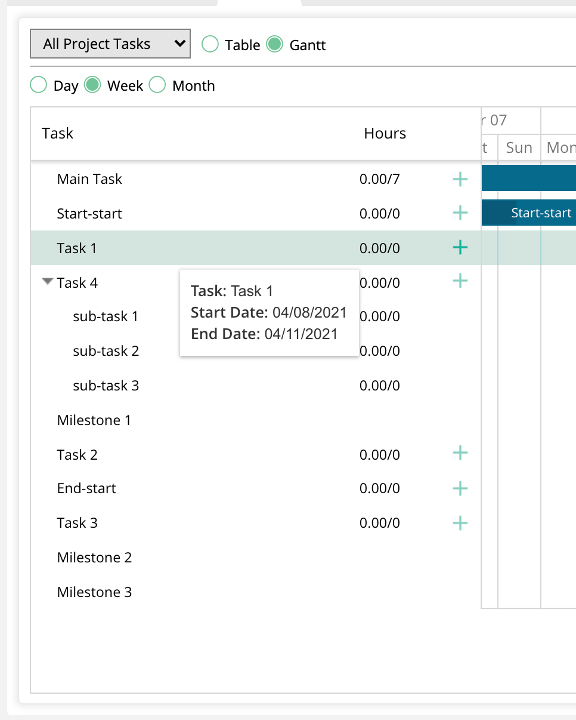
Chart Functionality
The right side shows the actual Gantt Chart. The formatting may vary slightly depending on whether you are viewing the chart by Day, Week, or Month.
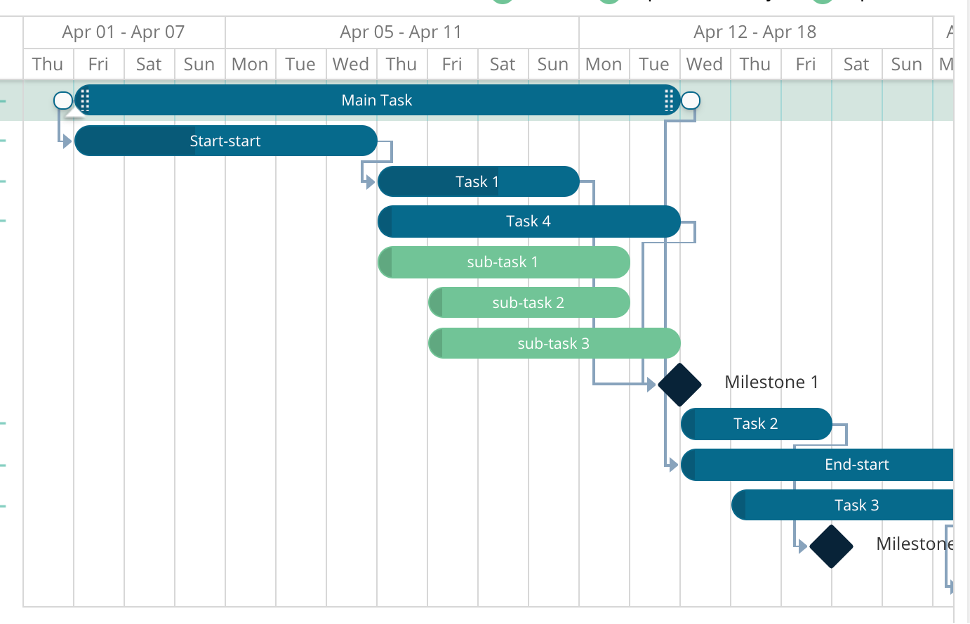
Hovering over a task will show additional details, including the task name, start and end dates, and who the task is assigned to.
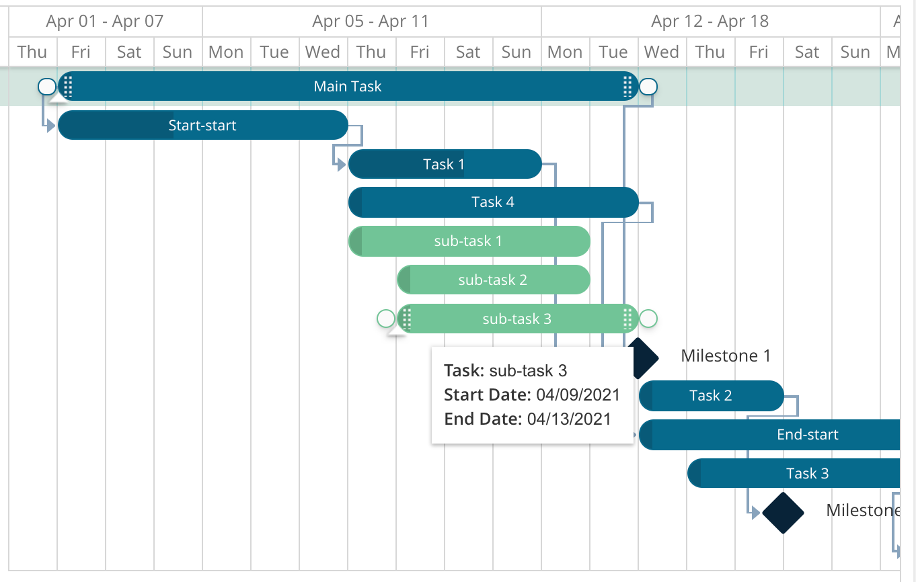
Double click on a task to edit or delete the task.
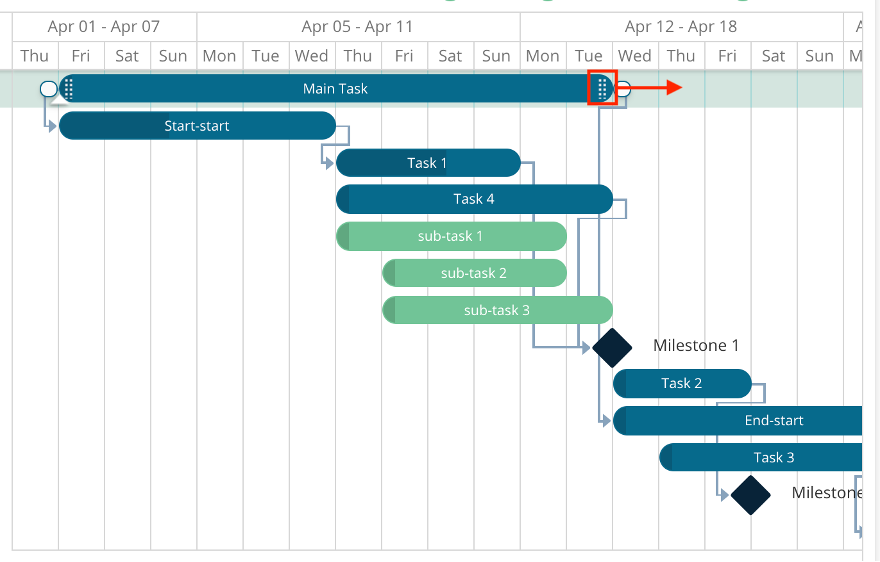
To change the start or end dates of your task, you do not need to open up the Edit popup. Instead, you can simply drag the end of the task bar to the desired date. If you drag and drop sub-tasks, the main task’s start and end dates will automatically update.
Note
The Work Week system configuration affects the Gantt Chart. If your organization’s work week is set to 5 days, then you will not be able to drag and drop the task to a weekend date – the task will automatically move to the nearest Friday or Sunday.
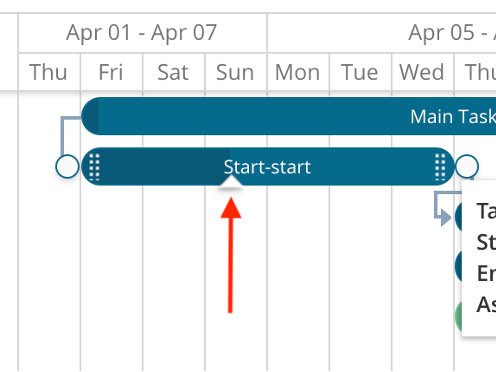
Drag and drop the triangle icon at the bottom of the task to change the task’s completion percentage. This will override the Auto complete functionality. The colors in the task bar will vary depending on the task’s completion. The darker shade of the bar is the amount of the task that has been completed. The lighter shade is the amount left.
Relationships between tasks and milestones show up in the chart as arrows.
Tasks that are tied to milestones will have an arrow going from the task to the milestone.

Task dependencies can vary depending on if it is a Start-Start dependency, or an End-Start dependency. Start-Start dependencies will have an arrow connecting the start dates of the two tasks, going from the predecessor to the dependent. End-Start dependencies have an arrow going from the end date of the predecessor task, to the start of the dependent task.
Note
You will be unable to drag and drop a Start-Start dependent task to before the start date of its predecessor. Similarly, you cannot drag and drop an End-Start task to start before the end of its predecessor task.

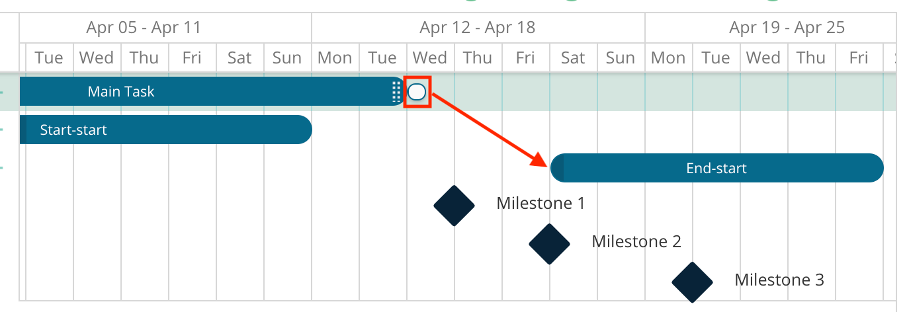
Not only can you see the relationships between tasks, you can create them from the Gantt chart. To create task dependencies, click on the circle at the start or end of a task, and drag it to connect with the start or end of another task.
Note
Only Start-Start and End-Start dependencies are supported. If the second task’s circle shows up in red, that dependency cannot be created. If it shows up in gray, the dependency can be created.
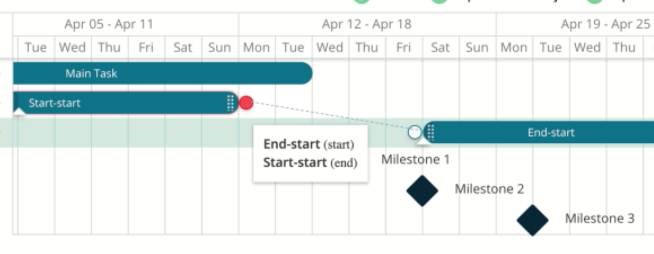
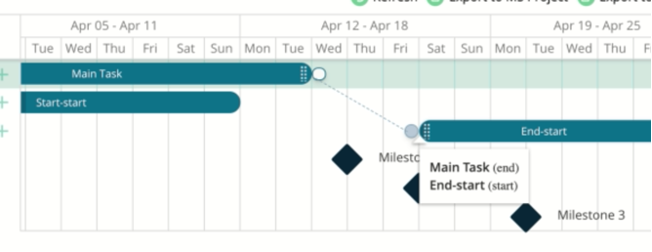
You can also double click on a circle to delete a dependency. The system will first ask you to confirm you want the relationship deleted.
You can perform all the same actions from the Gantt view as from the table view, with some additional actions available.
You can add new tasks and milestones. Once the milestone or task is created, it will automatically update your chart.
You can toggle between a few different views, depending on your preferences. The chart can be viewed by day, week, month, quarter, or year. The zoom in/zoom out buttons can also be used to change how much time shows up on the chart. You can also choose whether to view All Project Tasks, My Tasks, or tasks by milestone. Both the task list and the chart will reflect the task option you selected.
Updated 4/27/2023